Yao J, Burton JL, Saama P, Sipkovsky S, Coussens PM: Generation of EST and cDNA microarray resources for the study of bovine immunobiology. Acta vet. scand. 2003. Suppl. 98, 89-103. – Recent developments in expressed sequence tag (EST) and cDNA microarray technology have had a dramatic impact on the ability of scientists to study the responses of thousands of genes to external stimuli, such as in-fection, nutrient flux, and stress. To date however, these studies have largely been lim-ited to human and rodent systems. Despite the tremendous potential benefit of EST and cDNA microarray technology to studies of complex problems in domestic animal species, a lack of integrated resources has precluded application of these technologies to domestic species. To address this problem, the Center for Animal Functional Ge-nomics (CAFG) at Michigan State University has developed a normalized bovine total leukocyte (BOTL) cDNA library, generated EST clones from this library, and printed cDNA microarrays suitable for studying bovine immunobiology. Our data revealed that the normalization procedure successfully reduced highly abundant cDNA species while enhancing the relative percentage of clones representing rare transcripts. To date, a to-tal of 932 EST sequences have been generated from this library (BOTL) and the se-quence information plus BLAST results made available through a web-accessible database (http://gowhite.ans.msu.edu). Cluster analysis of the data indicates that a total of 842 unique cDNAs are present in this collection, reflecting a low redundancy rate of 9.7%.
For creation of first generation cDNA microarrays, inserts from 720 unique clones in this library were amplified and microarrays were produced by spotting each insert or amplicon 3 times on glass slides in a 48-patch arrangement with 64 total spots (includ-ing blanks and positive controls) per patch. To test our BOTL microarray, we compared gene expression patterns of concanavalin A stimulated and unstimulated peripheral blood mononuclear cells (PBMCs). In total, hybridization signals on over 90 amplicons showed upregulation (>3x) in response to Con A stimulation, relative to unstimulated cells. A second experiment with PBMCs from a different group of animals was per-formed to test reproducibility of microarray results. There was a high correlation be-tween the 2 experiments (r= 0.72, P < 0.001). Resources described in this publication offer a highly efficient and integrated system to study gene expression changes in bovine leukocytes.
expressed sequence tag; bovine leukocytes; normalization; cDNA microarray; EST; database.
Generation of EST and cDNA Microarray Resources
for the Study of Bovine Immunobiology*
By J. Yao, J. L. Burton, P. Saama, S. Sipkovsky, andP. M. Coussens
Department of Animal Science and Center for Animal Functional Genomics, Michigan State University, East Lansing, USA.
–––––
Introduction
New DNA microarray technologies have been developed that allow large-scale screening of gene expression patterns in many biological models (functional genomics). These technolo-gies offer the prospect that all genes within an organism can be scrutinized to obtain inte-grated information on biological systems that is not currently obtainable using traditional re-ductionist approaches (Bowtell1999). Comple-mentary DNA (cDNA) microarray technology, in particular, has become a central technical platform for functional genomics experiments (Kurian et al.1999, Schena et al.1998, Schena et al.1995).
From a human health perspective, the volumes of recent biomedical literature on the subject and number of large biomedical corporations adopt-ing microarray technology provide evidence of utility in human medicine and biology (Barrans et al.2001, Bull et al.2001, Ellisen et al.2001,
Geraci et al. 2001, Heller et al.1997, Jin et al.
2001, Kallioniemi2001, Kennedy2000, Khanna et al. 2001, Lewohl et al.2001, Manger & Rel-man 2000, Meltzer2001, Schena et al. 1996). However, relatively little attention has been drawn to the power of microarray technology to better understand diseases of economically sig-nificant livestock species. This is curious be-cause study of the most significant livestock dis-eases is tremendously daunting due to the variety of complex factors that form the basis for sus-ceptibility to production diseases. Some of these factors include genetic selection pressure for production over fitness, routine husbandry stress, application of growth and milk produc-tion-enhancing biotechnologies, and extreme variations in climate and nutrition (Blecha1988,
Collier et al.1982, Galyean et al.1999, Lewin
1989, Preisler et al. 2000). Indeed, the widespread occurrence of very complex produc-tion diseases that have been difficult or impossi-ble to resolve are of key economic and societal
concern today, and will continue to be in the fu-ture.
Materials and methods
Construction of the cDNA library
The bovine total leukocyte (BOTL) library was constructed using a commercial cDNA synthe-sis system (Invitrogen Life Technologies, Inc. Gaithersburg, MD). Poly (A)+RNA was puri-fied from total peripheral blood leukocytes iso-lated from pooled blood samples of 4 normal mid-lactation Holstein dairy cows. First-strand cDNA synthesis was performed using the oligonucleotide 5’-GACTAGTTCTAGATCG-CGAGCGGCCGCAATTAAT15-3’, which con-tains a NotI site (underlined) and an AATTAA sequence as a tissue-specific tag. The subse-quent steps for construction of the library were performed essentially according to the manu-facturer’s instructions. Double-stranded cDNA fragments were cloned directionally into the SalI and NotI sites of the plasmid vector pSPORT1 (Invitrogen Life Technologies) and the library was amplified in a semi-solid medium to minimize biased growth of primary transformants.
Normalization of the cDNA library
Normalization of the library was performed us-ing a modification of a method (Method 4) de-scribed by Bonaldo et al.(1996), which is based on the different re-association kinetics for cDNA molecules of different relative abun-dance. Briefly, double-stranded plasmid library DNA was converted to single-stranded circles through the combined actions of Gene II pro-tein and Exonuclease III provided within a Gene Trapper II kit (Invitrogen Life Technolo-gies). A fraction of these single-stranded plas-mids was used to generate PCR-amplified cDNA inserts using primers recognizing se-quences on pSPORT1 flanking the inserts. The amplified products were purified using Sephadex spin-columns (Amersham Pharma-cia, Inc., Buckinghamshire, UK) and ethanol precipitated. Approximately 3 µg of the purified
PCR products (denatured) were used to hy-bridize with 150 ng of single-stranded library plasmid in a 30 µl reaction volume containing 50% formamide, 10 mM Tris-HCl pH 7.5, 1 mM EDTA, 0.5 M NaCl, and blocking oligonu-cleotides. The hybridization was performed at 30° C for 24 hrs. Single-stranded circles re-maining after hybridization were purified by hydroxyl appatite (HAP) chromatography and converted to double-stranded plasmid by primer extension using an oligonucleotide complementary to the single-stranded plasmid DNA (M13-reverse primer). The resulting dou-ble-stranded plasmids were then electroporated into E. coliDH10B, generating the normalized BOTL library.
Southern blot analysis
To determine the relative abundance of cDNA inserts representing various transcripts in the BOTL library, 0.5 µg of plasmid DNA from the original and normalized libraries were separately digested with NotI and SalI, separated on 1% agarose gels and blotted onto Zeta-probe brane (Bio-Rad Inc., Hercules, CA). The mem-branes were separately hybridized at 68 °C in PerfectHyb solution (Sigma Chemical Co., St. Louis, MO) with 32P-labeled PCR-amplified cD-NAs (amplicons) for GAPDH, elongation factor 1, ribosomal protein L12, and ribosomal protein S3A to detect high-abundance transcript clones. To detect medium and low-abundance transcript clones, 32P-labeled PCR-amplified cDNAs re-presenting Rab7 and CD40L, respectively were used as probes. Membranes were washed twice in 2X SSC/0.1% SDS at room temperature and twice at 65 °C in 0.2x SSC/0.1% SDS. Washed membranes were wrapped and exposed to BioMax MS film (Fisher Scientific, Pittsburgh, PA) to visualize bands.
DNA sequencing and sequence analysis
onto 150 mm plates containing LB agar supple-mented with 50 µg/ml ampicillin. Colonies were randomly picked from the agar plate and transferred to 96-well plates using a GeneTAC G3 robot equipped with a 48-pin pneumatic colony picking head (Genomic Solutions Inc., Ann Arbor, MI). Cultures were grown in the 96-well plates overnight and plasmid DNA isolated using the QIAprep 96 Turbo miniprep kit (Qia-gen Ltd., Valencia, CA) according to the manu-facturer’s instructions. Sequencing reactions were performed using a BigDye terminator se-quencing kit (Perkin-Elmer/ABI, Palo Alto, CA) and analyzed on an ABI 3700 DNA ana-lyzer. Sequence data were outputed to Geospiza software (Geospiza, Inc., Seattle WA) and picked up via password-protected web access. Final sequences were exported in FASTA for-mat into our database program that directs basic local alignment search tool (BLAST) searches against the GenBank nonredundant (nr) database using the BLASTN and BLASTX programs. For information on similarity be-tween clones within our database and the Gen-bank dbEST, the entire dbEST was downloaded and sequences with bovine in the annotation parsed to a separate file, resulting in 877 Mb of information representing 170 546 bovine ESTs. A BLAST searchable database was then created from this file, to allow local blast analysis. Fi-nally, sequences from our EST database were compared to the 170 546 sequences in the bovine EST-specific file.
EST database presentation and management
A Bioinformatics server running on a SUN Ultra2 workstation is provided for storage of the EST data, BLAST searches for sequence homology, storage of results from the BLAST search, and dissemination of stored results and data via a WWW interface (http://gowhite. ans.msu.edu/). Sequence data and annotation information are stored in an Oracle database
(Oracle Corp., Redwood Shores, CA). Access to these data is through a Turnkey system (INCOGEN, Inc. Clemson, SC). The oracle data can be accessed via Oracle Client (Net8) software, The Statistical Analysis System, PHP OCI8, and Perl DBI:Oracle. On a routine basis, Perl and PHP scripts perform the tasks of the Turnkey System. These include: 1) Adding se-quence data in FASTA format to the database system; 2) Executing BLASTN and BLASTX searches on the new data; 3) Updating the Turnkey Web BLAST data files in the Turnkey system; 4) Clustering the sequence data using a hashing algorithm, as implemented in the tl-cluster software (http://ratest.eng.uiowa.edu/ pubsoft/software.html); and 5) Loading clus-tered data into the database.
Production of cDNA microarrays
each clone was represented on the final mi-croarrays. This check also allowed final adjust-ment for differences in amplicon concentration just prior to microarray source plate set up. Fi-nally, a total of 5 µl of each purified amplicon was transferred to 384-well microarray source plates.
Microarrays were spotted using a GeneTAC G3 arraying robot (Genomic Solutions, Inc., Ann Arbor, MI) equipped with a 48-pin head, with each pin having a nominal end diameter of 200 microns. In 50% DMSO (low-density arrays), this arrangement yields spots of approximately 250-350 microns. The pin configuration of the G3 yields microarrays consisting of 48 “patchs” of spots. A microarray design was de-rived that allowed triple spotting of each clone within a patch and an overall 8x8 spot pattern in each patch (64 spots per patch). Microarray source plates were designed such that each patch would contain 3 GAPDH amplicons (controls for RNA loading differences and po-tential dye effects). In addition, each patch tained 2 synthetic lambda Q gene positive con-trol spots, 17 blanks to concon-trol for background effects on a patch specific basis, and 1 DMSO only spot. Three blanks surround one lambda Q gene spot in the upper right corner of each patch, establishing a landmark for subsequent microarray image orientation and analysis (for microarray image, see our companion paper,
Burton et al.2001, this issue).
Preparation of PBMCs, RNA extraction, labeling and hybridization
For assessment of microarray utility in studying bovine immunobiology, blood samples from 3 healthy mid-lactation Holstein cows were ob-tained from the coccygeal (tail) vein using 2.5 cm 21 guage multiple sample needles and a series of four 6 ml vacutainer tubes containing acid citrate dextrose (ACD) as an anticoagu-lant. Peripheral blood monocytes were prepared
as previously described (Burton et al. 1996). Briefly, blood samples were centrifuged at 4 °C for 10 min at 1000 xg and the resulting buffy coat (approximately 2 ml) transferred to a new 50 ml conical tube containing 34 ml of ice-cold sterile PBS overlaid on a 10 ml cushion of Per-coll (1.084 g/ml, Sigma Chemical Co., St. Louis, MO). Cells were centrifuged at 1000 ×g for 40 min at room temperature to separate ery-throcytes and polymorphonuclear leukocytes from mononuclear cells. Following careful as-piration of the PBS, PBMCs lying at the PBS/Percoll interface were transferred to a new 50 ml conical tube, rinsed once with 20 ml of sterile PBS and finally resuspended in mainte-nance medium RPMI-1640 containing 10% heat-inactivated fetal bovine serum (FBS), 2mM L-glutamine, 100U/ml penicillin, and 100 µg/ml streptomycin. PBMCs from all ani-mals were combined at this point and gently mixed. The total volume was adjusted to 20 ml with maintenance medium and the mixed PBMCs were split into 2 equal fractions of 10 ml. One fraction received 100 µl of sterile PBS (unstimulated) while the second fraction re-ceived 100 µl of PBS containing 2.5 mg/ml of concanavalin A (Con A stimulated), resulting in a final concentration of 25 µg Con A per ml. Cells were incubated overnight (18-20 hours) in a humidified atmosphere of 5% CO2and 95% air at 39° C.
RNA was extracted from the unstimulated PBS control and Con A-stimulated PBMCs using Trizol reagent (Invitrogen Life Technologies, Inc., Gaithersburg MD). Quantity and quality of extracted total RNA was estimated by UV spectrophotometry and electrophoresis on 1.2% native agarose gels. Integrity of separated 28S and 18S RNA bands on these gels serves as a good indicator of RNA quality and separation on agarose gels is a sensitive method for detect-ing degraded RNA.
from Con A stimulated cells was used as tem-plate in a reverse transcription reaction incor-porating an amino-modified dUTP into the cDNA (Clonetech Atlas Glass labeling system, Clonetech Inc., Alameda CA). Oligo (dT)15 was used as primer and 1-2 ng of synthetic lambda Q gene RNA containing an engineered poly A tail was spiked into the reaction as a control for cDNA synthesis and as a positive hybridization control. Following first-strand cDNA synthesis, the sample was split into 2 equal portions for differential labeling with Cy3 and Cy5 as described below. This process produced 2 differentially labeled samples that should have identical gene expression levels at each spot on the BOTL microarray.
For Con A Experiments 2 and 3, control unstimulated and Con A-stimulated PBMC cD-NAs were differentially labeled using NHS-derivatized Cy3 and Cy5 dyes, respectively (Amersham Pharmacia, Ltd.). Labeled cDNAs were extensively purified following the Clone-tech Atlas Glass labeling system instructions to remove unincorporated dyes. The purified la-beled cDNAs were then combined and concen-trated to 4-10 ul using Microcon 30 spin con-centrators (Millipore Corp.). Microarray hy-bridizations were performed by addition of concentrated Cy3 and Cy5 labeled probe cDNAs to 45 µl of GlassHyb (Clonetech, Inc.), supplemented with 10 µg/ml BSA and 10 ug/ml denatured salmon sperm DNA. Hybridizations were conducted for 18-20 hours at 50° C in sealed and humidified chambers (Arrayit, TeleChem International, Inc., Sunnyvale, CA). Following hybridizations, the microarrays were washed twice at room temperature in 1x SSC/0.05% SDS and once at 50° C in the same solution. Washed microarrays were rinsed in ddH2O and dried by centrifugation in a cush-ioned 50 ml conical centrifuge tube. Final mi-croarrays were scanned immediately using a GeneTAC LS IV microarray scanner and
Gene-TAC LS software (Genomic Solutions, Inc., Ann Arbor, MI). GeneTAC analyzer software was then used to process microarray images, find spots, integrate robot-spotting files with the microarray image, and finally create reports of either spot intensity ratios or total spot re-ports. For Con A experiments 2 and 3, different groups of 3 healthy mid-lactation Holstein cows were used as a source of PBMCs.
Results
Characterization of the normalized cDNA library
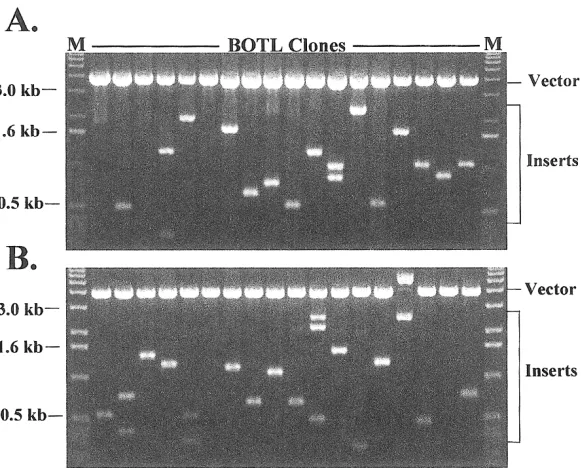
Using Poly (A)+RNA isolated from bovine to-tal leukocytes from 4 healthy mid-lactation Holstein cows, we constructed a directionally cloned cDNA library (BOTL) with a tissue-specific tag sequence (AATTAA) at the 3’end of each cDNA. The quality of this original li-brary was first evaluated by titration of the orig-inal electroporated bacterial stock and restric-tion analysis of plasmid DNA prepared from 18 clones randomly picked from the library. The li-brary was estimated to contain a total of 1.1 × 10⁶ independent clones. Restriction analysis showed that 15 out the 18 randomly selected cDNA clones contained inserts with an average size of 1.2 kb (Fig. 1, Panel A). The library was then amplified in a semi-solid media and plas-mid DNA prepared. Approximately 5 ug of the library plasmid DNA was used for the normal-ization process.
patterns of the inserts from the BOTL library before and following normalization were indis-tinguishable, indicating that there were no sig-nificant changes in size distribution of inserts after normalization (Fig. 1 panels A and B). In this analysis, 16 out of the 18 analyzed clones contained inserts with sizes, ranging from 0.2 to 3 kb (Fig. 1, Panel B). This range of insert sizes appears similar to the range of insert sizes isolated from clones of the original library (Fig. 1, Compare Panels A and B).
The effectiveness of library normalization was evaluated by DNA sequence analysis of >100 clones randomly picked from the original and normalized libraries. Of 101 cDNA sequences from the original library, 27 were found to re-present abundantly expressed genes; 21 of 27 were ribosomal protein genes, while the re-maining 6 included genes encoding GAPDH, elongation factor 1, histone H3.3, and
beta-globin. In contrast, none of 127 cDNA clones picked and sequenced from the normalized li-brary represented abundantly expressed genes. This indicates that the normalization procedure significantly reduced the frequencies of clones representing abundant cDNAs in the normal-ized library. Furthermore, 74.3% (75/101) of the cDNA clones from the original library had matches with the known genes in the GenBank database (Cutoff E value=10-15), while only 61.4% (78/127) of cDNA clones from the nor-malized library matched known genes. This suggests that there may be a higher probability of identifying unknown cDNA species in the normalized library.
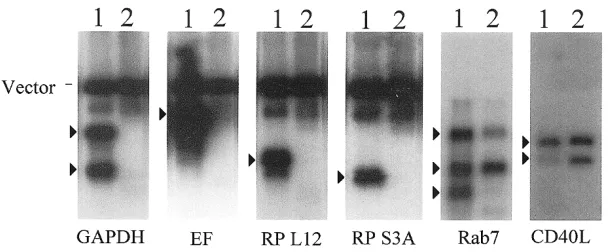
brary DNA was digested with Sal I and Not I, releasing the inserts. Inserts and vector were separated by electrophoresis, transferred to ny-lon membranes, and hybridized as described in “Materials and methods”. As shown in Fig. 2, the relative frequencies of inserts representing the 4 highly-abundant cDNAs, GAPDH, elon-gation factor 1, ribosomal protein L12, and ri-bosomal protein S3A, were dramatically de-creased in the normalized library as compared to the original library. The relative frequency of inserts representing Rab7, a moderately-abun-dant mRNA, was also decreased, but to a lower extent than the high-abundance transcript clones. In contrast, the relative frequency of clone inserts representing CD40L, a rare tran-script, was increased in the normalized library as compared to the original library. These data suggest that the normalization process success-fully reduced the relative number of clones re-presenting highly-abundant cDNA species, but enhanced the relative number of clones repre-senting rare transcripts. Once the effectiveness of normalization was established, the final cDNA library was plated and individual colonies isolated by robotic picking into 96-well plates. Approximately 1200 colonies were analyzed by single-pass sequencing to generate
a collection of expressed sequence tagged (EST) clones.
Analysis of the ESTs
housed in the public Genbank dbEST. This in-formation can be used to identify other clones representing the same transcript and to assem-ble longer sequences by aligning overlapping EST sequence files. Clones that fail to show significant similarity to previously identified ESTs may represent unique transcripts that have not been previously isolated or character-ized and may add significant new information to the growing body of identified bovine gene transcripts. Comparison of our EST clone se-quences using the BLASTN algorithm against a subset of the Genbank dbEST database con-taining over 170 000 bovine EST sequences re-vealed that 761 (81.65%) of our EST clone se-quences matched previously identified ESTs (E-Value > 10-15). Importantly, 171 (18.35%) of our EST clone sequences did not match any previously identified bovine ESTs (E-Value <10-15), indicating the possibility of their spe-cific expression in bovine total leukocytes. One caveat to this is that many of the bovine EST se-quences in the public databases were derived through 5’ end sequencing and ours were de-rived by 3’ end sequencing. Thus, 2 opposing ESTs corresponding to the same gene that do not overlap would fail to show any homology. For many organisms, The Institute for Genome Research (TIGR) maintains a database of EST sequences that have been aligned based on sim-ilarity and overlap. Each group of EST se-quences is referred to as a cluster and it is usu-ally assumed that each cluster represents a unique transcript expressed in that particular organism. The recent addition of information on clones in our database matching clusters within the TIGR bovine gene index (bTGI) in-creases access to information on clones, links to clones within public bovine EST resources rep-resenting similar sequences, and allows access to greater sequence lengths through BLAST analysis of an entire cluster sequence. Of the 932 clones currently represented within our
database, 634 show significant similarity to TIGR bTGI cluster sequences. This suggests that of the 932 clones in our current database, 298 represent novel bovine transcripts that have not previously been isolated or characterized. To date, we have not compared our sequences to singletons within the bTGI to determine if the remaining clones match or overlap any of these sequences, thus creating new clusters.
Use of BOTL microarrays to study bovine immunobiology
ma-trix metalloproteinases and receptors were also produced and added to the microarray source plates.
We chose Con A stimulation of mixed PBMCs as a well-characterized model of immune cell activation to assess the ability of our BOTL mi-croarrays to detect an immune response. Con A stimulated PBMC are well known for their strong proliferative capacity and production of various cytokines (Mastro & Sniezek 1983,
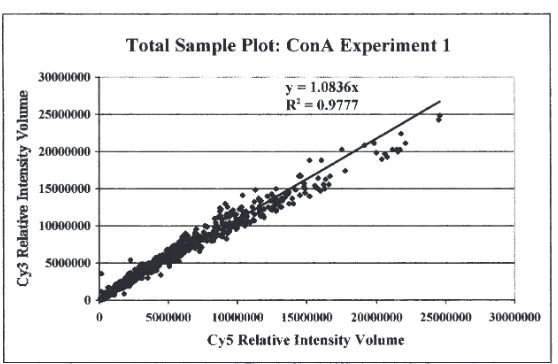
Okragly et al.1995, Sentsui et al.1992, Whist et al.2000). Since it was important to deter-mine the background or “noise” associated with our microarrays, we first performed a con-trol experiment (Con A Experiment 1) where the source RNAs for differential dye labeling were derived from the same sample of Con A stimulated PBMCs. Since there should be no differences in the cDNA produced from this ex-periment, we would anticipate microarray anal-ysis to yield equal fluorescence intensities for both the Cy3 and Cy5 labels at every spot on the microarray. To accomplish this test experiment, PBMCs from 3 healthy mid-lactation Holstein
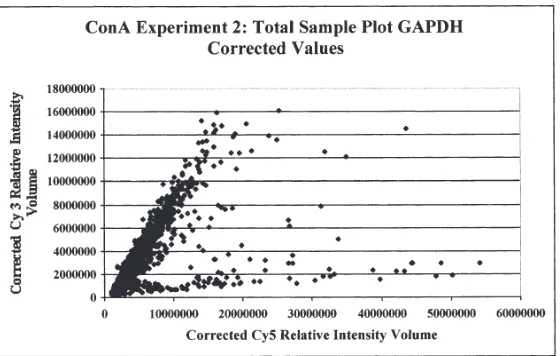
vation in response to Con A stimulation. To ac-complish this, we performed an experiment (Con A Experiment 2) in which mixed PBMCs were isolated, separated into 2 equal aliquots, and each aliquot separately stimulated with PBS or Con A. Corrected relative fluorescence intensity data was plotted (Fig. 4) for every spot on the microarray in a manner similar to Con A Experiment 1. The resulting plot indicates that, as expected a number of PBMC genes were strongly activated (Cy5>Cy3) by Con A stimu-lation. Subsequent analysis of the microarray data indicated that expression of more than 90 genes was activated >3-fold in response to Con A, with expression of many genes (~25) acti-vated >5-fold, relative to unstimulated cells. These data demonstrate that our BOTL mi-croarrays are readily able to detect enhanced gene expression in response to a general mito-gen.
Because there have been many questions raised with regard to reproducibility of cDNA mi-croarray data and slide-to-slide variation, it was important to determine if a duplicate
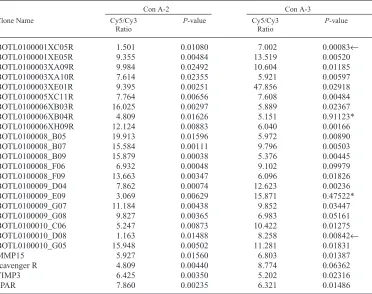
experi-ment would yield results similar to Con A Ex-periment 2. Thus, a third exEx-periment was per-formed to assess the reproducibility of our BOTL microarrays (Con A Experiment 3). In this experiment, differential labeling of cDNA, microarray hybridization, washing and scan-ning were all performed exactly as in Con A Experiment 2. When the results of this experi-ment were compared to those of Experiexperi-ment 2, the overall correlation between the 2 experi-ments was 0.72 and was highly significant (P<0.001). Table 1 lists 25 clones from Con A Experiment 3 whose relative expression ratio (Cy5/Cy3) demonstrated 5-fold or greater acti-vation in response to Con A. Also listed in Table 1 are the expression ratios for these same clones obtained in Con A Experiment 2 and
not showing significant activation in Con A Ex-periment 2 (dark arrows, Table 1) showed either no (BOTL0100010_D08) or only a slight (BOTL0100001XC05R) activation. In no case did we observe an opposite trend between the 2 experiments, that is a gene activated in one ex-periment but depressed in the other. Thus, the greatest variation in results between Con A Ex-periments 2 and 3 was not in which genes were
activated by Con A stimulation, but in the abso-lute degree of activation.
Discussion
Application of cDNA microarray technology to complex problems in animal and veterinary sci-ence will require development of high-quality integrated resources dedicated to particular species and perhaps to specific systems within Ta bl e 1 : Comparison of Expression Ratios for Selected Clones Between Con A Experiments 2 and 3.
Con A-2 Con A-3
Clone Name Cy5/Cy3 P-value Cy5/Cy3 P-value
Ratio Ratio
BOTL0100001XC05R 1.501 0.01080 7.002 0.00083←
BOTL0100001XE05R 9.355 0.00484 13.519 0.00520
BOTL0100003XA09R 9.984 0.02492 10.604 0.01185
BOTL0100003XA10R 7.614 0.02355 5.921 0.00597
BOTL0100003XE01R 9.395 0.00251 47.856 0.02918
BOTL0100005XC11R 7.764 0.00656 7.608 0.00484
BOTL0100006XB03R 16.025 0.00297 5.889 0.02367
BOTL0100006XB04R 4.809 0.01626 5.151 0.91123*
BOTL0100006XH09R 12.124 0.00883 6.040 0.00166
BOTL0100008_B05 19.913 0.01596 5.972 0.00890
BOTL0100008_B07 15.584 0.00111 9.796 0.00503
BOTL0100008_B09 15.879 0.00038 5.376 0.00445
BOTL0100008_F06 6.932 0.00048 9.102 0.09979
BOTL0100008_F09 13.663 0.00347 6.096 0.01826
BOTL0100009_D04 7.862 0.00074 12.623 0.00236
BOTL0100009_E09 3.069 0.00629 15.871 0.47522*
BOTL0100009_G07 11.184 0.00438 9.852 0.03447
BOTL0100009_G08 9.827 0.00365 6.983 0.05161
BOTL0100010_C06 5.247 0.00873 10.422 0.01275
BOTL0100010_D08 1.163 0.01488 8.258 0.00842←
BOTL0100010_G05 15.948 0.00502 11.281 0.01831
MMP15 5.927 0.01560 6.803 0.01387
scavenger R 4.809 0.00440 8.774 0.06362
TIMP3 6.425 0.00350 5.202 0.02316
uPAR 7.860 0.00235 6.321 0.01486
species. The required resources include: 1) high-quality normalized cDNA libraries from the tissues of interest; 2) collections of ESTs or random clones representing transcripts ex-pressed in the system of interest; 3) databases to track EST clone information and assist in inter-pretation of microarray data; 4) microarray de-signs that allow production of robust and repro-ducible data. In this manuscript, we have described development of such resources for study of bovine immunobiology.
Development of high quality cDNA libraries is an essential step towards the generation of ESTs for cDNA microarray experiments. Li-brary normalization is of particular importance as the use of normalized libraries significantly increases the efficiency of EST generation (Soares1994, Hiller et al.1996). The BOTL li-brary reported here is of high quality and will allow us to generate many unique ESTs for gene expression studies of bovine immunobiol-ogy using cDNA microarray technolimmunobiol-ogy. Initial analysis of ESTs generated from the BOTL li-brary indicate that many of the clones already processed (171) are not yet represented in the public databases (dbEST) and may therefore represent genes transcribed preferentially in bovine blood leukocytes.
EST data from our libraries is stored in a cus-tom designed web-accessible database that re-trieves and displays the top BLAST results for each clone compared against sequences in the Genbank non-redundant database. Additional information, including clone sequence data and the TIGR cluster (TC) number are also dis-played. Links to these public databases allows rapid retrieval of additional information on se-quences matching particular clones. The data-base is searchable with regards to clone name, keywords derived from BLAST hits, and by di-rect BLAST searching within the database. The entire library contents as well as the results of any searches may be exported in a comma
sep-arated values (CSV) file that is compatible with most spreadsheet and database systems. These features are of primary importance when ana-lyzing results of cDNA microarray experi-ments, since one can easily move from a list of clone names to a tentative identification of the transcript represented by each clone. Public ac-cess to the database ensures timely dissemina-tion of data as well as providing a ready analy-sis tool for collaborators at distant sites. Initial construction of cDNA microarrays with amplicons from a subset (720 out of 932) of BOTL EST clones was performed in a manner that accommodated triple spotting of each am-plicon and incorporation of numerous controls. This design and subsequent analysis of the mi-croarray data are rigorous, as only 3 amplicons showed false positive results in a control exper-iment (0.4%, Con A Experexper-iment 1). These re-sults suggest we can be confident that most dif-ferentially expressed genes highlighted in an experiment using the BOTL microarrays are, in fact, differentially expressed. The triple spot-ting pattern also allows statistical analysis of the data for each amplicon within a microarray (Table 1 and Burton et al.2001, this issue). This is a particularly important consideration since the standard errors associated with any one am-plicon can vary widely.
We assessed the ability of our BOTL microar-rays to detect the response of mixed PBMCs to a general mitogenic agent, Con A. Comparison of gene expression patterns for mixed PBMCs stimulated with Con A versus PBS alone re-vealed a dramatic upregulation of gene expres-sion. In total, over 90 genes displayed enhanced expression in the Con A treated PBMCs rela-tive to unstimulated PBMCs from the same an-imals. A separate experiment (Con A Experi-ment 3) comparing Con A versus PBS stimulation with PBMCs from a different group of animals was highly correlated (r = 0.72,
ex-periment. Of 25 clones selected from Con A Experiment 3 on the basis of expression ratios (Cy5/Cy3) equal to or greater than 5-fold, 23 showed similar activation patterns in Con A Ex-periment 2. We attribute this high level of re-producibility to the microarray design, which includes triple spotting of all amplicons as well as numerous positive and negative controls. In summary, we have described development of integrated resources that allow application of cDNA microarray technology to functional ge-nomics studies of bovine immunobiology. Mi-croarrays resulting from this work continue to be improved by addition of amplicons repre-senting known genes involved in immunologi-cal responses as well as more ESTs from the BOTL library. We believe these resources will assist us and collaborators in advancing the sta-tus of bovine immunobiology, allowing appli-cation to a wide variety of production and in-fectious diseases.
Acknowledgements
The authors wish to acknowledge the excellent tech-nical assistance of Dr. Patty Weber and Mr. Chris Colvin of the Immunogenetics and Molecular Patho-genesis Laboratories, respectively, at Michigan State University. We further acknowledge the laboratory contributions of Mr. William Nobis and Mr. Matthew J. Coussens. Dr. George Smith is acknowledged for kindly providing amplicons representing bovine ma-trix metalloproteinases and several cell-surface re-ceptors for inclusion on the BOTL microarrays. This work was supported through funds provided by the Michigan Agriculture Experiment Station, the Michigan State University Office of the Vice Presi-dent for Research and Graduate Studies, the Re-search Excellence Fund State of Michigan, and the Department of Animal Science at Michigan State University.
References
Barrans JD, Stamatiou D, Liew C:Construction of a human cardiovascular cDNA microarray: portrait of the failing heart. Biochem. Biophys. Res. Commun. 2001, 280,964-9.
Blecha F:Immunomodulation: a means of disease
prevention in stressed livestock. J. Anim. Sci. 1988, 66,2084-90.
Bonaldo MF, Lennon G, Soares MB:Normalization and subtraction: two approaches to facilitate gene discovery, Genome Res. 1996, 6,791-806. Bowtell DD:Options available – from start to finish
– for obtaining expression data by microarray. Nat. Genet. 1999, 21,25-32.
Bull JH, Ellison G, Patel A, Muir G, Walker M, Un-derwood M, Khan F, Paskins L:Identification of potential diagnostic markers of prostate cancer and prostatic intraepithelial neoplasia using cDNA microarray. Br. J. Cancer 2001, 84, 1512-9.
Burton JL, Nonnecke BJ, Dubeski PL, Elsasser TH, Mallard BA:Effects of supplemental chromium on production of cytokines by mitogen- stimu-lated bovine peripheral blood mononuclear cells. J. Dairy. Sci. 79,2237-46.
Burton JL, Madsen SA, Yao J, Sipkovsky SS, Coussens PM:An immunogenomics approach to understanding periparturient immunosuppres-sion and mastitis susceptibility in dairy cows. Acta vet. scand. 2001, 42, 407-424.
Collier RJ, Beede DK, Thatcher WW, Israel LA, Wilcox CJ: Influences of environment and its modification on dairy animal health and produc-tion, J. Dairy. Sci. 65,2213-27.
Ellisen LW, Palmer RE, Maki RG. Truong VB, Tamayo P, Oliner JD, Haber DA:Cascades of transcriptional induction during human lympho-cyte activation, Eur. J. Cell Biol. 2001, 80,321-8. Galyean ML, Perino LJ, Duff GC:Interaction of cat-tle health/immunity and nutrition. J. Anim. Sci. 1999, 77,1120-34.
Geraci MW, Moore M, Gesell T, Yeager ME, Alger L, Golpon H, Gao B, Loyd JE, Tuder RM, Voelkel NF:Gene expression patterns in the lungs of pa-tients with primary pulmonary hypertension: a gene microarray analysis, Circ. Res. 2001, 88, 555-62.
Heller RA, Schena M, Chai A, Shalon D, Bedilion T, Gilmore J, Woolley DE, Davis RW:Discovery and analysis of inflammatory disease-related genes using cDNA microarrays, Proc. Natl. Acad. Sci. USA 1997, 94,2150-5.
Jin K, Mao XO, Eshoo MW, Nagayama T, Minami M, Simon RP, Greenberg DA:Microarray analysis of hippocampal gene expression in global cerebral ischemia, Ann. Neurol. 2001, 50, 93-103. Kallioniemi OP:Biochip technologies in cancer
Kennedy GC:The impact of genomics on therapeutic drug development. Exs. 2000, 89,1-10. Khan J, Bittner ML, Chen Y, Meltzer PS, Trent JM:
DNA microarray technology: the anticipated im-pact on the study of human disease. Biochim. Biophys. Acta. 1999, 1423,M17-28.
Khanna C, Khan J, Nguyen P, Prehn J, Caylor J, Yeung C, Trepel J, Meltzer P, Helman L: Metasta-sis-associated differences in gene expression in a murine model of osteosarcoma. Cancer Res. 2001, 61,3750-9.
Kurian KM, Watson CJ, Wyllie AH:DNA chip tech-nology. J. Pathol. 1999, 187,267-71.
Lewin HA:Disease resistance and immune response genes in cattle: strategies for their detection and evidence of their existence. J. Dairy. Sci. 1989, 72,1334-48.
Lewohl JM, Dodd PR, Mayfield RD, Harris RA: Ap-plication of DNA microarrays to study human al-coholism. J. Biomed. Sci. 2001, 8,28-36. Manger ID, Relman DA: How the host 'sees'
pathogens: global gene expression responses to infection. Curr. Opin. Immunol. 2000, 12,215-8. Mastro AM, Sniezek MJ:The effect of removal of ad-herent cells in lectin and allogeneic cell stimula-tion of bovine lymphocytes. Vet. Immunol. Im-munopathol. 1983, 5, 161-76.
Meltzer PS:Spotting the target: microarrays for dis-ease gene discovery. Curr. Opin. Genet. Dev. 2001, 11, 258-63.
Okragly AJ, Hanby-Flarida M, Baldwin CL:
Mono-cytes control gamma/delta T-cell responses by a secreted product. Immunology 1995, 86, 599-605.
Preisler MT, Weber PS, Tempelman RJ, Erskine RJ, Hunt H, Burton JL:Glucocorticoid receptor ex-pression profiles in mononuclear leukocytes of periparturient Holstein cows. J. Dairy. Sci. 2000, 83,38-47.
Schena M, Heller RA, Theriault TP, Konrad K, Lachenmeier E, Davis RW:Microarrays: biotech-nology's discovery platform for functional ge-nomics. Trends Biotechnol. 1998, 16,301-6. Schena M, Shalon D, Davis RW, Brown PO:
Quanti-tative monitoring of gene expression patterns with a complementary DNA microarray. Science 1995, 270,467-70.
Schena M, Shalon D, Heller R, Chai A, Brown PO, Davis R.W:Parallel human genome analysis: mi-croarray-based expression monitoring of 1000 genes. Proc. Natl. Acad. Sci. USA 1996, 93, 10614-9.
Sentsui H, Satou K, Hatakeyama H:Establishment of an IL-2-dependent bovine T cell line and an assay of lymphocyte response inhibition in leukemic bovine serum. J. Vet. Med. Sci. 1992, 54,293-6. Whist SK, Storset AK, Larsen HJ:The use of
inter-leukin-2 receptor expression as a marker of cell-mediated immunity in goats experimentally in-fected with Mycobacterium avium ssp. paratu-berculosis. Vet. Immunol. Immunopathol. 2000, 73,207-18.
(Received August 16, 2001; accepted November 28, 2001).