Ersbøll AK, Ersbøll BK: Epidemiological studies based on small sample sizes – a statisticians point of view. Acta vet. scand. 2003. Suppl. 98, 127-140.– We consider 3 basic steps in a study, which have relevance for the statistical analysis. They are: study design, data quality, and statistical analysis. While statistical analysis is often considered an important issue in the literature and the choice of statistical method receives much at-tention, less emphasis seems to be put on study design and necessary sample sizes. Fi-nally, a very important step, namely assessment and validation of the quality of the data collected seems to be completely overlooked.
Examples from veterinary epidemiological research and recommendations for each step are given together with relevant references to the literature.
small data set; design; data management; data quality; statistical analysis; sample size; power; simulation.
Epidemiological Studies Based on Small Sample Sizes
– A Statistician’s Point of View
By Annette Kjær Ersbøll1andBjarne Kjær Ersbøll2
1Department of Animal Science and Animal Health, The Royal Veterinary and Agricultural University,
Den-mark, and 2Informatics and Mathematical Modelling, The Technical University of Denmark, Denmark
Introduction
There are 3 main issues in a study: design, data quality (data management), and statistical anal-ysis (Fig. 1). In the statistical literature much emphasis is put on performing the correct tistical analysis. In contrast to this, standard sta-tistical methods are often used in the veterinary literature and much more emphasis is put on in-terpreting the outcome of the statistical analy-sis. However, in neither case is the statistical analysis able to correct the consequences of a badly designed study or deal meaningfully with data of dubious quality. The aspects of choos-ing a sensible study design and the influence of sample size are usually not reported and are not
very well represented outside purely statistical literature. In fact, in the authors' opinion sur-prisingly many statistical analyses are per-formed on data where little or no reflection at all has been made on study design and neces-sary sample size. Very often, just a few extra thoughts about a study design could have dras-tically improved the outcome of the study - in many cases at no extra cost or at a marginal ex-tra cost. Furthermore, power calculations in the design phase can help design the study effi-ciently and stop studies that only have a small chance of supporting the study hypothesis. Fi-nally, a nearly totally overlooked area is that of data quality. Even a carefully planned experi-ment can be rendered worthless if data collec-tion is not performed correctly. After data col-lection data can be checked for errors in different ways, in some cases data are expected Design Data management Analysis
to behave according to some pattern, dates are known to be ordered for instance, growth curves are (usually) expected to grow monotonously, etc. Even more importantly, data can be monitored for consistency during collection, thereby permitting changes to the collection procedure to be made so possible misunderstandings are corrected at the source. For illustrative purposes examples of small data sets are given initially. We continue by describ-ing experimental design, data quality and con-trol and finally analysis of small data sets. The paper is concluded with perspectives and rec-ommendations.
Examples
Four examples of small data sets are used for il-lustration:
Example 1: Healing of wounds in horses The aim of this hypothetical study was to eval-uate 2 different antibiotics (A and B) in combi-nation with 2 bandages (I and II) for healing of wounds in horses. Selection of study design is the main problem in this example.
Example 2: Moderate coliform mastitis The aim of the study was to evaluate avoidance of antibiotics in treatment of moderate coliform mastitis in dairy cows (Katholm & Andersen 2001). Thirteen cows were included in the study (CFU/cm2<142), 7 of these were treated with antibiotics. On day 21 the cows were eval-uated for clinical recovery (restored or not).
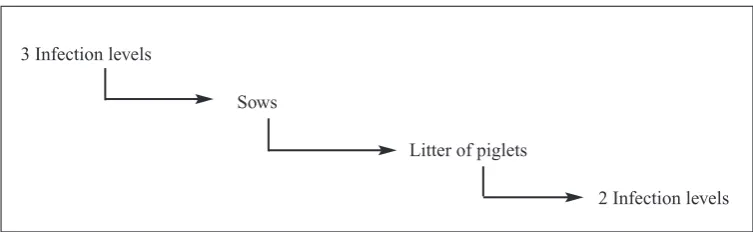
Example 3: Nematodes in sows and piglets The aim of the study was to investigate the in-fluence of multiple nematode infections on piglet's performance (Thamsborg et al.2001). Thirty-nine sows were included in the study and given one of 3 infection levels: control (12 sows), low triggered (13 sows) and high trig-gered (14 sows). Each litter was divided into 2
groups, one group in each litter was given an in-fectious dose, the other group in each litter was not. This example was included for its interest-ing design, even it is not a 'small data set'.
Example 4: Milk yield in dairy cows
How many herds and how many cows per herd should be included in the study in order to demonstrate a significant difference in milk yield for Jersey and Holstein cows? For illus-tration both the continuous outcome and a di-chotomised outcome (milk yield above or be-low 18 kg) have been used.
Study design
Design covers all the problems and considera-tions made before data collection starts. In the following aspects on design, sample size and power, compliance and randomisation will be discussed.
Design
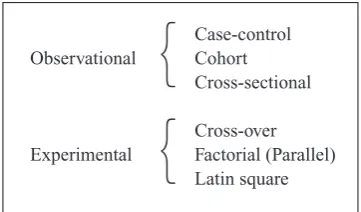
Research studies are performed using either an observational design or an experimental design (Fig. 2). Most epidemiological research is based on observational studies. Observational studies are characterised by the fact that infor-mation of subjects is collected without affect-ing them in a pre-planned manner, often with little or no control on subjects. By contrast, in
Case-control
Observational Cohort
Cross-sectional
Cross-over Experimental Factorial (Parallel)
Latin square
{
{
experimental studies the events are influenced and the effect of the interventions of subjects are investigated. Experimental studies include clinical trials (Pocock1983), field trials and lab-oratory studies. Experimental studies are usu-ally performed in order to compare the effect of different treatments on the outcome and stronger conclusions/inferences can usually be drawn compared to observational studies. Un-der experimental conditions problems with confounders can be reduced or eliminated by careful selection of subjects (e.g. same breed, gender and age). Observational studies can be either prospective (data are collected forward in time) or retrospective (data refer to past events) whereas experimental studies are always prospective.
The 3 basic designs used in observational stud-ies are cohort, case-control and cross-sectional designs, as illustrated in Fig. 3. In a cohort study, groups of subjects with different levels of the study factor (exposure) are included and in-formation on the development of the outcome e.g. of a particular disease (or condition) for a given period of time is collected prospectively. In a case-control study a number of subjects with the disease (cases) are identified along with unaffected subjects (controls). Hereby, cases and controls are selected from 2 different populations. Study factors are collected retro-spectively. In cross-sectional studies subjects are selected from the population without
know-ledge on the study factors or disease status. The current disease status and (present or past) ex-posure level are collected at the same time. Comparison of the basic designs and other de-signs used in observational studies, and a dis-cussion of advantages and disadvantages of the different designs are discussed by e.g. Klein-baum et al.(1982), Woodward(1999) and Alt-man(1991).
The simplest intervention design (experimental study) is a parallel group design, where subjects are allocated to one of 2 (or more) treatments. All subjects within a treatment group receive the same treatment. Otherwise, all subjects are treated similarly. If further study factors are to be evaluated, a factorial design can be used. In a factorial design subjects are allocated to the combinations of the factors. Two or more levels for each factor can be used. A parallel design is a one-way factorial design. A Latin square sign is a special case of a three-way factorial de-sign having the same number of levels for all 3 factors. An advantage of using a Latin square design is that the number of subjects to be in-cluded is limited. However, interactions be-tween the 3 factors cannot be estimated. An al-ternative to the parallel design is a cross-over design (Senn1993) in which each treatment is given at different times to each subject. This has the advantage of eliminating the inter-subject variability under certain assumptions, the most important being that of no carry-over effect.
Design Past Present Future
Cohort Exposure Disease
Case-control Exposure Disease
Cross-sectional Disease
In Example 1 (Healing of wounds in horses) different designs can be suggested for the hy-pothetical experimental study. However, not all designs might be appropriate from a veterinary point of view. Due to practical issues only a lim-ited number of horses can be used, that is less than 10 horses. A Latin square design can be used in which 8 horses are included in 2 groups of 4 horses. An example is given in Table 1.
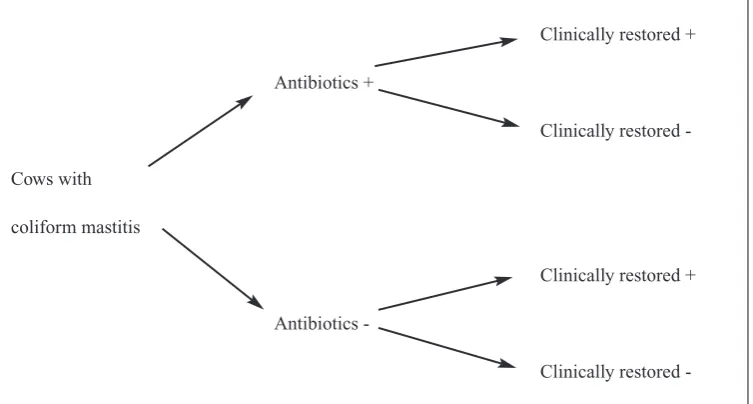
In Example 2 (Moderate coliform mastitis) 13 cows were included. The design is given in Fig. 4. The study is an observational study with a cohort design, where cows with mastitis were followed for 21 days and evaluated for clinical recovery. Antibiotic treatment is the exposure and clinical recovery after 21 days is the out-come.
In Example 3 (Nematodes in sows and piglets) 39 sows were given different infection levels of nematodes and half of the piglets in each litter were given an infection as well. The structure of the study is given in Fig. 5. The study is an ex-perimental study using a factorial design with 2 factors (one factor with 3 levels for sows, one factor with 2 levels for piglets). Note, that it is not a standard two-way factorial design since piglets are nested within sows, which again are nested within infection levels for sows. Ta bl e 1 . A Latin square design for Example 1:
Healing of wounds in horses. Horses are allocated into 4 treatment groups (A, B, C, D) that are combi-nations of 2 different antibiotics and 2 types of ban-dage.
Leg position Horse ID
I II III IV
1 Right fore leg A B D C
2 Left fore leg B C A D
3 Right hind leg D A C B
4 Left hind leg C D B A
Fi g u r e 4 . The structure of Example 2: 'Moderate coliform mastitis'. This is an observational study with a co-hort design. Antibiotics used is exposure and clinically restored is the outcome.
Clinically restored +
Antibiotics +
Clinically restored
-Cows with
coliform mastitis
Clinically restored +
Antibiotics
-Sample size and power
Sample size and power calculations are impor-tant in both experimental and observational studies. Whenever a study is being planned there is always a question of sample size, that is how many subjects should be included in order to detect a significant difference of the study factor or treatments. For simple cases, standard equations are available and can be used (e.g. Noordhuizen et al. (1997), Pocock (1983)). Such cases are e.g. comparison of two preva-lences or comparison of two means. Calcula-tion of sample size is based on assumpCalcula-tions re-garding expected treatment effects, e.g. the expected difference between two means or the expected difference between two prevalences. If no prior knowledge is available from previ-ous studies or publications, expectations or qualified guesses have to be used. Further, the significance level and power, or alternatively the width of the confidence interval, have to be decided as they are used in the sample size cal-culations as well. The pre-decided significance level is the probability that the null hypothesis is rejected, when it actually is true; Or in more common terms: the probability that a given dif-ference - if not present - would be detected. The power is the probability that the null hypothesis
is rejected when it actually is false; In more common terms: the probability that a difference - if present - would be detected. A significance level of 5% and power of 80-90% are com-monly used in the sample size calculations. An alternative to sample size calculations is calcu-lation of power for varying sample size and/or expected effects (Woodward 1999). In some cases exact equations can be used. However, power calculations can also be performed using simulation, when no standard equations are readily available. In the case of simulation the power is not found exactly but is found as an es-timate. If the number of simulations is suffi-ciently high, the exact and simulated results are very similar. As a rule of thumb 100 simula-tions will give a power estimate with 95% con-fidence limits of ±10 percentage-points, while 1000 simulations will give 95% confidence limits of ±3 percentage-points.
In many studies collection of data is repeated in time for each subject in order to evaluate the long-term effects. However, it is important to note that an increasing number of repeated measures does not increase power or efficiency of the test as an increasing number of subjects does. Analogously, in studies which have a nested structure (e.g. herds and animals within 3 Infection levels
Sows
Litter of piglets
2 Infection levels
herds, where treatment regime is given at the herd level) it is often more advantageous from a statistical point of view to include more herds and fewer animals in each herd rather than fewer herds and many animals within each herd.
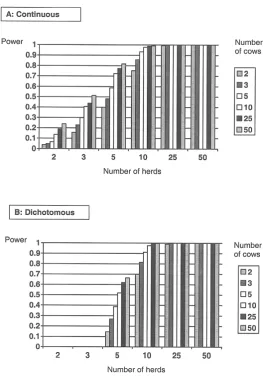
In Example 4 (Milk yield in dairy cows) it was
for a varying number of herds and a varying number of cows within herds. The calculated sample size is for each breed. A continuous out-come (milk yield) and dichotomized outout-come (milk yield >18 kg or ≤18 kg) have been used for power simulations. The SAS program used is given in the Appendices 1 and 2. Fig. 6. shows in both cases that the effect of including many herds with fewer animals is preferable to including fewer herds and many animals within each herd. For the example with 5 herds and 10 animals per herd for each breed the power is 72% for the continuous outcome and 52% for the dichotomous outcome. Changing that to 10 herds and 5 animals per herd for each breed the power rises to 93% for the continuous and 91% for the dichotomous cases, respectively. The reason for this perhaps surprising result is that the p-value for a breed (or treatment) effect de-pends heavily on the variance between herds, even though it may be smaller than the variance between animals within herds.
Compliance
For different reasons a part of the subjects in-cluded in the study might drop out before the end of the study (e.g. trading, death). These withdrawals might be a problem in relation to demonstration of significant effects, if the sig-nificance is based on a sample size, which has been reduced due to drop out. Therefore, the es-timated sample size should be increased in ac-cordance with the expected percentage of with-drawal. If for instance the sample size needed is estimated at 100 subjects, and the expected withdrawal is 20%, in total 125 subjects should be included in the study.
Randomisation
Randomisation is important (1) to prevent (or reduce) bias (systematic error) and (2) to pro-vide a basis for statistical analysis such as sig-nificance tests. In epidemiological research bias
selec-tion). Next, the 4 horses are block randomised to the combinations of the 2 remaining factors. In example 2 (Moderate coliform mastitis) sim-ple randomisation was used to allocate cows to antibiotic treatment or not. Simple randomisa-tion was also used in example 3 (Nematodes in sows and piglets) in order to allocate sows to the 3 infection levels and piglets to the 2 infection levels. Example 4 (Milk yield in dairy cows) used a two-stage sampling. Herds were ran-domly selected among all Danish dairy herds. Cows within herds were randomly selected.
Data quality
Data quality is always very important, even for a large data set. However, in most studies the importance of data management is underesti-mated. Inappropriate data quality may lead to statistical analysis based on incomplete and er-roneous data resulting in wrong conclusions. The importance of efficient data management can therefore not be stressed enough. Data management includes collection of data, organ-ising data in a database and data control (check-ing data). When construct(check-ing the database, common ways to minimize the number of typ-ing errors are by (1) entertyp-ing data twice and identify discrepancies or (2) performing a com-plete proofreading of data entered into the database. In the following data control and cor-rection of data will be discussed. Problems with clinical examinations will be discussed in rela-tion to small data sets. Data management in-cluding data control has been a very important part (time and cost) of human clinical trials (see e.g. Pocock(1983) and Altman(1991)). In vet-erinary medicine not much has been written about data management and how to perform data control. However, e.g. Rothman & Green-land(1998) give some suggestions.
Data quality is especially important when deal-ing with small studies. Identification of strange observations is nearly impossible, due to the
limited number of observations. For a large data set it is often possible to identify a strange ob-servation by evaluating the distribution of data and identify a strange observation as being out-standing from the remaining observations. However, with a small number of subjects, it is often difficult to evaluate if one observation is dubious by comparing it to the (empirical) dis-tribution of the remaining observations.
Data control
observations (e.g. scatterplots of the relation between 2 continuous variables and time pro-files for each subject).
Correction of data
Whenever a wrong or strange observation has been identified a decision has to be made re-garding data editing. Suspicious values should be checked with the original data forms (if they exist) and errors corrected. Other values might be left unchanged or coded as missing informa-tion. Elimination of subjects and/or values should in general be avoided.
Clinical examinations
Clinical examinations made by e.g. the veteri-nary practitioner are to some extent subjective and might be wrong (misclassification bias). Technically speaking, each veterinary practi-tioner might have his/her own sensitivity ity to assess true positive) and specificity (abil-ity to assess true negative). In small data sets it might have a large influence if some of the clin-ical examinations are wrong. In order to im-prove the clinical examinations, the agreement
(intra- and inter-observer variations) between e.g. two observers can be calculated. Similarly, agreement between repeated evaluations per-formed by the same observer at different times can be evaluated.
Statistical analysis
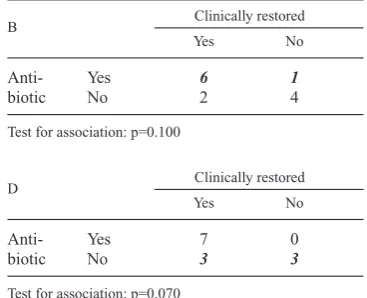
The main aim of a statistical analysis is to use the information from a (random) sample of sub-jects to make inferences about the relevant pop-ulation. Most analyses will include hypothesis testing and estimation of the effect of the study factors (e.g. treatments). Having a large data set often implies robust analyses and results, mean-ing that we can obtain the same results in dif-ferent analyses. In case of a small data set even small changes in the analysis and/or changes in the data set might inflate the results. Testing the effect of a study factor (e.g. two treatments) is done by comparison of the difference between the treatments relative to the standard error of the difference. Sample size and standard error are inversely related implying a large standard error when sample size is small. A small study may therefore fail to detect a (significant) dif-Ta bl e 2 . The influence of data quality on the association between antibiotics used and clinically restored on day 21 in Example 2: Moderate coliform mastitis. One of the clinical evaluations has been changed and the influence on the significance level (p-value) is given. Table A is the original data, tables B-D are modifications. Figures in boldface and italic are clinical examinations that have been changed.
A Clinically restored
Yes No
Anti- Yes 7 0
biotic No 2 4
Test for association : p=0.020.
B Clinically restored
Yes No
Anti- Yes 6 1
biotic No 2 4
Test for association: p=0.100
C Clinically restored
Yes No
Anti- Yes 7 0
biotic No 1 5
Test for association: p=0.005
D Clinically restored
Yes No
Anti- Yes 7 0
biotic No 3 3
ference that is really present. With a decreasing sample size we will usually see an increasing p-value towards non-significance. In the fol-lowing the choice of method, improvement of analysis and non-parametric tests will be dis-cussed.
The importance of quality of data is illustrated by Example 2: Moderate coliform Mastitis (Table 2). The association between using an-tibiotics and being clinically restored on day 21 was significant (p=0.02 using Fisher's exact test). If just one of the clinical evaluations is changed from restored to not restored or visa versa, the association might not be significant any longer. In 2 of 3 cases where one evaluation is changed, a non-significant association is seen.
Choice of method
The choice of method depends on the type of outcome (also called the response variable). A dichotomous outcome is a qualitative variable with only two levels such as diseased yes/no. A continuous outcome is a variable, which can take all possible values such as weight gain and milk yield. However, the continuous outcome often has a lower and/or upper bound (e.g. milk yield cannot be negative). In case of a dichoto-mous outcome the relevant analyses include χ2 -test, Fisher's exact -test, McNemar's test and lo-gistic regression. The relevant analyses with a continuous outcome include the t-test (for paired and un-paired observations), analysis of variance and linear regression. With other types of outcomes such as ordinal or nominal vari-ables with more than two levels ordinal logistic regression, multinomial logistic regression and loglinear models can be used (e.g. Hosmer & Lemeshow2000, Agresti1990).
Improvement of analysis
Correct model specification is crucial in all analyses. The study factors and possible
con-founders should be included in the model. However, in a study with a small number of subjects, it might be impossible to include con-founders as well as study factors in the same analysis. The number of variables, which can be included in the model, depends on the number of subjects. Depending on the number of levels for each factor, 2-3 study factors can be evalu-ated with e.g. 20 subjects. Confounding might be difficult to deal with having small data sets. Possible confounders are often evaluated by in-cluding these variables in the analysis or by per-forming analyses stratified by these variables. However, having fewer subjects it might be im-possible to include confounders due to limited degrees of freedom. Repeated measures are of-ten recorded in order to evaluate long term ef-fects. However, many repeated measures can generally not compensate for a limited number of subjects.
Logistic regression analysis of a dichotomous outcome can be improved using exact logistic regression (LogXact).
In a study including herds and subjects within herds it can be impossible to include herds as a random effect if the number of subjects is lim-ited.
vali-date the results. Ideally, this is done using the original subjects for estimation of the model. Validation is then performed using new sub-jects, by estimation of the outcome for the new subjects using the developed resulting model. Differences between the estimated and ob-served outcome for the new subjects indicate the performance of the resulting model. How-ever, it is often not feasible to collect validation data and the original data must be used for the whole validation process. With a large data set, this will normally be done by dividing data into 2 subsets, one subset is used for developing and estimating the model (learning subset), the other subset is used to validate the model (test subset). The difference between the observed and predicted values for the test subset is calcu-lated and is used as an indicator of model qual-ity. The learning subset often comprises 1/2 or 2/3 of the complete data set depending on num-ber of observations in the complete data set. For a small data set, this is often not possible, as the number of observations in the learning subset may be too small to estimate the model. Instead, validation can be performed using cross-valida-tion (Weisberg 1985). Here, one of the most commonly used methods is the so-called leave-one-out technique.
Simulation and bootstrapping are further meth-ods that can be used in order to understand, im-prove, and validate the models.
Non-parametric methods
Non-parametric methods are also called distri-bution-free tests and rank methods. For the sim-plest parametric tests there are corresponding non-parametric tests e.g. Mann-Whitney's test and Wilcoxon's test correspond to t-test for un-paired observations, Wilcoxon's signed rank test corresponds to t-test for paired observa-tions, Kruskall Wallis's test and Friedman's test correspond to one-way and two-way analysis of variance, respectively. A non-parametric test is
a test where no assumptions regarding the out-come have to be fulfilled. However, there are still assumptions which must be fulfilled (Conover1980). In general, the non-parametric tests are not as informative as parametric meth-ods because the non-parametric methmeth-ods use ranks instead of original values. The non-para-metric methods are therefore mainly used for testing hypotheses and not for estimation. If the assumptions for performing a parametric test are satisfied, the non-parametric tests are not as efficient as the parametric. The relative efficiency between 2 similar tests can be calcu-lated as the sample size needed using one test compared to the sample size needed for the sec-ond test under similar csec-onditions (Conover 1980). The relative efficiency of non-paramet-ric tests compared to the corresponding para-metric test is often small. Therefore, if the as-sumptions for performing a parametric test are fulfilled, it is easier to detect significant effects using the parametric test compared to the rele-vant non-parametric methods. Furthermore, parametric methods offer a much richer class of models than non-parametric methods.
Acknowledgements
The authors would like to thank SM Thamsborg and PH Andersen from The Royal Veterinary and Agri-cultural University, Denmark and J Katholm, Vivild, Denmark for providing us with examples of small data sets. We would also like to thank an anonymous reviewer for numerous comments which helped clar-ify the paper.
References
Agresti A:Categorical data analysis. John Wiley & Sons, New York 1990.
Altman DG:Practical statistics for medical research. Chapman & Hall, London 1991.
Conover WJ: Practical non-parametric statistics, 2.ed. John Wiley & Sons, New York 1980. Hosmer DW, Lemeshow S:Applied logistic
be avoided? In: Proceedings from The 11th Inter-national Conference on Production Diseases in Farm Animals, 2001, 12-16 August, Frederiks-berg, Denmark. Acta vet. scand. 2003, Suppl. 98. Kleinbaum DG, Kupper LL, Morgenstern H:
Epi-demiologic research. Van Nostrand Reinhold, New York 1982.
Noordhuizen JPTM, Frankena K, van der Hoofd CM, Graat EAM:Application of quantitative methods in veterinary epidemiology. Wageningen Press, Wageningen 1997.
Pocock SJ:Clinical trials. A practical approach. John Wiley & Sons, New York 1983.
Senn S:Cross-over trials in clinical research. John Wiley & Sons, New York 1993.
Thamsborg SM, Mejer H, Roepstorff A, Ersbøll AK, Eriksen L:Effects of nematodes on health and productivity of outdoor sows and suckling piglets. In: Proceedings from the 18th Interna-tional Conference of the WAAVP, p53, 2001. Held in Stresa, Italy.
Weisberg S:Applied linear regression. Wiley & Sons, New York 1985.
Woodward M:Epidemiology. Study design and data analysis. Chapman & Hall/CRC, London 1999. Rothman KJ, Greenland S:Modern Epidemiology.
Lippincott - Raven Publishers, Philadelphia 1998.
Sammendrag
Epidemiologiske studier baseret på små datasæt - en statistikers synspunkt.
Vi betragter tre vigtige trin i et studie, som har rele-vans for den statistiske analyse. De er: design af studiet, data kvalitet og statistisk analyse. Mens statistisk analyse ofte bliver betragtet som et vigtigt element i litteraturen og valget af statistisk metode får megen opmærksomhed, så synes der at blive lagt mindre vægt på design af studiet og nødvendig stikprøvestørrelse. Endelig bliver et meget vigtigt el-ement, nemlig undersøgelse og validering af de ind-samlede data's kvalitet, oftest overset.
Eksempler fra veterinær epidemiologi og anbe-falinger for hvert af trinnene bliver givet sammen med relevante referencer til litteraturen.
Peer reviewed contribution to 11. International Conference on Production Diseases in Farm Animals, 12-16 Au-gust 2001, The Royal Veterinary and Agricultural University, Frederiksberg, Denmark.
Reprints may be obtained from: Annette Kjær Ersbøll, Department of Animal Science and Animal Health, The Royal Veterinary and Agricultural University, Grønnegårdsvej 8, DK-1870 Frederiksberg C