R E S E A R C H
Open Access
Identification and screening of
nitrogen-efficient cotton genotypes under low and
normal nitrogen environments at the
seedling stage
ZHANG Hengheng
†, FU Xiaoqiong
†, WANG Xiangru, GUI Huiping, DONG Qiang, PANG Nianchang, WANG Zhun,
ZHANG Xiling
*and SONG Meizhen
*Abstract
Background:Large quantities of nitrogen (N) fertilizer applied to cotton cropping systems support high yields but cause adverse environmental impacts such as N2O emission and water eutrophication. The development of cotton cultivars with higher N use efficiencies suitable for low-N conditions is therefore important for sustainable
production. In this study, we evaluated 100 cotton genotypes in 2016 for N use efficiency and related traits at the seedling stage.
Methods:Sand culture experiment was conducted with low N levels (0.01 g·kg−1) or normal N levels (0.1 g·kg−1). We investigated plant height, SPAD value (soil plant analysis development chlorophyll meter), dry weight, N accumulation, N utilization efficiency, and N uptake efficiency. Through descriptive statistics, principal component analysis and heatmap clustering analysis, we confirmed the evaluation index system of N-efficient genotypes and the classification of N-efficient genotypes.
Results:Significant differences were observed among N levels and genotypes for all agronomic traits and N levels. Coefficients of variation varied greatly and ranged from 6.7~28.8 and 7.4~20.8 under low-N and normal-N
treatment, respectively. All traits showed highly significant positive correlations with each other, except SPAD value. The principal components under both N levels were similar, showing that total dry weight, aboveground dry weight, total N accumulation, and N uptake efficiency were important components. We confirmed these four traits as suitable screening indexes for low N tolerance. Based on the results of heatmap clustering and scatter diagram analysis of N efficiency value, 10 genotypes were found low-N tolerant, in which five varieties were inefficient under both low and normal N conditions, while four varieties were found efficient under low-N conditions but inefficient under normal-N conditions. Only one variety was efficient under both low and normal-N conditions. Meanwhile, 20 genotypes were identified as low-N sensitive ones, in which 19 genotypes were inefficient under low-N conditions but efficient under normal-N conditions, one variety was inefficient under both low and normal-N conditions.
Conclusion:We preliminarily identified Kashi as a N tolerant and N-efficient cotton genotype, and CCRI 64 as a low-N sensitive and low-N-inefficient cotton genotype. Further studies should be carried out to verify the yield and heritability effect of specific genotypes in the field.
Keywords:Cotton, Genotype, Nitrogen efficiency, Screening
* Correspondence:[email protected];[email protected]
†Zhang HH and Fu XQ contributed equally to this work.
State Key Laboratory of Cotton Biology, Institute of Cotton Research of Chinese Academy of Agricultural Sciences, Anyang 455000, China
Background
Nitrogen (N) fertilizer is an essential input in agricultural production. N fertilizer applications have previously pro-vided an important guarantee for increasing food produc-tion and reducing the pressure of global populaproduc-tion growth. Indeed, large production and consumption of N fertilizer (amount to 30% of worldwide levels) in China have made a significant contribution to Chinese agricul-tural development (Zhang et al.2013). However, excess N fertilizer applications for crop production exert adverse environmental impacts, resulting in higher N2O emissions and the eutrophication of freshwater and marine ecosys-tems (Sieling and Kage2008; Qiao et al. 2012). Without high N use efficiency (NUE), reduced N fertilizer input may decrease crop yields and quality if plants experience N-starvation stress (Cassman et al. 2003; Khan et al. 2017). Therefore, it is increasingly important to develop cultivars that are more efficient at utilizing N and better suited to N limitations. Indeed, it is the optimal N management strategy to achieve sustainable agricultural development by the use of N-efficient genotypes and the optimization of N fertilization.
Increased interest has developed worldwide in improv-ing NUE and exploitimprov-ing the genetic potential of crops such as rice (Peng et al. 2006; Cheng et al.2011), wheat (Gaju et al. 2011; Zhang et al. 2015; Hitz et al. 2017), maize (Gallais and Hirel2004), and rapeseed (Behrens et al. 2011; Bouchet et al. 2016). Although plant breeders sometimes select genotypes in high-N environments to exploit maximum genetic potentials, the selected geno-types may not perform well in N-limiting conditions. Therefore, to improve crop yield under N-deficient condi-tions, it may be necessary to apply direct selection under low-N conditions (Presterl et al. 2003; Brancourt-Hulmel et al. 2005). The selection and development of cultivars suitable for both low-N and high-N conditions may also allow breeders to identify N-efficient genotypes (Anbessa et al.2010; Hitz et al.2017).
Numerous studies have reported dramatic genetic vari-ation in N uptake, storage, translocvari-ation, and assimilvari-ation (Robinson et al.2007; Gaju et al. 2011; Hitz et al.2017). Efficient genotypes have specific physiological mecha-nisms enabling them to access sufficient N quantities (up-take efficiency) and/or to more effectively utilize their N uptake (utilization efficiency) (Sattelmacher et al. 1994). Genotypes with superior N uptake, storage, and transloca-tion capabilities will allow for further gains in NUE and yield (Berry et al.2010; Gouis et al.2010). However, it is critical to identify those “must have” traits to accurately select N-efficient genotypes under low-N and high-N con-ditions (Brancourt-Hulmel et al.2005).
Wang et al. (2011) studied 12 winter wheat genotypes in low-N and high-N plots over 2 years. Using dry matter, N concentration, harvest index, nitrogen uptake efficiency
(NUpE), nitrogen utilization efficiency (NUtE), and NUE as screening indexes, they identified significant genetic variation in all traits and screened out two N-efficient wheat genotypes. Moreover, Zhang et al. (2015) reported large differences in biomass, yield, and NUE for 14 wheat cultivars which reflected root morphological traits and N assimilation enzymatic activities. Although many studies have investigated N-efficient genotypes, no systematic screening index has been established. One issue that has hindered the implementation of selection for N-efficient genotypes is the high cost both in time and resources of measuring certain traits. However, it has been suggested that rapid and efficient selection of N-efficient genotypes may be possible through sand culture at the seedling stage (Tian et al.2008).
China is one of the leading cotton producers and con-sumers in the world, and has three major cotton produc-tion regions. The northwest inland cotton region possesses ample light and heat resources and has become the domin-ant cotton-growing region in terms of unit yield, total production, and plant acreage (Feng et al.2017). However, the enhanced cotton productivity is currently challenged by labor shortages, rising labor costs, and excessive fertilizer inputs. Approximately 450 kg· hm−2N is applied to cotton fields in the northwest inland cotton region (Mao 2013). Soil fertility here is low to medium with significant regional variation, and the cotton cultivars diversify frequently. Therefore, N-efficient cotton cultivars should be grown to suit the low soil fertility and to decrease the need for fertilizer input with the aim of achieving sustainable production.
High N-efficient cotton has not yet been grown in China because of the lack of perfect cultivars and the lack of traits or selection criteria. The objectives of this study were therefore: to evaluate the genotypic variation of agro-nomic and N traits under low-N and normal-N environ-ments; and to establish methods for identifying and screening high N-efficient cotton genotypes.
Methods
Experimental site and materials
The experiment was conducted in a heliogreenhouse in the experimental station of the ICR-CAAS (Institute of Cotton Research of Chinese Academy of Agricultural Sci-ences, Sanya, Hainan) (36°05′N; 114°21′E) in 2016. The temperature in the greenhouse was controlled not more than 30 °C by using water curtains and exhaust fans.
One hundred cotton varieties collected at the ICR-CAAS were selected as test materials.
Experimental design
nutrients and then air-dried. The alkali-hydrolyzable N of the sand was 1.1 mg·kg−1, the available phosphorus was 1.9 mg·kg−1, and the available potassium was 57 mg·kg−1. Each pot was filled with 12 kg of sand and the bulk density was maintained at 1.3 g·cm−3. Seeds were planted at a density of 10 plants·m−2on November 11, 2016.
Seeds were treated with low-N level (0.01 g·kg−1) or normal-N level (0.1 g·kg−1), based on related cotton N study (Li et al. 2007) and our preliminary experiment. In our preliminary experiment, we set five N applica-tion rates (0, 0.01, 0.05, 0.1 and 0.3 g·kg−1) to confirm the low-N and normal-N level. Comparing with 0 and 0.05 rates, we observed a significant difference of agro-nomic and N traits among genotypes under 0.01 rates. Plant growth was normal under 0.1 rates but inhibited under N excessive rate (0.3 g·kg−1). Then we confirmed 0.01 g·kg−1 as the low-N level and 0.1 g·kg−1 as the normal-N level. Plants in both N treatments were supplied with a Hoagland nutrient solution of 400 μmol·L−1 CaSO4, 200 μmol·L−1 K2SO4, 175 μmol·L−1 KH2PO4, 100 μmol·L−1 MgSO4, 20 μmol·L−1 Fe-EDTA, 5 μmol·L−1 KCl, 2.5 μmol·L−1 H3BO3, 0.2 μmol·L−1 CuSO4, 0.2 μmol·L−1 ZnSO4, 0.2 μmol·L−1 MnSO4, and 0.05 μmol·L−1 Na2MoO4, pH 6.1. A total concentration of 6 μmol·L−1 NaNO3 was added to seeds which were exposed to normal-N treatment, while 0.1 μmol·L−1 NaNO3 was added to those exposed to low N. CaSO4was also added to the low-N treatment to obtain the same osmolarity of the nutrient solution as the normal-N treatment. Each treatment was replicated three times. After cultivation for 30 days, the agronomic characteristics of cotton seedlings were investigated.
Measurements
Plant samples were collected to detect biomass and N concentrations, and divided into root and aboveground tissues. The biomass was obtained by oven-drying the samples at 85 °C for 48 h and then weighed. Crop sam-ples were ground and passed through a sieve (<0.25 mm) before total N analysis. The total N con-centration was analyzed using the Kjeldahl digestion procedure (Bremner and Mulvaney 1982). The chloro-phyll content in the leaves was measured by SPAD-502 using an in vivo chlorophyll meter (Japan) to determine the SPAD value.
NUE and its components (NUpE and NUtE) were cal-culated as follows: NUpE = total plant N/soil N (pre-N soil N plus fertilizer N); NUtE = dry matter weight/total plant N; NUE = (NUpE) * (NUtE) (Moll et al. 1982). NUE de-fined in this manner represents dry matter weight divided by a constant.
The coefficient of variation (CV) was calculated as follows:
CV¼SD=Mean100%
where SD is the standard deviation of a given agro-nomic trait value, and the mean is the average value; the coefficient represents the extent of variation in the agro-nomic trait among the 100 genotypes.
The N efficiency comprehensive index (NEI) indicates the N nutrition status of various genotypes under different N supplies, and was calculated by the subordinate function method (Hu et al.2007) as follows:
Uij¼XXij−Xj min j max−Xj min
where iis the cotton genotype; j is the screening index; Uijis the subordinative function value of N efficiency;Xij is the value of genotype i over indexj; andXjminandXj
max are the minimum and maximum values of index j,
respectively.
The weight was calculated by an objective weight method as follows:
Ej¼PCCj j
whereEjis the weight of indexj, andCjis the coefficient of variation of indexj.
NEI¼Xn
i¼1
UijEi
where NEI is the N efficiency comprehensive index; Uij is the subordinative function value of N efficiency; and Ejis the weight of indexj.
Statistical analysis
Data were assessed by analysis of variance and principal component analysis (PCA) using Statistical Product and Service Solutions software (version 20.0). Means of the main effects were detected using the least significant difference test. All statistical analyses were performed at a significance level ofP< 0.05. Heatmap clustering ana-lysis was calculated by Heml 1.0 - Heatmap Illustrator using euclidean squared distance metric.
Results
114.8, and 140.6% higher, respectively, in seedlings ex-posed to normal N treatment than those grown under low N level. However, root dry weights were similar under different N levels, indicating that cotton seedlings may produce more root biomass to absorb N under N deficient conditions.
The CV can be used to measure variation in agro-nomic traits among different cotton genotypes. Under N-deficient conditions, the CV ranking was RNU > ANU > TNU > plant height > ADW > RDW > TDW > NUpE > NUtE > SPAD, showing that these indicators are sensitive to genotypic differences. A similar pattern was observed under normal N conditions. These prelim-inary results suggest that plant height, ADW, RDW, TDW, ANU, RNU, TNU, NUpE, and NUtE can be used as low-N tolerance screening indicators.
Significant differences (P< 0.01) were observed among genotypes for all the agronomic traits measured (Table1). The genotype × N level interaction was also statistically significant (P< 0.05), indicating that genotypes differ
between N levels and that selection can be performed under specific soil N environments, as proposed by Al-Naggar et al. (2015).
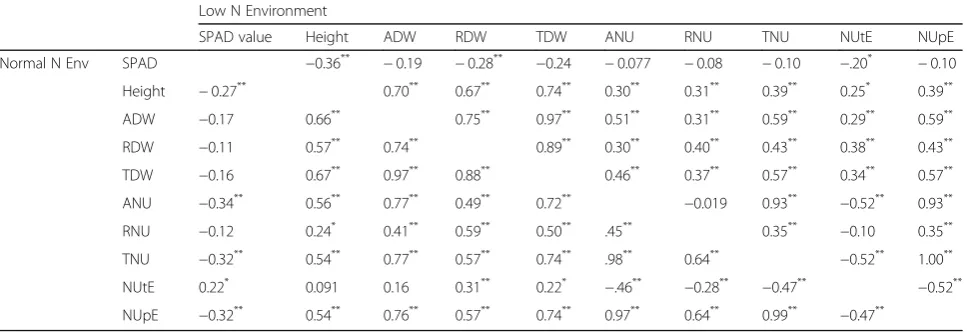
Correlations among agronomic traits are shown in Table2which indicated no significant difference in the N regime. Screening indicators exhibited significant correla-tions with each other under both low-N and normal-N conditions, except for the SPAD value. Under low-N conditions, SPAD value was strongly correlated with plant height and dry weight parameters, and showed negative correlations with N accumulation. However, the opposite trend was observed under normal-N conditions. These significant correlations imply that the agronomic and N traits can be used as low-N tolerance screening indexes.
PCA of cotton agronomic traits under low-N and normal-N regimes
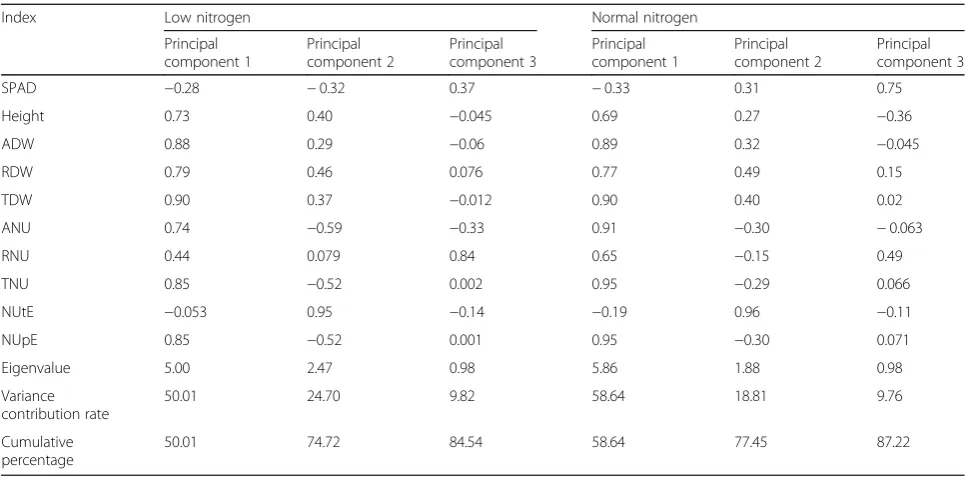
The 10 screening indexes under different N conditions were analyzed by PCA as shown in Table3. Three principal components were confirmed under low-N and normal-N Table 1Agronomic and N traits of 100 cotton genotypes grown in low and normal N environments
N level Height /cm SPAD value ADW /g RDW /g TDW/g ANU /mg RNU /mg TNU /mg NUtE /(g DW.g−1 plant N)
NUpE /(g plant N.g−1 soil N)
Low N Range 6.63~ 17.83 29.7~ 41.88 1.09~ 3.14 0.73~ 1.79 1.83~ 4.73 13.10~ 63.80 4.52~ 21.79 18.07~ 68.32 48.76~ 165.98 0.45~ 1.71
Mean 12.53 33.73 2.23 1.36 3.6 28.88 8.8 37.68 97.14 0.94
CV 18.06 6.7 16.85 15.94 15.5 22.84 28.76 18.6 13.62 18.45
Normal N Range 10.02~ 25.67 26.98~ 41.45 1.8~ 4.68 0.89~ 2.08 2.69~ 6.40 36.60~ 102.77 10.04~ 30.2 46.64~ 127.29 37.24~ 69.48 0.12~ 0.32
Mean 17.72 36.62 2.8 1.42 4.22 71.76 18.93 90.7 47.01 0.23
CV 17.57 7.44 17.64 17.63 16.6 19.14 20.82 17.55 13.22 17.55
N level ** ** ** ** ** ** ** ** ** **
Genotype ** ** ** ** ** ** ** ** ** **
G*N ** ** ** ** ** ** ** ** ** **
* and ** indicate significant difference atP< 0.05 andP< 0.01 level respectively, the same below;ADWaboveground dry weight,RDWroot dry weight,
TDWtotal dry weight,ANUaboveground nitrogen uptake,RNUroot nitrogen uptake,TNUtotal nitrogen uptake,NUtEnitrogen utilization efficiency,NUpE nitrogen uptake efficiency
Table 2Correlations among agronomic traits and N efficiency in varieties grown low and normal N environment Low N Environment
SPAD value Height ADW RDW TDW ANU RNU TNU NUtE NUpE
Normal N Env SPAD −0.36** −0.19 −0.28** −0.24 −0.077 −0.08 −0.10 −.20* −0.10
Height −0.27** 0.70** 0.67** 0.74** 0.30** 0.31** 0.39** 0.25* 0.39**
ADW −0.17 0.66** 0.75** 0.97** 0.51** 0.31** 0.59** 0.29** 0.59**
RDW −0.11 0.57** 0.74** 0.89** 0.30** 0.40** 0.43** 0.38** 0.43**
TDW −0.16 0.67** 0.97** 0.88** 0.46** 0.37** 0.57** 0.34** 0.57**
ANU −0.34** 0.56** 0.77** 0.49** 0.72** −0.019 0.93** −0.52** 0.93**
RNU −0.12 0.24* 0.41** 0.59** 0.50** .45** 0.35** −0.10 0.35**
TNU −0.32** 0.54** 0.77** 0.57** 0.74** .98** 0.64** −0.52** 1.00**
NUtE 0.22* 0.091 0.16 0.31** 0.22* −.46** −0.28** −0.47** −0.52**
NUpE −0.32** 0.54** 0.76** 0.57** 0.74** 0.97** 0.64** 0.99** −0.47**
conditions, which gave cumulative percentages of 84.54 and 87.22%, respectively. Under low-N conditions, the vari-ance contribution rates of the three principal components were 50.1, 24.7, and 9.82%, respectively. The first principal component was determined by TDW, ADW, TNU, NUpE, and RDW, which reflect plant biomass, N accumulation, and NUE. This suggests that plants produce more photo-synthates to meet growth needs under N stress, which is critical to the N-efficient genotype. Under normal-N condi-tions, the first principal component’s variance contribution rate rose to 58.64%, and it was mainly determined by TNU, NUpE, ANU, TDW, and ADW, which was similar to that seen for low-N conditions. The variance contribution rates of different principal components reflect the fact that bio-mass, N accumulation, and NUpE affect cotton NUE under different N levels.
The PCA can fully reflect the primary and secondary functions of cotton the low-N tolerance screening indexes, thus comprehensively evaluating differences in N-efficient genotypes. Based on the correlations of agronomic or N traits and PCA, we confirmed TDW, ADW, TNU, and NUpE as low-N tolerance screening indexes.
Heatmap clustering analysis and the classification of N-efficiency genotypes
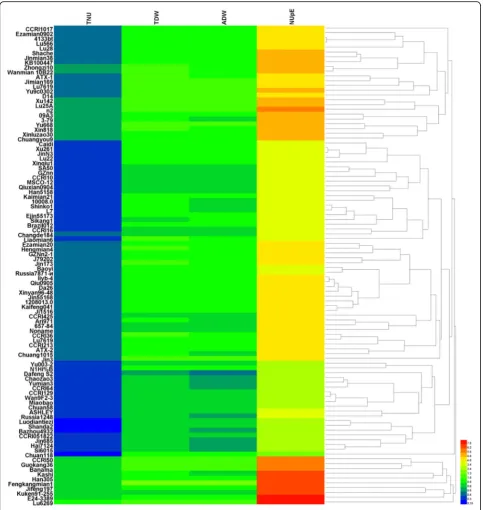
Using relative values of TDW, ADW, TNU, and NUpE as screening indexes and the Euclidean squared distance metric, the 100 cotton genotypes were analyzed with heatmap clustering analysis to reflect data differences by a color change gradient (Fig.1).
According to the clustering results, the different cotton genotypes were classified into six categories with
descending index values: the first class included one geno-type (Lu 6269) with the largest relative values of TDW, TNU, ADW, and NUpE; the second class included nine genotypes (CCRI 50, Guokang 36, Bananma, Han 305, Kashi, Fengkangmian 1, Jifeng 197, Kuken 91–255, and E 24–3389); the third class included one genotype (Chuang 118); the fourth class included 19 genotypes (Yu 003–2, N1H1%B, DafengS2, Chaozao 3, Yumian3, CCRI 64, CCRI 129, Wan 9F2–3, Miaobao, Chuan 58, ASHLEY, Russia 1248, Luodiantiezi, Shanda 2, Baz-hou 4932, CCRI 051822, Jin 685, Hai 7124, and Si 6015); the fifth class included 46 genotypes with low TNU values and medium values of TDW, ADW, and NUpE; and the sixth class included 24 genotypes with medium relative index values. Comprehensive analysis showed that the 10 genotypes in the first and second classes have low-N tolerant genotypes, while the 20 genotypes in the third and fourth classes have low-N sensitive genotypes.
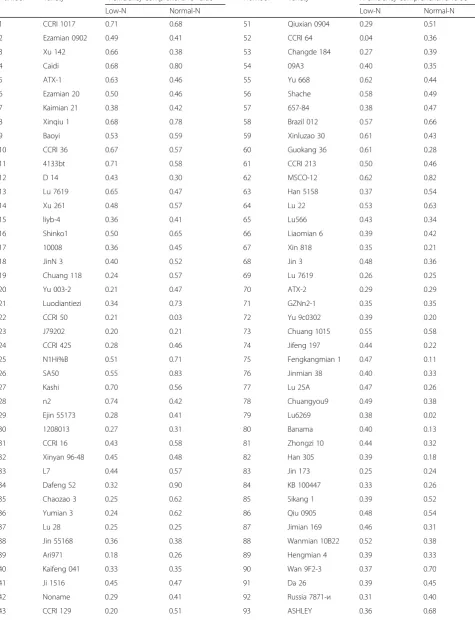
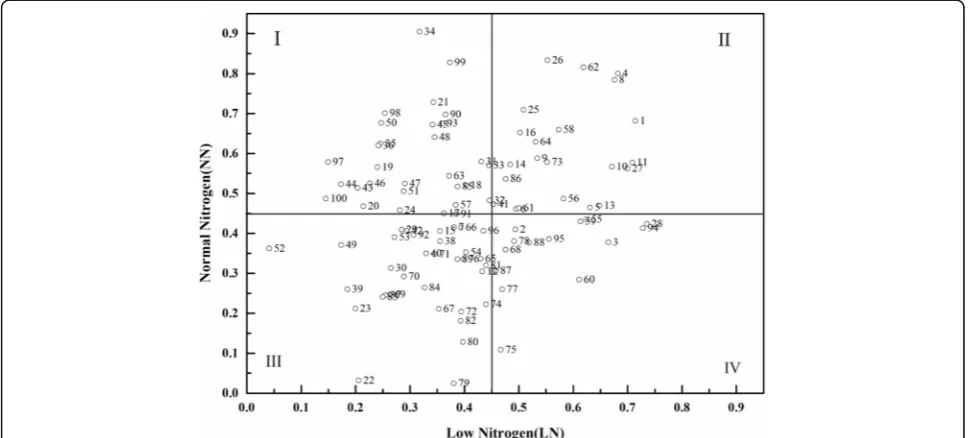
Using TDW, ADW, TNU, and NUpE as screening indexes, the NEI of different genotypes were determined by the subordinate function method under low-N and normal-N conditions (Table 4). The NEI varied signifi-cantly across different cotton genotypes, showing vari-ation change of 0.04~ 0.74 and 0.02~ 0.90 under low-N and normal-N conditions, respectively.
According to the NEI scatter map under low-N and normal-N conditions, cotton genotypes were classified into four types (Fig. 2): inefficient under low-N condi-tions but efficient under normal-N condicondi-tions (Class I); efficient under both low and normal-N conditions (Class II); inefficient under both low and normal-N conditions (Class III); and efficient under low-N conditions but Table 3Factor loading matrix of principle components reserved of cotton agronomic traits under different nitrogen conditions
Index Low nitrogen Normal nitrogen
Principal component 1
Principal component 2
Principal component 3
Principal component 1
Principal component 2
Principal component 3
SPAD −0.28 −0.32 0.37 −0.33 0.31 0.75
Height 0.73 0.40 −0.045 0.69 0.27 −0.36
ADW 0.88 0.29 −0.06 0.89 0.32 −0.045
RDW 0.79 0.46 0.076 0.77 0.49 0.15
TDW 0.90 0.37 −0.012 0.90 0.40 0.02
ANU 0.74 −0.59 −0.33 0.91 −0.30 −0.063
RNU 0.44 0.079 0.84 0.65 −0.15 0.49
TNU 0.85 −0.52 0.002 0.95 −0.29 0.066
NUtE −0.053 0.95 −0.14 −0.19 0.96 −0.11
NUpE 0.85 −0.52 0.001 0.95 −0.30 0.071
Eigenvalue 5.00 2.47 0.98 5.86 1.88 0.98
Variance contribution rate
50.01 24.70 9.82 58.64 18.81 9.76
Cumulative percentage
inefficient under normal-N conditions (Class IV). The distributions of cotton genotypes among classes were 28, 22, 36, and 14% for Classes 1–4, respectively. Among the 10 varieties of low-N tolerant (N-efficient) genotypes shown by heatmap clustering analysis, five belonged to Class III, four to Class IV, and only one (Kashi) belonged to Class II. Among the 20 genotypes of low-N sensitive (N-inefficient) genotypes, 19 genotypes belonged to Class I and only one (CCRI 64) belonged to Class III.
Discussion
Genetic variation in agronomic traits and NUE
Tapping crop N utilization potentials and screening for N-efficient cultivars are useful ways of improving NUE and reducing adverse environmental impacts. Moreover, assessing crop performance as an interaction of genetics and the N environment has demonstrated the potential effectiveness of screening genotypes in low-N and high-N environments (Robinson et al.2007; Cormier et al.2016).
Table 4Nitrogen efficiency comprehensive value under different nitrogen levels at seedling stage
Number Variety N efficiency comprehensive value Number Variety N efficiency comprehensive value
Low-N Normal-N Low-N Normal-N
1 CCRI 1017 0.71 0.68 51 Qiuxian 0904 0.29 0.51
2 Ezamian 0902 0.49 0.41 52 CCRI 64 0.04 0.36
3 Xu 142 0.66 0.38 53 Changde 184 0.27 0.39
4 Caidi 0.68 0.80 54 09A3 0.40 0.35
5 ATX-1 0.63 0.46 55 Yu 668 0.62 0.44
6 Ezamian 20 0.50 0.46 56 Shache 0.58 0.49
7 Kaimian 21 0.38 0.42 57 657-84 0.38 0.47
8 Xinqiu 1 0.68 0.78 58 Brazil 012 0.57 0.66
9 Baoyi 0.53 0.59 59 Xinluzao 30 0.61 0.43
10 CCRI 36 0.67 0.57 60 Guokang 36 0.61 0.28
11 4133bt 0.71 0.58 61 CCRI 213 0.50 0.46
12 D 14 0.43 0.30 62 MSCO-12 0.62 0.82
13 Lu 7619 0.65 0.47 63 Han 5158 0.37 0.54
14 Xu 261 0.48 0.57 64 Lu 22 0.53 0.63
15 liyb-4 0.36 0.41 65 Lu566 0.43 0.34
16 Shinko1 0.50 0.65 66 Liaomian 6 0.39 0.42
17 10008 0.36 0.45 67 Xin 818 0.35 0.21
18 JinN 3 0.40 0.52 68 Jin 3 0.48 0.36
19 Chuang 118 0.24 0.57 69 Lu 7619 0.26 0.25
20 Yu 003-2 0.21 0.47 70 ATX-2 0.29 0.29
21 Luodiantiezi 0.34 0.73 71 GZNn2-1 0.35 0.35
22 CCRI 50 0.21 0.03 72 Yu 9c0302 0.39 0.20
23 J79202 0.20 0.21 73 Chuang 1015 0.55 0.58
24 CCRI 425 0.28 0.46 74 Jifeng 197 0.44 0.22
25 N1Hi%B 0.51 0.71 75 Fengkangmian 1 0.47 0.11
26 SA50 0.55 0.83 76 Jinmian 38 0.40 0.33
27 Kashi 0.70 0.56 77 Lu 25A 0.47 0.26
28 n2 0.74 0.42 78 Chuangyou9 0.49 0.38
29 Ejin 55173 0.28 0.41 79 Lu6269 0.38 0.02
30 1208013 0.27 0.31 80 Banama 0.40 0.13
31 CCRI 16 0.43 0.58 81 Zhongzi 10 0.44 0.32
32 Xinyan 96-48 0.45 0.48 82 Han 305 0.39 0.18
33 L7 0.44 0.57 83 Jin 173 0.25 0.24
34 Dafeng S2 0.32 0.90 84 KB 100447 0.33 0.26
35 Chaozao 3 0.25 0.62 85 Sikang 1 0.39 0.52
36 Yumian 3 0.24 0.62 86 Qiu 0905 0.48 0.54
37 Lu 28 0.25 0.25 87 Jimian 169 0.46 0.31
38 Jin 55168 0.36 0.38 88 Wanmian 10B22 0.52 0.38
39 Ari971 0.18 0.26 89 Hengmian 4 0.39 0.33
40 Kaifeng 041 0.33 0.35 90 Wan 9F2-3 0.37 0.70
41 Ji 1516 0.45 0.47 91 Da 26 0.39 0.45
42 Noname 0.29 0.41 92 Russia 7871-и 0.31 0.40
The most direct and objective method for screening low-N tolerance genotypes is to plant in N-deficient soil and to evaluate the economic yield. However, conducting field experiments that cover the whole plant growth period is not only time and labor consuming, but also inefficient. Additionally, the spatial and temporal hetero-geneity of the soil N pool will increase the difficulty of controlling experimental conditions. Studies have shown that the sand culture method is viable for screening high N-efficient crops over short periods compared with field experiments (Tian et al. 2008), and we confirmed this by observing significant genetic variation in N-related traits at the cotton seedling stage in our study.
Concurrent selection in both low-N and high-N envi-ronments increases the likelihood of identifying geno-types with the potential to perform well under optimal as well as N-limiting conditions. Many studies have reported the genetic variation of cotton agronomic traits and NUE under low-N and high-N conditions (Gaju et al. 2011; Anbessa et al. 2010; Hitz et al. 2017). The
cotton genotypes in our study showed a large variation in response to N treatments (Table1), with the N supply significantly affecting agronomic traits, especially plant height, biomass, and N content. Barraclough et al. (2010) observed a similar trend, which indicated that an N-constrained environment inhibits crop growth. The biomass of N-deprived cultivars is closely associated with root growth characterization (Zhang et al. 2015), and we observed dramatic variations in N accumulation with roots accumulating more N under N-deficient conditions than under normal conditions (Table1). Root morphology, architecture, and dynamics are tightly associated with external N conditions that affect the plant growth, productivity, and NUE (Whu et al.2005). N-deficit stress may promote plant root growth, which is visible as increases in root biomass, length, surface area, and volume to improve N uptake through the N saving management strategy. Under N-deficient stress, more photosynthates are used by the root system to form a larger root system (Eghball and Maranville1993).
Table 4Nitrogen efficiency comprehensive value under different nitrogen levels at seedling stage(Continued)
Number Variety N efficiency comprehensive value Number Variety N efficiency comprehensive value
Low-N Normal-N Low-N Normal-N
44 Shanda 2 0.17 0.52 94 E24-3389 0.73 0.41
45 CCRI 051822 0.34 0.67 95 Kuken 91-255 0.56 0.39
46 Miaobao 0.23 0.53 96 3-79 0.44 0.41
47 CCRI 10 0.29 0.52 97 Bazhou 4932 0.15 0.58
48 Chuan 58 0.34 0.64 98 Hai 7124 0.25 0.70
49 GZnn 0.17 0.37 99 Si 6015 0.37 0.83
50 Jin 685 0.25 0.68 100 Russia 1248 0.15 0.49
Cotton growth and yield are positively associated with nutrient uptake and assimilation. N-use efficiency can be divided into two components: NUpE and NUtE. In the present study, we observed significant variation in the genotypes for NUtE and NUpE under both low-N and normal-N conditions. Indeed, average NUtE and NUpE values were higher under low-N levels than under normal-N levels (Table1). It is possible that N-starvation stress prompts the plant to take up and assimilate the lim-iting N at the seedling stage. Several previous studies have indicated that NUpE accounts for a greater proportion of genetic variation in NUE at low-N than at normal-N sup-plies (Muurinen et al.2006; Gaju et al.2011; Bingham et al. 2012). We also observed a higher CV for NUpE than NUtE, regardless of the level of N, which indicates that genetic variations in NUE at the seedling stage are mainly caused by NUpE not NUtE.
The evaluation index system of N-efficient genotypes Developing N-efficient cultivars and analyzing their traits have been studied extensively in wheat, maize, rice, and cot-ton, yet uncertainty remains over the genetic underpinning of these traits. Not only achieve accuracy and precision is it difficult to in trait measurement because of pronounced environmental effects and excessive experimental noise, but traits or selection criteria that can be used in screening programs are also lacking. Many indexes are available to evaluate low-N tolerance capacities, such as SPAD, crop yield, N content, dry weight, nitrate reductase activity, and glutamine synthase activity, but agreement has not been reached regarding the use of these thus so far (Robinson et al.2007; Wang et al.2011; Zhang et al.2015).
In our study, we found that agronomic or N traits such as biomass, N content, and NUE were closely related to cotton growth. However, a high CV value was observed for most traits, except for SPAD, which reflects the genetic variation of the screening index (Tian et al. 2008). Zhong et al. (2017) and Chen et al. (2016) reported similar findings in tobacco and rice. In contrast to Hitz et al. (2017), we did not observe a strong effect of the N regime on the correlation of agronomic or N traits. The traits were significantly correlated under low-N and normal-N conditions, suggesting that the selection indexes are viable and effective. PCA evalu-ation of genetic varievalu-ation in N use revealed that the first principal component was mainly determined by TDW, ADW, TNU, and NUpE under low-N and normal-N conditions (Table 3). These four traits associated with plant biomass, N accumulation, and N efficiency, and were sensitive to genetic variation in NUE. Our results also suggested that the activities of TDW, ADW, TNU, and NUpE can be used as references for predicting cotton genotypes that were efficient under N-deficient conditions.
The classification of N-efficient genotypes
Screening breeding lines under low-N and high-N envi-ronments are critical to identifying N-efficient genotypes that will perform well under the lower N levels required to satisfy environmental concerns and prohibitive input costs. Cultivars with low N fertilizer requirements and high N absorption levels are needed for efficient N utilization (Le Gouis et al. 2000; Mansour et al. 2017). According to the different capacity of tolerance to low N fertilizers, genotypes can be defined as low-N sensitive, intermediate, and low-N tolerant types. As shown in Fig. 1, 10 genotypes in our study belong to the low-N sensitive type, 20 to the low-N tolerant type, and the remaining 70 are of the intermediate type.
Considering the tolerance to low-N alone and ignoring NUE and its components, it is easy to screen out geno-types with a high tolerance to low-N but a lower NUE under low-N and normal-N conditions; however, these are not true N-efficient genotypes (Gaju et al.2011). In-deed, because of autologous genetic differences in nutri-ent absorption and utilization, the crop N efficiency may be inconsistent under different N concentrations. The efficiency of nutrient utilization is often defined as the ability of plants to absorb a certain element present at low levels in the soil or nutrient environment (Dawson et al.2008). Therefore, it is more reliable and authorita-tive to classify N-efficient genotypes in accordance with the N response under different N regimes (Liu et al. 1999; Tsai et al.1984). According to Fig.2, four nitrogen efficiency types were classified in our study: inefficient under low N but efficient under normal N (Class I); effi-cient under both low and normal N (Class II); ineffieffi-cient under both low and normal N (Class III); and efficient under low N but inefficient under normal N (Class IV). Therefore, by combining tolerance to low-N with N effi-ciency, we identified Kashi as an N-efficient and low-N tolerant genotype, and CCRI 64 as an N-inefficient and low-N sensitive genotype. Further study should be carried out to verify yield and heritability effects of these genotypes in the field.
Conclusions
sensitive and N-inefficient cotton genotype. Typical geno-types would need to be verified their yield and heritability effects in open field conditions. Therefore, our results can be performed as part of the selection strategy for N-efficient genotype and present greater potential for sustainable agri-cultural development.
Abbreviations
ADW:Aboveground dry weight; ANU: Aboveground nitrogen uptake; CV: Coefficient of variation; NEI: N efficiency comprehensive index; NUE: N use efficiency; NUpE: Nitrogen uptake efficiency; NUtE: Nitrogen utilization efficiency; RDW: Root dry weight; RNU: Root nitrogen uptake; TDW: Total dry weight; TNU: Total nitrogen uptake
Funding
National Key R&D Plan (No.2017YFD0201900, 2017YFD0101600), State Key Laboratory of Cotton Biology Fund (CB2016C14).
Availability of data and materials
The datasets used and analyzed during the current study are available from the corresponding author on reasonable request.
Authors’contributions
Zhang HH conducted the main experiment and drafted the manuscript and Fu XQ participated in data collection and analysis and modified the language. Wang XR performed part of the statistical analysis and revised the manuscript. Gui HP, Dong Q, Pang NC and Wang Z helped to collect data. Song MZ and Zhang XL conceived of the study, participated in its design and coordination and helped to revise the manuscript. All authors read and approved the final manuscript.
Ethics approval and consent to participate
Not applicable.
Consent for publication
Not applicable.
Competing interests
The authors declare that they have no competing interests.
Publisher’s Note
Springer Nature remains neutral with regard to jurisdictional claims in published maps and institutional affiliations.
Received: 24 May 2018 Accepted: 12 July 2018
References
Al-Naggar AMM, Shabana R, Atta MMM, et al. Regression of grain yield of maize inbred lines and their diallel crosses on elevated levels of soil-nitrogen. Int J Plant Soil Sci. 2015;4(6):499–512.
Anbessa Y, Juskiw P, Good A, et al. Selection efficiency across environments in improvement of barley yield for moderately low nitrogen environments. Crop Sci. 2010;50(2):451–7.
Barraclough PB, Howarth JR, Jones J, et al. Nitrogen efficiency of wheat: genotypic and environmental variation and prospects for improvement. Eur J Agron. 2010;33(1):1–11.
Behrens T, Ulas A, Wiesler F, et al. Agronomic traits contributing to nitrogen efficiency of winter oilseed rape cultivars. Field Crops Res. 2011;124(1):114–23. Berry PM, Spink J, Foulkes MJ, et al. The physiological basis of genotypic
differences in nitrogen use efficiency in oilseed rape (Brassica napusL.). Field Crops Res. 2010;119(2–3):365–73.
Bingham IJ, Karley AJ, White PJ, et al. Analysis of improvements in nitrogen use efficiency associated with 75 years of spring barley breeding. Eur J Agron. 2012;42:49–58.
Bouchet AS, Laperche A, Bissuel-Belaygue C, et al. Nitrogen use efficiency in rapeseed. A review. Agron Sustain Dev. 2016;36(2):38.
Brancourt-Hulmel M, Heumez E, Pluchard P, et al. Indirect versus direct selection of winter wheat for low-input or high-input levels. Crop Sci. 2005;45(4):1427–31.
Bremner JM, Mulvaney CS. Nitrogen-Total. In: Page AL, Miller RH, Keeney DK, editors. Methods Of Soil Analysis. Part 2-Chemical and Microbiological Properties. Wisconsin: Soil Science of America, Inc; 1982. p. 595–616. Cassman KG, Dobermann A, Walters DT, et al. Meeting cereal demand while
protecting natural resources and improving environmental quality. Ann Rev Environ Resour. 2003;28:315–58.
Chen C, Gong HQ, Zhang JZ, et al. Evaluation of nitrogen nutrition characteristics of different rice cultivars at seedling stage. Chin J Eco-Agric. 2016;24(10): 1347-1355. https://doi.org/10.13930/j.cnki.cjea.160130. (in Chinese ). Cheng JF, Jiang HY, Liu YB, et al. Methods on identification and screening of rice
genotypes with high nitrogen efficiency. Rice Sci. 2011;18(2):127–35. Cormier F, Foulkes J, Hirel B, et al. Breeding for increased nitrogen-use efficiency:
a review for wheat (T. aestivumL.). Plant Breed. 2016;135(3):255–78. Dawson JC, Huggins DR, Jones SS. Characterizing nitrogen use efficiency in
natural and agricultural ecosystems to improve the performance of cereal crops in low-input and organic agricultural systems. Field Crops Res. 2008;107(2):89–101.
Eghball B, Maranville JW. Root development and nitrogen influx of corn genotypes grown under combined drought and nitrogen stress. Agron J. 1993;85:147–52.
Feng L, Dai JL, Tian LW, et al. Review of the technology for high-yielding and efficient cotton cultivation in the northwest inland cotton-growing region of China. Field Crops Res. 2017;208:18–26.
Gaju O, Allard V, Martre P, et al. Identification of traits to improve the nitrogen-use efficiency of wheat genotypes. Field Crops Res. 2011;123(2):139–52. Gallais A, Hirel B. An approach to the genetics of nitrogen use efficiency in
maize. J Exp Bot. 2004;55:295–306.
Gouis JL, Gaju O, Hubbart S, et al. Genetic improvement for an increased nitrogen use efficiency in wheat. Asp Appl Biol. 2010;105:151–58. Hitz K, Clark AJ, Van Sanford DA. Identifying nitrogen-use efficient soft red winter
wheat lines in high and low nitrogen environments. Field Crops Res. 2017;200:1–9. Hu BL, Yu SW, Wan Y, et al. Drought-resistance identification of Dongxiang
common wild riceOryza rufipogonGriff. in whole growth period. Acta Agron Sin. 2007;33(3):425–32. (in Chinese)
ICR-CAAS (Institute of Cotton Research, Chinese Academy of Agricultural Sciences). Chinese Cotton Cultivation. Shanghai: Shanghai Science and Technology Press; 2013. (in Chinese).
Khan A, Tan DKY, Afridi MZ, et al. Nitrogen fertility and abiotic stresses management in cotton crop: a review. Environ Sci Pollut Res. 2017;24(17): 14551–66.
Le Gouis J, Béghin D, Heumez E, et al. Genetic differences for nitrogen uptake and nitrogen utilisation efficiencies in winter wheat. Eur J Agron. 2000;12(3): 163–73.
Li XN, Sheng J, Hou J, et al. Screening for nitrogen efficiency in different cotton varieties at seeding stage. J Xinjiang Agric Univ. 2007;(3):10. (in Chinese) Liu JA, Mi GH, Zhang FS. Difference in nitrogen efficiency among maize
genotypes. J Agric Biotechnol. 1999;7(3):248–254.
Mansour E, Merwad AMA, Yasin MAT, et al. Nitrogen use efficiency in spring wheat: genotypic variation and grain yield response under sandy soil conditions. J Agric Sci. 2017;155(9):1407–23.
Moll RH, Kamprath EJ, Jackson WA. Analysis and interpretation of factors which contribute to efficiency to nitrogen utilization. Agron J. 1982;74:562–64. Muurinen S, Slafer GA, Peltonen-Sainio P. Breeding effects on nitrogen use efficiency
of spring cereals under northern conditions. Crop Sci. 2006;46:561–8. Peng SB, Buresh RJ, Huang JL, et al. Strategies for overcoming low
agronomic nitrogen use efficiency in irrigated rice systems in China. Field Crops Res. 2006;96(1):37–47.
Presterl T, Seitz G, Landbeck M, et al. Improving nitrogen-use efficiency in European maize. Crop Sci. 2003;43(4):1259–65.
Qiao J, Yang LZ, Yan TM, et al. Nitrogen fertilizer reduction in rice production for two consecutive years in the Taihu Lake area. Agric Ecosyst Environ. 2012; 146(1):103–12.
Robinson N, Fletcher A, Whan A, et al. Sugarcane genotypes differ in internal nitrogen use efficiency. Funct Plant Biol. 2007;34(12):1122–9.
Sattelmacher B, Horst WJ, Becker HC. Factors that contribute to genetic variation for nutrient efficiency of crop plants. J Plant Nutr Soil Sci. 1994;157(3):215–24. Sieling K, Kage H. The potential of semi-dwarf oilseed rape genotypes to reduce
the risk of N leaching. J Agric Sci. 2008;146(1):77–84.
Tsai CY, Huber DM, Glover DV, et al. Relationship of N deposition to grain yield and N response of three maize hybrids. Crop Sci. 1984;24(2):277–81. Wang RF, An DG, Hu CS, et al. Relationship between nitrogen uptake and use
efficiency of winter wheat grown in the North China Plain. Crop Pasture Sci. 2011;62(6):504–14.
Whu L, McGechan MB, Watson CA, et al. Developing existing plant root system architecture models to meet future agricultural challenges. Adv Agron. 2005;85:181–219.
Zhang FF, Gao S, Zhao YY, et al. Growth traits and nitrogen assimilation-associated physiological parameters of wheat (Triticum aestivumL.) under low and high N conditions. J Integr Agr. 2015;14(7):1295–308.
Zhang FS, Chen XP, Vitousek P. Chinese agriculture: an experiment for the world. Nature. 2013;497(7447):33–5.