Improvement of Economic Aspect of Power
Network Congestion Management by
Swarm Intelligence based Multi-objective
Algorithm
SANDIP CHANDA1*, ABHINANDAN DE2
1
Dept of EE, Techno India, EM4/1 Sector V, Kolkata, India. 2
Dept of EE, Bengal Engg. & Science Univ., Shibpur, Howrah, India.
Abstract: This paper presents a methodology based on a rescheduling algorithm for congestion constrained cost optimization in Particle Swarm Optimization environment. For proper maintenance of security and reliability, the congestion level of lines should be restricted to a stipulated value considering stability and demand constraints. The algorithm, proposed in this paper is capable of limiting line congestion with a minimum management charge without any load curtailment and installation of FACTS devices and it also provides better operating conditions in respect of voltage profile, total line loss and security for the system during contingency. For contingency selection and ranking, a Line Loading Index has also been proposed in this paper. A comparative analysis considering conventional cost optimization has also been presented in this paper which shows the applicability of the algorithm to minimize congestion management cost .It has also been shown that the implementation of the proposed methodology can offer a net saving of congestion cost which may appear as social welfare for the market participants. The proposed algorithm has been shown to be tested on IEEE 30 bus test system and the results obtained, looked promising.
Keywords-Congestionmanagement; Rescheduling Algorithm; Contingency; Particle Swarm Optimization; I. Introduction:
systems. Dynamic control of congestion as reported in [16] may be too expensive and also require precise monitoring.
In the present work, the congestion zones in a power network are first identified using a ‘line loading index’ method described in section II. The computed line loading indices further assists to develop the ranking table where most congested (heavily loaded) lines can be easily identified. Tripping of one or more of these lines lead to even greater level of congestion in the remaining lines. The objective of the present work is to relieve congestion in these lines by formulating a ‘penalty based congestion constrained OPF problem’ and solving the same using Particle Swarm Optimization (PSO) technique as described in section II. The OPF solution attempts to reschedule the generators in such a way that the individual line flows are brought down to a desired level, not exceeding their loadability limits. The effectiveness of the proposed algorithm has been demonstrated on the modified IEEE 30 bus system under contingencies. The results indicate that the method proposed in this paper is efficient in limiting line congestion at the cost of a nominal ‘congestion management charge’ without any load curtailment and installation of FACTS devices. The proposed method also provides better management of bus voltage profile, reduces the total line loss and improves the security of the system in the event of contingencies. The work in this paper has been divided into two sections. The first section is the theory containing problem formulation, implementation of the proposed methodology with PSO and the formulation of the proposed line loading index. Simulation and results to depict the applicability of the proposed methodology to minimize congestion, operating cost and to offer a net saving in respect of congestion management cost have been presented in the second part of the paper.
II. Theory:
The proposed methodology rests on proper formulation of the objective functions along with the constraints. The methodology has been primarily used with voltage security and line loss penalty based optimization along with conventional cost optimization and then it has been applied with the proposed congestion constrained cost optimization problem using PSO. The equality, inequality and security constraints , however remains same for the all the two algorithms and the proposed algorithm.
A. Problem formulation:
Objective function for conventional cost optimization: Minimize
1
G T
N
n
F C
=
=
$/hr (1)Ci =APgi2+BPgi +C (2) NG=No of generators
A, B, C = cost co-efficient of generators Pgi = generation of ith generator in MW.
Objective function for voltage and line loss penalty based optimization: Minimize
min max
1
1 2
G T
N
l n
F C p xV p xP
=
=
+ + $/hr (3)p1=Penalty for voltage
Vmin= Minimum bus voltage in p.u. to be allowed. p2=Penalty for line loss
Plmax=Maximum limit of line loss to be allowed
min max max 1
1 2 3
G T
N
l ij
n
F C p xV p xP p xP
=
=
+ + + $/hr (4)p3=Penalty for congestion
Pijmax=Maximum line flow to be allowed between ith and jth bus.
The penalties are added only when the constrains violate their limit as in case of static penalty optimization. The constraints are common for all the above objective functions and are as follows:
1. Equality or power balance constraints:
1
( cos sin ) 0
n
Gi Di i j ij ij ij ij
i
P P V V G
θ
Bθ
=
− −
+ = (5)1
( sin cos ) 0
n
Gi Di i j ij ij ij ij
i
Q Q V V G
θ
Bθ
=
− −
− = (6)Gi
P =Active power injected in bus i Di
P =Active power demand on bus i i
V =magnitude of voltage of buse i j
V = magnitude of voltage of buse j ij
G =Conductance of transmission line from bus i to j ij
B = Susceptance of transmission line from bus i to j n= no of buses
2. Inequality or generator output constraints: min max
gi gi gi
P ≤P ≤P (7) min max
gi gi gi
Q ≤Q ≤Q (8)
gi
P ,Qgi= Active and reactive power of generator i respectively min
gi
P ,Qgimin=Upper limit of active and reactive power of the generators max
gi
P , Qgimax=lower limit of active and reactive power of the generators
3.Voltage constraint: min max
i i i
V ≤ ≤V V (9) max
i
V ,Vimin are upper and lower limit of Vi
4. Transmission constraint:
Pijmax ≤Pij ≤Pijmin (10)
max ij
P ,Pijmin are the max and minimum line flow limits of Pij
B. Line loading index :
thermal limits of lines. The lines having high value of loading index represent the most congested lines in a system, and outage or further loading of these lines will lead to the worst possible contingencies of the system. The congestion level of a line can be judged by an index proposed as
Line loading index= Pij
SIL (11)
ij
P = Line flow between ith and jth bus SIL= surge impedance loading of the line
It is quite imperative that the higher the value of this index, the higher is the congestion level and lower is its security level of that line.
C. Methodology implementation with PSO :
PSO is a population based optimization method first proposed by Kennedy and Eberhart in 1995.[19]-[20]. This algorithm is motivated by social behavior of organisms, such as bird flocking. In PSO, a number of particles constitute a swarm, and each particle is a solution of the optimization problem. The position of each particle in represented by XY axis position and also velocity is expressed by Vx (velocity in x axis ) and Vy( velocity in Y axis).
1
1 1 2 2
. (....) ( ) (....) ( )
k k k k
i i i i i
v + =wV +c xrand x pbest −x +c xrand x gbest−x (12)
1 1
k k k
i i i
x + =x +v + (13) Each particle knows its best value so far (pbest) and its XY position. This information is analogy of personal
experience of each agent. Moreover each agent knows its best value so far in the group (gbest) among pbests. 1
1
1 1
if (
if ( ) pbest
t t t
i i i
t
i t t t
i i i
pbest f x pbest
pbest
x f x
+ +
+ +
) >
=
<
(14)
1 1 1 1
1 2
( , ... )
t t t t
i N
gbest+ =best pbest+ pbest+ pbest+ (15)
Each agent tries to modify its position using the following information : The current position (x,y).
the current velocities(Vx,Vy).
The distance between current position and pbest and the distance between current position and gbest.
III. Case study on modified IEEE 30 bus system :
The feasibility and effectiveness of the proposed algorithm has been demonstrated in the modified IEEE 30 bus system shown in Fig. 1. The summary of relevant data from the modified IEEE 30 bus system is presented in Table IA and IB.A detailed description of the system is provided in appendix I along with parameter setting of adopted PSO.
Fig.2 The standard IEEE 30 bus system
TABLE IA: SYSTEM DESCRIPTION FOR CASE STUDIES
Sl. No
Variables 30 bus system
1 Buses 30
2 Branches 41
3 Generators 6
4 Generator buses 6
5 Total demand
(MW)
283.6
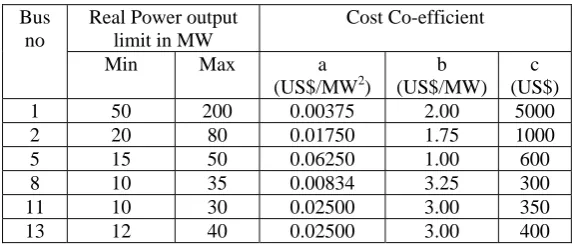
TABLE IB: GENERATOR COST CO-EFFICIENT OF IEEE 30 BUS SYSTEM
Bus no
Real Power output limit in MW
Cost Co-efficient
Min Max a
(US$/MW2)
b (US$/MW)
c (US$)
1 50 200 0.00375 2.00 5000
2 20 80 0.01750 1.75 1000
5 15 50 0.06250 1.00 600
8 10 35 0.00834 3.25 300
11 10 30 0.02500 3.00 350 13 12 40 0.02500 3.00 400
A. The step by step procedure followed in the present study are as follows :
1. For a given generation and load pattern, ac load flow analysis in the IEEE 30 bus system under study has been carried out using Newton-Raphson load flow method and overloaded lines have been selected using the proposed Line Loading index method described in Section II.
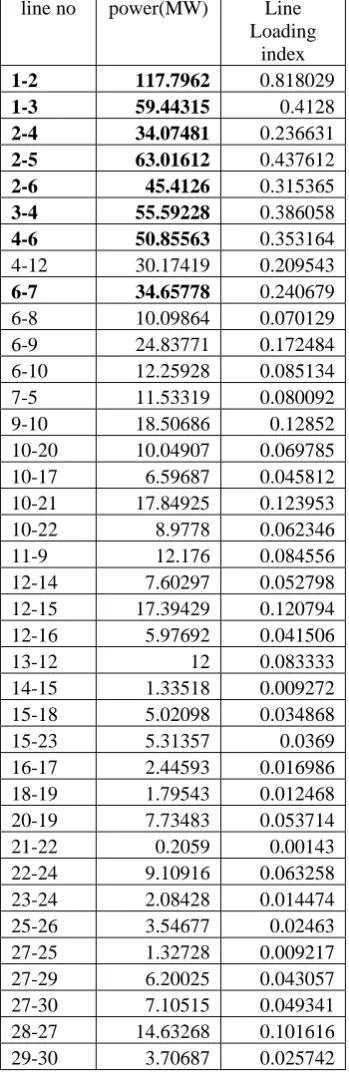
2. Six most congested lines were identified based upon their loading indices presented in Table II. It is obvious that tripping of one of these lines would lead to worst possible scenario in respect of congestion.
3. A multiobjective congestion constrained cost optimization algorithm has been developed using particle swarm optimization.
4.For outage of each of the six congested lines , according to the ranking table ac load flow has been carried out to determine the degree of congestion.
5. The constraints are set in PSO based OPF , each for maximum line flows ,line losses and minimum bus voltage amplitudes.
6. The results of PSO are evaluated to determine constraint violation. The penalties are applied for violation of maximum line flow limits , minimum value of p.u. bus voltage and on actual value of the line losses.
7. PSO search algorithm now looks for the optimal generation pattern which minimizes the overall operational cost including cost of generation , power loss charges , penalty charges for congestion and poor voltage profiles. 8.The search procedure repeats the following steps for a given number of iterations. The parameter setting of PSO based search is given in the appendix.
ii) The velocity is added with the previous iteration solution to obtain the new set of population following the equation [13]
iii) Ac power flow has been carried out and the fitness function is calculated as stated in step5. iv) Compare fitness values and find the best possible solution.
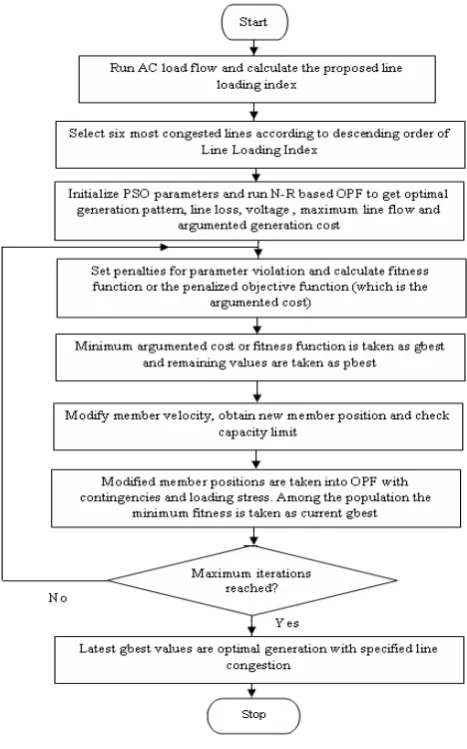
B. The detailed flow chart of the proposed algorithm is given in fig.2
Fig 2. Flowchart of the Proposed methodology
C. Identification of most vulnerable lines in terms of congestion by Line Loading Index :
TABLE II: SELECTION OF VULNERABLE LINES BY LINE LOADING INDEX
line no power(MW) Line Loading
index 1-2 117.7962 0.818029 1-3 59.44315 0.4128 2-4 34.07481 0.236631 2-5 63.01612 0.437612 2-6 45.4126 0.315365 3-4 55.59228 0.386058 4-6 50.85563 0.353164
4-12 30.17419 0.209543
6-7 34.65778 0.240679
6-8 10.09864 0.070129
6-9 24.83771 0.172484
6-10 12.25928 0.085134
7-5 11.53319 0.080092
9-10 18.50686 0.12852
10-20 10.04907 0.069785
10-17 6.59687 0.045812
10-21 17.84925 0.123953
10-22 8.9778 0.062346
11-9 12.176 0.084556
12-14 7.60297 0.052798
12-15 17.39429 0.120794
12-16 5.97692 0.041506
13-12 12 0.083333
14-15 1.33518 0.009272
15-18 5.02098 0.034868
15-23 5.31357 0.0369
16-17 2.44593 0.016986
18-19 1.79543 0.012468
20-19 7.73483 0.053714
21-22 0.2059 0.00143
22-24 9.10916 0.063258
23-24 2.08428 0.014474
25-26 3.54677 0.02463
27-25 1.32728 0.009217
27-29 6.20025 0.043057
27-30 7.10515 0.049341
28-27 14.63268 0.101616
29-30 3.70687 0.025742
D. Determination of line flow limit:
It is evident from the ranking Table II, 6 lines namely 1-2,2-5, 1-3, 3-4, 4-6 and 2-6 are most congested and it is quite apparent that their exclusion form the system would represent worst possible single line contingencies. It may be noted that with the increase of congestion, the security level of the lines decreases and at the same time the penalty cost associated with congestion level goes up. On the contrary relieving congestion in the lines will demand rescheduling of generation and increased generation cost, commonly termed as congestion relief cost. Thus the particular level of congestion relief to be adopted is an important area of study.
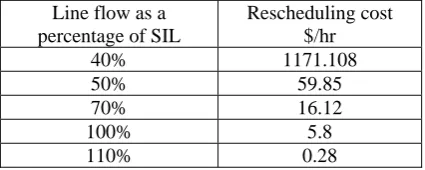
flow limit can be restricted to any arbitrary value but only at the cost of rescheduling .The maximum line flow limit, in practice should be chosen at such a value that it can cater possible new transactions and increase in load demand in future without exceeding SIL as well . Henceforth the line limit has been set at 50% of SIL.
TABLEIII: VARIATION OF CONGESTION RELIEF COST (RESCHEDULLING COST) FOR DIFFERENT ALLOWABLE LEVELS OF CONGESTION WITH 1-2 LINE TRIP
Line flow as a percentage of SIL
Rescheduling cost $/hr 40% 1171.108 50% 59.85 70% 16.12 100% 5.8 110% 0.28 E. Relieving congestion by imposing Penalty :
A practical approach for relieving congestion in the power lines would be to impose penalty for line flows exceeding the preset threshold limit for congestion. (50% of respective line SIL limits). Under this proposed congestion penalty regime, the system operator will be forced to reschedule the generation and transmission of power to avoid paying high penalty charges for routing power through already congested lines. The rescheduling of generation would generally mean an increase in generation cost above the optimum generation cost based upon cost co-efficients of generators alone . The objective should now be to optimize the overall operational cost of the power generating system including the cost of generation as well as the penalty cost due to congestion. The line losses under rescheduled power flow condition must be taken into consideration in the optimization problem. Further the voltage profile of the buses have to be maintained within the stipulated limits(±5%) of the nominal values . This can be ensured by imposing additional penalty for any deviation of load bus voltages beyond these stipulated limits. Thus the present problem reduces to a multi objective optimization problem described in section. The case study on IEEE 30 bus system under various contingent conditions demonstrate that the proposed multi-objective optimization will lead to minimization of overall operational cost of the system ( cost of generation plus various penalty charges ) at the same time relieving congestion on power lines and thereby enhancing the security
The present case study deals with n-1 contingency(1 from n elements to be contingent) of the system . Every time, the proposed algorithm reschedules the generators to achieve a feasible solution maintaining the voltage , power loss and congestion constraints. The table VI depicts the results of the case study where a comparison of line flows between the conventional method and the proposed method. In deregulated environment, the ISO can use this algorithm to re-schedule the GENCOS for required level of congestion management during contingency..
TABLE IV: COMPARISON OF LINE FLOW WITH CONVENTIONAL, AND PROPOSED PENALTY BASED OPTIMISATIONS
Tripp ed lines
Conventional Optimization without any Penalty
Optimization with voltage and power loss Penalty
Optimization with voltage ,power loss and congestion Penalty Gener a- tion cost ($/hr) Line loss (M W) min volta ge (pu) Max line flow (MW ) Gener a- tion cost ($/hr) Line loss (M W) Min volta ge (PU) Max line flow (MW ) Generati on cost($) Line loss (M W) Min volta ge (PU) Max line flow (M W) 1-2 8490 16.2
9
0.991 7
151.3
0 8600 8.43
0.994 7
101.0
5 8560 5.73
0.994 4
71.9 9 2-5 8490 18.3
2
0.990 4
103.4
9 9250 6.58
0.993
2 41.44 8910 6.81
0.993 4
50.5 9 1-3 8470 12.3
2
0.992 8
169.4
7 8520 5.99
0.992
6 98.01 8560 5.18
0.992 4
71.9 8 3-4 8460 12.1
4 0.993 167.2
9 8520 5.99
0.992
6 98.01 8550 5.26
0.992 6
71.9 9 4-6 8460 10.3
5
0.991 3
129.2
6 8490 5.99
0.992
5 84.34 8510 5.98
0.992 1
71.9 4 2-6 8460 10.2
6 0.992 104.4
3 8490 5.99
0.992
5 69.68 8490 5.99
0.992 4
It is observed that the proposed multi-objective OPF algorithm can effectively reduce line flows only by re-scheduling of generation and without any load curtailment or installation of FACTS devices. As expected, the generation cost increases due to the change in individual contribution of the generators but overall savings in operational cost shall be achieved due to reduction in the penalty charges on congestion, voltage and power loss. The comparison of overall operating cost has been depicted in table V.
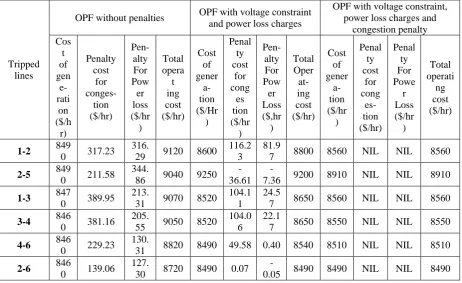
TABLE V: COMPARISON OF OPERATING COSTS
Tripped lines
OPF without penalties OPF with voltage constraint and power loss charges
OPF with voltage constraint, power loss charges and
congestion penalty Cos t of gen e- rati on ($/h r) Penalty cost for conges- tion ($/hr) Pen- alty For Pow er loss ($/hr ) Total opera t ing cost ($/hr) Cost of gener a- tion ($/Hr ) Penal ty cost for cong es tion ($/hr ) Pen- alty For Pow er Loss ($,hr ) Total Oper at- ing cost ($/hr) Cost of gener a- tion ($/hr ) Penal ty cost for cong es- tion ($/hr) Penal ty For Powe r Loss ($/hr ) Total operati ng cost ($/hr)
1-2 849
0 317.23 316.
29 9120 8600
116.2 3
81.9
7 8800 8560 NIL NIL 8560
2-5 849
0 211.58 344.
86 9040 9250
-36.61
-7.36 9200 8910 NIL NIL 8910
1-3 847
0 389.95 213.
31 9070 8520
104.1 1
24.5
7 8650 8560 NIL NIL 8560
3-4 846
0 381.16 205.
55 9050 8520
104.0 6
22.1
7 8650 8550 NIL NIL 8550
4-6 846
0 229.23 130.
31 8820 8490 49.58 0.40 8540 8510 NIL NIL 8510
2-6 846
0 139.06 127.
30 8720 8490 0.07
-0.05 8490 8490 NIL NIL 8490
The net saving in operational cost can now be defined as the difference between un-constrained operation (simply based on optimal generation schedules) and constrained based optimal operation (including various penalty charges). Table VI demonstrates the net savings achieved by i) voltage and power loss constrained OPF ii) congestion, voltage and power loss constrained OPF.
TABLE VI: SAVING WITH RE-SCHEDULLING
Tripped lines net savings for OPF with voltage constraint and power loss charges
($/hr)
net savings for OPF with voltage constraint, power loss charges and
congestion penalty ($/hr)
1-2 560 239
2-5 130 292
1-3 510 891
3-4 500 966
4-6 310 334
2-6 230 92
Congestion Management Cost :
Table VII: VARIATION OF CONGESTION MANAGEMENT COST WITH CONTINGENCIES
Tripped lines
Voltage and power loss management cost for OPF with voltage constraint and power loss
charges ($/hr)
congestion management charge for OPF with voltage constraint, power loss charges and congestion penalty
($/hr)
1-2 110 71.3
2-5 760 42.7
1-3 55.2 92.3
3-4 56 87.7
4-6 36.1 49.1`
2-6 35 34.9
OPERATIONAL ISSUES :
A. Generation Shift:
As mentioned earlier , the multi-objective OPF algorithm leads to wide generation shift from the conventional ‘generation cost coefficient’ based optimal generation scheduling .Further this generation will be variable depending upon the operating conditions and contingencies making it even more difficult for the GENCOs to pre-plan their generation schedule. In real time operation, the ISO has to negotiate with the GENCOs to realize this in practice. Sometimes the GENCOs may charge this additional amount for this generation shift which may further be incorporated in congestion management cost. [5]
Fig. 3 depicts the shift in generation under voltage and line loss constrained OPF and under congestion voltage and power loss constrained OPF from the base case (unconstrained optimal generation schedule) for normal operating condition of the system.
Fig3. Comparison of generation Shift
B. Improvement in Voltage Profile :
Fig.4 Comparison of voltage profile
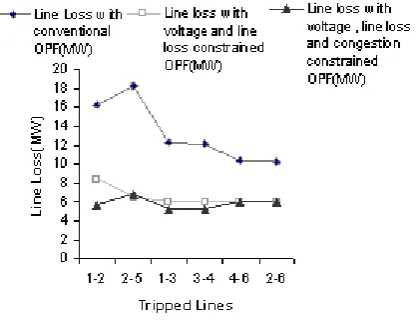
C. Reduction in Power Loss:
Improvement of performance of a power system network depends on line loss minimization. Along with congestion management, the proposed algorithm can cause a considerable reduction in total line loss . Fig 5 shows the comparison of total line losses of the network with the conventional and proposed algorithms. During the consideration of the generation shift, the cost of power losses and the corresponding saving need also to be calculated.
Fig 5. Comparison of total line losses
Conclusion:
References:
[1] Ye Peng , Yao Bing , Song Jiahua, Comparison study of Spot Price under Transmission Congestion with Different Control Mechanism, IEEE/PES Transmission and Distribution Conference & Exhibition : Asia and Pacific Dalian, China
[2] K. Selvi, T.Meena , Dr.N.Ramaraj ,A generation Rescheduling Method to Alleviate Line Overloads using PSO, IE(I) Journal-EL,2005 [3] Yu Xiaodan, Jia Hongjie, Zhao Jing, Wei Wei, Li Yan , Zeng Yuan, Interface Control Based on Power Flow Tracing and Generator
Re-redispatching, Automation of Electric Power Systems IEEE,2008
[4] G.Baskar, M.R. Mohan, Contingency constrained economic load dispatch using improved particle swarm optimization for security enhancement, Electric Power System Research Elsevier ,2008
[5] E.Muneender, M.D. Vinod Kumar,Optimal Rescheduling of real and reactive powers of generators for zonal Congestion Management Based on FDR PSO, IEEE T&D Asia, 2009
[6] Sujatha Balaraman, K.Kamaraj , Congestion management in Deregulated power system using real coded genetic algorithm, International Journal of Engineering Science and Technology , Vol2(11),2010,6681-6690
[7] Sujatha Balaraman , K. Kamaraj, Application of Diffrential Evolution for Congeation management in power system, Modern Applied Science ,Vol 4, No 8, August 2010
[8] Zhao Jinli, Jia Hongjie, Yu Xiaodan, Voltage Stability Control Based on real power flow tracing ,Proceedings of CSEE, IEEE,2009 [9] Xiaosong Zou, Xianjue Luo, Zhiwei Peng ,Congestion Management Ensuing Voltage Stability under Multicontingency with
preventive and Corrective Controls, IEEE,2009
[10] Hwa-Sik Choi, Seung II Moon ,A new Operation of series compensating device under Line Flow Congestion using the Linear zed Line Flow sensitivity, Power Engineering Society winter meeting IEEE,2001
[11] E.M. Yap, M.Al-Dabbagh, P.C. Thum ,UPFC Controller in Mitigating Line Congestion for Cost-Efficient Power Delivery, Power Engineering Conference IPEC, IEEE,2006
[12] Xiao-Ping Zhang , Liangzhong Yao, A Vision of Electricity network Congestion Management with FACTS and HVDC,DRPT2008, 6-9 April, 2008 Nanjing China
[13] Garng.M.Huang, Nirmal Kumar , C Nair ,An OPF based Algorithm to Evaluate Load Curtailment Incorporating Voltage Stability Margin Criteria, Power Engineering Society Winter Meeting ,IEEE, 2002
[14] Fei HE, Yihong WANG, Ka Wing CHAN, Yutong ZHANG, Shengwei MEI ,Optimal Load Shedding Stategy Based on Particle Swarm Optimisation, 8th international conference on Advances in Power System Control operation and Management .APSCOM 2009
[15] Igor Kopcak , Luiz C.P. da Silva , Vivaldo F. Da Costa, Jim S. Naturesa,Transmission Systems Congestion Management By Using Modal Participation Factors, IEEE Bologna Power Tech Conference , June 23-24, Bologna ,Italy,2003
[16] J.Ma, Y.H.Song,Q.Lu, S.Mei , Framework for dynamic congestion Management in open power markets, IEE Proc.Gener.Transm. Distrib. Vol.149,No.2 March 2002
[17] R.N.Nayak, Y.K. Sehgal, Subir Sen ,EHV Transmission Line Capacity Enhancement through Increase in Surge Impedance Loading Level, Power India Conference ,2006
[18] K.P. Basu , Power transfer Capability of Transmission Line Limited by voltage Stability : Simple Analytical Expressions, IEEE Power Engineering Review, September 2000
[19] Kennedy, J, and Eberhart.R , Particle Swarm Optimisation,. Proc. IEEE Int. Conf. Neural Netw. 1995, Vol 4, pp. 1942-1948 [20] Kennedy, J, and Eberhart.R , A New Optimiser using particle swarm theory,. Proc6th Int Symp on Micro Machine and Human science
Appendix
LINE DATA OF IEEE30 BUS SYSTEM
| From | To | R | X | B/2 | X'mer |
| Bus | Bus | pu | pu | pu | TAP (a) |
1 2 0.0192 0.0575 0.0264 1
1 3 0.0452 0.1652 0.0204 1
2 4 0.0570 0.1737 0.0184 1
3 4 0.0132 0.0379 0.0042 1
2 5 0.0472 0.1983 0.0209 1
2 6 0.0581 0.1763 0.0187 1
4 6 0.0119 0.0414 0.0045 1
5 7 0.0460 0.1160 0.0102 1
6 7 0.0267 0.0820 0.0085 1
6 8 0.0120 0.0420 0.0045 1
6 9 0.0 0.2080 0.0 0.978 6 10 0.0 0.5560 0.0 0.969 9 11 0.0 0.2080 0.0 1
9 10 0.0 0.1100 0.0 1
4 12 0.0 0.2560 0.0 0.932 12 13 0.0 0.1400 0.0 1
12 14 0.1231 0.2559 0.0 1
12 15 0.0662 0.1304 0.0 1
12 16 0.0945 0.1987 0.0 1
14 15 0.2210 0.1997 0.0 1
16 17 0.0824 0.1923 0.0 1
15 18 0.1073 0.2185 0.0 1
18 19 0.0639 0.1292 0.0 1
19 20 0.0340 0.0680 0.0 1
10 20 0.0936 0.2090 0.0 1
10 17 0.0324 0.0845 0.0 1
10 21 0.0348 0.0749 0.0 1
10 22 0.0727 0.1499 0.0 1
21 23 0.0116 0.0236 0.0 1
15 23 0.1000 0.2020 0.0 1
23 24 0.1320 0.2700 0.0 1
24 25 0.1885 0.3292 0.0 1
25 26 0.2544 0.3800 0.0 1
25 27 0.1093 0.2087 0.0 1
28 27 0.0 0.3960 0.0 0.968 27 29 0.2198 0.4153 0.0 1
27 30 0.3202 0.6027 0.0 1
29 30 0.2399 0.4533 0.0 1
8 28 0.0636 0.2000 0.0214 1
6 28 0.0169 0.0599 0.065 1 ];
PARAMETER SETTING OF PSO
Name of the parameter Value
Epochs 20 iterations (epochs) to train 100
acceleration const 1 (local best influence) 2 acceleration const 2 (global best influence) 2
Initial inertia weight 0.9 Final inertia weight 0.4 Epoch when inertial weight at final value 1500
epochs before error gradient criterion terminates run 1e-6
type flag 0
PSO seed 0
Conventional OPF Voltage and line loss Voltage, line loss and congestion Constrained OPF Constrained OPF