Analysis of Test Data Compression
Techniques Based on Complementary
Huffman Coding
Kinjal A. Bhavsar 1
Department of Electronics & Communication Engineering, VPMP polytechnic, Gandhinagar INDIA
Prof.Usha S.Mehta
22
Department of Electronics & Communication Engineering, Nirma Institute of Technology, Ahmedabad, INDIA
E Abstract
In this paper we describe the complementary Huffman encoding technique for test data compression for SOC.In this method we use complementary correlations between two blocks which can reduce size of Huffman tree compare to full Huffman but higher compare to selective and optimal Huffman coding and also increase compression ratios compare to selective and Huffman coding methods. Test application time is higher compare to full Huffman and less compare to selective and optimal selective Huffman coding.
Keywords: Automatic Test Equipment, Test Data Compression, Systems-on –a-chip, Compression ratio, On-chip decoder Area ,Test Application Time, Complementary coding.
1. Introduction
CORE-BASED design, i.e., the use of predesigned and preverified modules (cores) in modern Systems-on-a-Chip (SoCs), has become the dominant design strategy in the industry since it ensures the economic viability of electronic products. Although the utilization of cores shortens the design time of SoCs, the increased complexity of the latter introduces new challenges in the testing process. During testing, a large amount of data should be stored on the tester (Automatic Test Equipment—ATE), and then transferred at high rates deep into the chip. However, the limited channel capacity, memory, and speed of ATEs, as well as the reduced accessibility of some of the inner nodes of dense SoCs, make testing the bottleneck of the production cycle and, thus, the benefits from shortening the SoCs’ design time are compromised. For easing the burden of testing on ATEs and for providing the required accessibility to cores deeply embedded in a SoC, the ATE capabilities are combined with on-chip integrated test structures in an embedded testing framework. The test set of each core of an SoC is stored in the ATE’s memory in a compressed form and, during testing, it is downloaded into the chip, where it is decompressed and applied to the core. For cores of known structure, Automatic Test Pattern Generation (ATPG) and fault simulation are utilized in order to minimize the data stored on ATE, as in SmartBIST[10] ,Embedded Deterministic Test[14] ,and DBIST[18]. However, this is not possible for Intellectual property (IP) cores of unknown structure ,the test sets of which are provided precomputed by the core vendor. In such cases, direct test set encoding is performed most of the time since it combines minimum test application time with high compression ratios.
statistical code because it provably provides the shortest average codeword length among all uniquely decodable variable length codes[5] . The main problem of Huffman coding is the high hardware overhead of the required compressors. To alleviate this problem, selective Huffman coding and optimal Huffman coding used in which significantly reduces the decoder size by slightly sacrificing the compression ratio. Selective Huffman is a very attractive approach whose low hardware overhead allows the exploitation of the compression advantages of Huffman coding in the embedded testing framework.
In this paper we describe complementary encoding methods which reduces on-chip decoder area compare to full Huffman ,test data compression is high compare to selective and optimal selective Huffman coding and test application time is higher compare to full Huffman coding and less compare to selective and optimal selective Huffman coding
2. TEST DATA COMPRESSION ENVIRONMENT (TDCE)
TDCE comprising compression method and on -chip decoder, is defined and analyzed with respect to three TDCE parameters: compression ratio, area overhead and test application time. In this paper discuss two parameter compression ratios and area overhead of code based data compression technique which discuss in next section.
To better understand how the volume of test data and the area overhead can be simultaneously reduced, this section introduces the test data compression environment and characterizes the TDCE with respect to the factors which influence it. Two previous approaches are also analyzed from the TDCE parameters standpoint. Testing in TDCE implies sending the compressed test data from the ATE to the on-chip decoder, decompressing the test data on-chip and sending the decompressed test data to the core under test (CUT).
There are two main components in TDCE: the compression method, used to compress the test set off-chip, and the associated decompression method, based on an on-chip decoder, used to restore the initial test set on-chip. The on-chip decoder comprises two units: a unit to identify a compressed code and a unit to decompress it. If the two units can work independently (i.e., decompressing the current code and identifying a new code can be done simultaneously), then the decoder is called parallel. Otherwise, the decoder is referred to as serial.
TDCE Characterization
Testing in TDCE is characterized by the following two parameters:
(a) Compression ratiowhich identifies the performance of the compression method, the memory and channel capacity requirements of the ATE.
(b) Area overheadimposed by the on-chip decoder (dedicated hardware or on-chip processor) (c ) Test Application Time given by the time needed to transport and decode the compressed test set. There are a number of factors which influence the above parameters:
• The mapping and reordering algorithm, which prepares the test set for compression by mapping the “don’t cares” in the test set to ’0’s or ’1’s, and by reordering the test set
• The compression algorithm, which based on a coding scheme, compresses the initial test set.
• The type of input patterns used as input by the coding scheme, which can be of fixed or variable lengths.
• The length of the pattern which is the maximum allowed input pattern length used in the coding scheme.
• The type of the on-chip decoder, i.e., the on-chip decoder can be serial or parallel. TDCE parameters
1. Compression ratio: Using patterns of various types and various lengths, the compression algorithms exploit different features of the test set. Mapping and reordering the initial test set emphasizes these features. Therefore, the compression ratio is influenced firstly by the mapping and reordering algorithm, and then by the type of input patterns and the length of the pattern, and finally by the compression algorithm.
2. On –chip Decoder Area : On-chip decoder area is influenced firstly by the nature of the decoder, and then by the type of the input pattern and the length of the pattern. If the decoder is serial then the synchronization between the two units (code identification and decompression) is already at hand. However, if the decoder is parallel, then the two units have to synchronize, which can lead to increased control complexity and consequently to higher area overhead. Depending on the type of the input pattern different types of logic are required to generate the pattern on-chip. For example, if the coding scheme uses fixed-length input patterns, then a shift register is required to generate the patterns, however, if variable-length input patterns (runs of ’0’s for example) are used, then counters can be employed to generate the patterns. Since the length of the pattern impacts the size of the decoding logic, it also influences the area overhead.
can always process the currently compressed bit before the next one is sent by the ATE. In order to do so, the relation between the frequency at which the on-chip decoder works and the ATE operating frequency has to meet certain conditions. The frequency ratio is the ratio between the on chip test frequency ( fchip) and the ATE operating frequency ( fate). Consider that the optimum frequency ratio is the frequency ratio for which minTAT is obtained. Since the minTAT is given by the size of the compressed test set, increasing the compression ratio would imply further reduction in TAT. However, this reduction happens only if the optimum frequency condition is met. TAT in these cases is dependent on the type of on-chip decoder. If the on-chip decoder has a serial nature then the TAT is heavily influenced by changes in the frequency ratio. However, if the decoder has a parallel nature, the influences are rather minor. The length of the pattern determines the pattern distribution and at the same time, the number of clock cycles the on-chip decoder requires to generate a pattern. Therefore, the length of the pattern determines the optimum frequency ratio and, hence, it also influences the TAT.
3. COMPLEMENTARY ENCODING
Statistical codes belong in the category of fixed-to-variable codes since they represent data blocks of fixed length using variable length codewords. Compression is achieved by encoding the most frequently occurring blocks with short codewords and the less frequently occurring ones with long codewords. Therefore, the efficiency of a statistical code depends on the frequency of occurrence of all distinct fixed-length blocks in a set of data. As mentioned above, Huffman is the statistical code that provides the shortest average codeword length (it is closer than that of any other statistical code to the theoretical entropy bound) and, thus, offers the best compression. Moreover, Huffman code is prefix-free (i.e., no codeword is the prefix of another one) and, therefore, its decoding process is simple and easy.
3.1 Test data compression
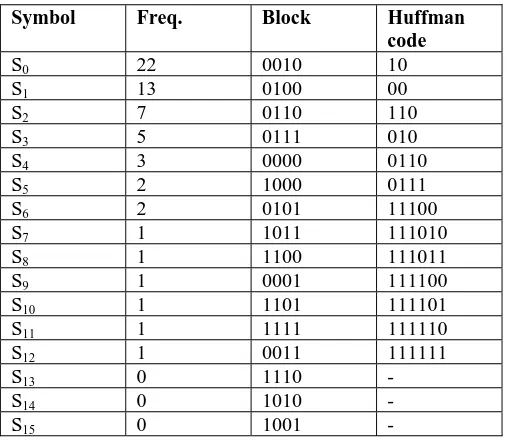
An example of deriving the Huffman code is shown in Fig. 1 . In this example, the test set is divided into 4-bit blocks. Table 1 shows the frequency of occurrence of each of the possible blocks. The compression ratio is determined by how skewed the frequency of occurrence is.
0010 0100 0010 0110 0000 0010 1011 0100 0010 0100 01100010 0010 0100 0010 0110 0000 0110 0010 0100 0110 0010 00100000 0010 0110 0010 0010 0010 0100 0100 0110 0010 0010 10000101 0001 0100 0010 0111 0010 0010 0111 0111 0100 0100 10000101 1100 0100 0100 0111 0010 0010 0111 1101 0010 0100 11110011 Fig. 1. The example test set divided into 4-bit blocks
Table 1. Huffman Coding of the example
Symbol Freq. Block Huffman
code
S0 22 0010 10
S1 13 0100 00
S2 7 0110 110
S3 5 0111 010
S4 3 0000 0110
S5 2 1000 0111
S6 2 0101 11100
S7 1 1011 111010
S8 1 1100 111011
S9 1 0001 111100
S10 1 1101 111101
S11 1 1111 111110
S12 1 0011 111111
S13 0 1110 -
S14 0 1010 -
S15 0 1001 -
In this example, 13 symbols are used to construct the Huffman tree. If two symbols Si and Sj are complementary compatible if the corresponding bits of these two symbols are bit-wise complementary and can be merged as a new symbol Si, j. For example, in Table 1, S1(0100) and S7 (1011) are complementary
compatible.Therefore, they can be merged as a new symbol S1,7.Similarly, S0 (0010) and S10 (1101) are
complementary compatible and can be merged as S0, 10. The merged results of the symbols in Table 1 are shown
size of the Huffman tree can be reduced significantly. Moreover, the skewing of the occurrence probabilities is helpful for the compression of test data. The average length of codewords can also be reduced significantly. This will in turn increase the compression ratio.
Table-2 . Merged symbols of Table-1
Symbol Merged_frequency Pattern
S0,10 23 0010
S1.7 14 0100
S2,15 7 0110
S3,5 7 0111
S4,11 4 0000
S6,14 2 0101
S8,12 2 1100
S9,13 1 0001
ATPG generated test data contains a large amount of don’t care bits. Such don’t care bits in test data can be manipulated to enhance the test data compression. such don’t-care bits that can be assigned with 1’s and 0’s in a way to skew the frequency distribution. This is helpful to maximize the compression efficiency. In this paper we use Hamming distance based don’t care bit filling method.
When all don’t-care bits of unspecified blocks are assigned by Hamming distanced based algorithm, the first bit of each merged block denotes whether the block is complementary merged or not. In this paper we describe complementary encoding methods
Let’s understand this concept with one example
X 0 1 1 1 X X X X 0 1 0 0 1 X X 1 1 0 1 1 1 X X 0 0 0 0 1 0 X X 1 1 0 1 X 1 X X 1 1 0 X 1 1 X X 0 1 0 1 1 0 X X X 0 1 X 1 0 X X
Consider the test data set with total 62 bits shown in Figure 2 Here the block size b=4. To make the last block of size b, at the end of test set two don’t care bits are appended. Here the unique vectors are {10XX, 11XX, 1101, 01XX, X011, 1XXX, 0000, X010, X1XX, 110X, 0101, X01X} with the corresponding frequencies {3, 2, 2, 1, 1, 1, 1, 1, 1, 1, 1, 1}. Starting with B1: 10XX. The Hamming distance of B1 from B2, B3, B4 is 1, 1, 2 respectively but with B5, it is 0. So B1 will be merged with B5. 10XX and X011 will make a merged block 1011 and frequency of this merged block is sum of the individual block i.e. 4. This merged block M1 will be further compared with B6 to B12. B6 and B12 will be merged with M1. After one cycle of merging the merged block 1101 has frequency 6. The next cycle of merging will start with B2 as it is still unmerged. The same process will continue with all unmerged blocks. For given example, the merged symbols are {1011, 1101, 0101, 0000, X010} with corresponding frequencies {6, 6, 2, 1, 1}. The last merged symbol X010 still contains a don’t care bit which will be replaced by 0 and the merged symbol will be 0010.
Example shown in Table -3 blocks 1101 and 0010 are complementary pair. Therefore, they share same symbol S0.and combine frequencies of pair then all symbols are encoded based on conventional Huffman coding
techniques. However one control bit is appended to each codeword .for example, original code is 0for blocks 1101 and 0010.However, a”0” is appended to form the final codeword for block 1101 and an “1” is appended to form the final codeword for block 0010. In the decoding circuitry ,this control bit is used to determine whether the decoded blocks should be complemented or not.
Table-3 Complementary encoding
Symbol Frequency Block Huffman code Final code
S0 7 6 1101 0 00
1 0010 10
S1 6 1011 10 10
S2 2 0101 110 110
Compression ratio find using equation is 43.54%
3.2 On –Chip Decoder Area
In this section discuss on -chip decoder area of Complementary encoding technique. Decoder area overhead is influenced firstly by the nature of the decoder and then by type of input pattern and length of pattern.
Fig. 2. FSM for Complementary coding (control_bit(w),data_in,data_out)
In fig.2 describe fsm for complementary coding. In full Huffman for block size 4 its required 15 states for decoder but in complementary coding its required seven states for decoder so we can reduces area compare to full Huffman decoder. In this we use w for control _bit this bit decide output data is complementary or not which can control output. If w=0 then output data decoded as original and w=1 then output data decoded as complementary
3.3 Test Application Time(TAT)
The test application time includes the time to transfer the encoded test data from ATE to chip as well as the time to decode the codewords of encoded data. The complexity of decoder plays a major role in test application time. If decoder takes a large amount of time to decode the data, even if the compression is very high and data transfer time from ATE to chip is small, decoder consumes a large amount of time then there is not much reduction in TAT.
The TAT analysis for complementary coding is analyzed with respect to the ratio of on chip test frequency and ATE operating frequency. α=fchip/fATE After a complementary encoding is identified α-1 internal clock cycles
from the current ATE cycle can be used to generate the pattern. TAT in terms of ATE clock cycle for each distinct block of size B is given by
For complementary blocks
TATi = Pi (Li +1+1) for ith block, Li≥ B/α
For non –complementary blocks TATi = Pi (Li +1) for ith block, Li≥ B/α
= Pi (B +1)/α for ith block, Li < B/α
Consider similar analysis for full Huffman ,selective and optimal selective Huffman coding TATFull_i = Pi (Li +1) for ith block, Li≥ B/α
= Pi (B +1)/α for ith block, Li < B/α
TATSele_i = Pi (B+(B+1) +1) for ith block is unencoded blocks
= Pi (Li +1) for ith block, Li≥ B/α for coded blocks
= Pi (B +1)/α for ith block, Li < B/α
TATOpt_i = Pi (B+Li +1) for ith block is unencoded blocks but a codeword of size Li is prefixed with it.
= Pi (Li +1) for ith block, Li≥ B/α for coded blocks
= Pi (B +1)/α for ith block, Li < B/α
Where Pi is the occurrence frequency of distinct block and Li is the size of codeword for that distinct block.
The total application time for compressed test data set for total D distinct block is
Similar total test application time for full Huffman ,selective and optimal selective Huffman are calculated using above equation
4. Experimental Results
For any test data compression /decompression methods, there are following test data compression environment parameters need to be considered: Test data compression ,on chip area overhead and test application time. In this section experimental results of complementary encoding methods on widely cited six ISCAS89 full scan benchmark circuits are presented
4.1 Test data compression
The complementary encoding method is implemented using MATLAB 7.6 language. The experiments are conducted on a workstation with a 3.0 GHZ Pentium IV processor and 2 GB of memory . For validation purpose
, six largest ISCAS89 full-scan benchmark circuits are used. The test sets with don’t care obtained from MINTEST ATPG program are used for experiment.The test set is first proposed with don’t care bit filling algorithm and then complementary encoding is applied to test set.
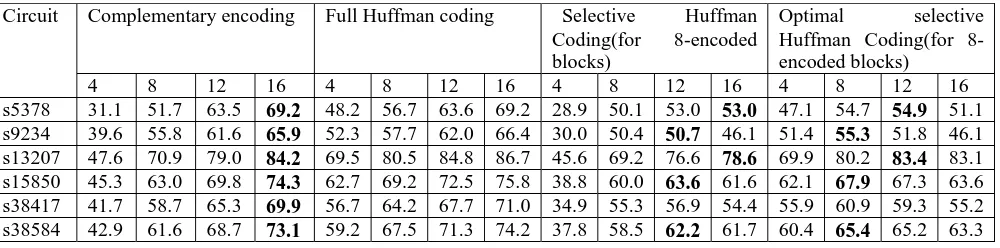
Table -4 shows the % compression for each benchmark circuit test set. In this we describe % compression in case of complementary encoding ,full Huffman ,selective Huffman and optimal selective Huffman. The column 1 shows the name of the circuit and next columns shows the % compression of various block length B like 4,8,12 and 16. The number of distinct block N is taken as 8.The amount of compression obtained is computed using above equation.
The experimental results shown in Table 4 clearly shows that the % compression has increased in complementary encoding methods compare to another methods.
Table-4 Comparison of test data compression for full Huffman, selective Huffman, optimal selective Huffman and complementary encoding
Circuit Complementary encoding Full Huffman coding Selective Huffman Coding(for 8-encoded blocks)
Optimal selective Huffman Coding(for 8-encoded blocks)
4 8 12 16 4 8 12 16 4 8 12 16 4 8 12 16
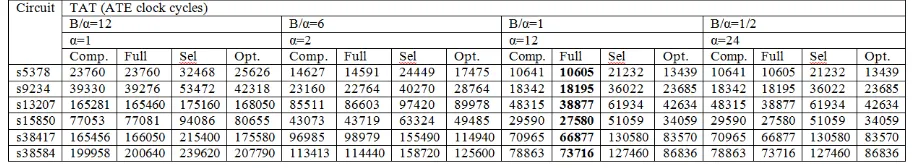
4.2 Test Application Time
In this section describe comparison of the test application time for all methods like Complementary encoding ,full Huffman ,selective Huffman and optimal selective Huffman, simulator was implemented using given equations. Table -5 shows the circuit, compression methods and TAT obtained for four frequencies ratios=1,2,4, 8.The block size B is kept constant(B=8) for each circuit. The number of encoded distinct blocks N is also constant for each circuit(N=8).The frequency ratios are selected to get the range of B/ α from ½( B/ α<1) to 8 (B/ α=1) . In case of α =1 ATE clock and chip test clock has same frequency. Even though the ATE cock will be slower compare to chip test clock but for the worst case consideration ,this ratio has been considered .for B/ α=1 case ,the maximum reduction in TAT is achieved. For any value of B/ α<1, is same as when B/ α=1.
Table-5 Comparison of test application time(TAT) for full Huffman, selective Huffman, optimal selective Huffman and complementary encoding(Block size=8)
4.3 On –Chip Decoder Area
In this section describe comparison of on –chip decoder area of different methods like complementary encoding ,full Huffman ,selective Huffman and optimal Huffman coding.FSM of each methods implemented using VHDL. The EDA tools used are Mentor graphics HDL designer for design entry, Modelsim for simulation and Leonardo spectrum for synthesis.The library used for synthesis is TSMC 0.18u library.The Table 6 shows the comparison in terms of NAND gates ,nets and ports. Total number of equivalent NAND gates are minimum in case of complementary coding compare to full Huffman and maximum compare to selective and optimal selective Huffman
Table 6. Comparison of on-chip area overhead for Complementary encoding ,full Huffman, selective and optimal selective Huffman coding
Complementary encoding
Full Huffman
Selective Huffman
Optimal selective Huffman No.of
NAND gates
432 519 388 389
No.of ports 6 5 5 5
No.of nets 252 215 225 226
Max clock(MHz)
1118.0 972.2 1506.2 1242.4
5. Conclusions
In this paper , we describe complementary encoding techniques for test compression of SOC design. According to experimental results ,on-chip decoder area is reduces compare to full Huffman coding technique.Moreover ,the compression ratio is higher compare to selective and optimal selective Huffman coding,test application time (TAT) is higher compare to full Huffman coding and less compare to selective and optimal Huffman coding References
[1] A.chandra and K.Chakrabarty,”System-on-a-Chip Test-Data Compression and Decompression Architectures Based on Golomb codes”,IEEE Trans. Computer-Aided Design,vol.20,pp.355-368,Mar.2001.
[2] A.chandra and K.Chakrabarty,” A Unified Approach to Reduce SOC Test Data Volume, Scan Power and Testing Time”,IEEE Trans. Computer-Aided Design,vol.22,pp.352-363,Mar.2003.
[3] A.chandra and K.Chakrabarty,” Test Data Compression and Test Resources Partitioning for System-on-a-Chip Using Frequency-Directed Run-Length(FDR) Codes , ”IEEE Trans. Computer-Aided Design,vol.52,no. 8,pp.1076-1088,Aug.2003.
[4] P.TGonciari,B.Al-Hashimi,and N. Nicolici,” Variable –Length Input Huffman Coding for System -on-a –Chip Test”,IEEE Trans. Computer-Aided Design,vol.22,pp.783-796,June.2003.
[5] D.A. Huffman, “A Method for the Construction of Minimum Redundancy Codes,” Proc. IRE, vol. 40, pp. 1098-1101, 1952. [6] V. Iyengar, K. Chakrabarty, and B.T. Murray, “Deterministic Built-In Pattern Generation for Sequential Circuits,” J. Electronic Test:
[8] X. Kavousianos, E. Kalligeros, and D. Nikolos, “Efficient Test-Data Compression for IP Cores Using Multilevel Huffman Coding,” Proc. Design, Automation and Test in Europe Conf. and Exhibition, pp. 1033-1038, Mar. 2006.
[9] X. Kavousianos, E. Kalligeros, and D. Nikolos, “A Parallel Multilevel- Huffman Decompression Scheme for IP Cores with Multiple Scan Chains,” Proc. IEEE European Test Symp. Inf. Papers Digest, pp. 164-169, May 2006.
[10] B. Koenemann, C. Barnhart, B. Keller, T. Snethen, O. Farnsworth, and D. Wheater, “A SmartBIST Variant with Guarantee Encoding,” Proc. 10th Asian Test Symp., pp. 325-330, Nov. 2001.
[11] C.V. Krishna and N.A. Touba, “Reducing Test Data Volume Using LFSR Reseeding with Seed Compression,” Proc. Int’l Test Conf., pp. 321-330, Oct. 2002
[12] A.H. El-Maleh and R.H. Al-Abaji, “Extended Frequency-Directed Run-Length Code with Improved Application to System-on-a-Chip Test Data Compression,” Proc. Ninth Int’l Conf. Electronics, Circuits, and Systems, vol. 2, pp. 449-452, Sept. 2002.
[13] M. Nourani and M.H. Tehranipour, “RL-Huffman Encoding for Test Compression and Power Reduction in Scan Applications,” ACM Trans. Design Automation of Electronic Systems (TODAES), vol. 10, pp. 91-115, Jan.2004.
[14] J. Rajski, J. Tyszer, M. Kassab, and N. Mukherjee, “Embedded Deterministic Test,” IEEE Trans. Computer-Aided Design, vol. 23, pp. 776-792, May 2004.
[15] M. Tehranipour, M. Nourani, K. Arabi, and A. Afzali-Kusha, “Mixed RLHuffman Encoding for Power Reduction and Data Compression in Scan Test,” Proc. Int’l Symp. Circuits and Systems, vol. 2, pp. II-681-4, May 2004.
[16] M. Tehranipour, M. Nourani, and K. Chakrabarty, “Nine-Coded Compression Technique for Testing Embedded Cores in SoCs,” IEEE Trans. VLSI Systems, vol. 13, pp. 719-731, June 2005.
[17] P. Wohl, J.A.Waicukauski, S. Patel, and M.B. Amin, “Efficient Compression and Application of Deterministic Patterns in a Logic BIST Architecture,” Proc. Design Automation Conf., pp. 566-569, June 2003.
[18] X. Kavousianos, E. Kalligeros, and D. Nikolos, “Optimal Selective Huffman Coding for Test-Data Compression” IEEE Transactions on Computers,vol.56, pp. 1146-1152, Aug 2007.
[19] Abhijit Jas ,Jayabrata Ghosh-Dastidar,Mom-Eng Ng,and Nur A.Touba”An Efficient Test Vector Compression Scheme Using Selective Huffman Coding” IEEE Transactions on Computers,vol.22, pp. 797-806, June 2003.