https://doi.org/10.5194/amt-12-5655-2019 © Author(s) 2019. This work is distributed under the Creative Commons Attribution 4.0 License.
Potential of next-generation imaging spectrometers to detect and
quantify methane point sources from space
Daniel H. Cusworth1,3, Daniel J. Jacob1, Daniel J. Varon1,4, Christopher Chan Miller2, Xiong Liu2, Kelly Chance2, Andrew K. Thorpe3, Riley M. Duren3, Charles E. Miller3, David R. Thompson3, Christian Frankenberg3,5, Luis Guanter6, and Cynthia A. Randles7
1School of Engineering and Applied Sciences, Harvard University, Cambridge, MA, USA
2Atomic and Molecular Physics Division, Harvard Smithsonian Center for Astrophysics, Cambridge, MA, USA 3Jet Propulsion Laboratory, California Institute of Technology, Pasadena, CA, USA
4GHGSat, Inc., Montréal, QC H2W 1Y5, Canada
5Division of Geology and Planetary Sciences, California Institute of Technology, Pasadena, CA, USA 6Centro de Tecnologías Físicas, Universitat Politècnica de València, Camí de Vera s/n, 46022 Valencia, Spain 7ExxonMobil Research and Engineering Company, Annandale, NJ, USA
Correspondence:Daniel H. Cusworth ([email protected]) Received: 16 May 2019 – Discussion started: 29 May 2019
Revised: 11 September 2019 – Accepted: 26 September 2019 – Published: 24 October 2019
Abstract. We examine the potential for global detection of methane plumes from individual point sources with the new generation of spaceborne imaging spectrometers (En-MAP, PRISMA, EMIT, SBG, CHIME) scheduled for launch in 2019–2025. These instruments are designed to map the Earth’s surface at high spatial resolution (30 m×30 m) and have a spectral resolution of 7–10 nm in the 2200– 2400 nm band that should also allow useful detection of at-mospheric methane. We simulate scenes viewed by EnMAP (10 nm spectral resolution, 180 signal-to-noise ratio) using the EnMAP end-to-end simulation tool with superimposed methane plumes generated by large-eddy simulations. We re-trieve atmospheric methane and surface reflectivity for these scenes using the IMAP-DOAS optimal estimation algorithm. We find an EnMAP precision of 3 %–7 % for atmospheric methane depending on surface type. This allows effective single-pass detection of methane point sources as small as 100 kg h−1depending on surface brightness, surface homo-geneity, and wind speed. Successful retrievals over very het-erogeneous surfaces such as an urban mosaic require finer spectral resolution. We tested the EnMAP capability with actual plume observations over oil/gas fields in California from the Airborne Visible/Infrared Imaging Spectrometer – Next Generation (AVIRIS-NG) sensor (3 m×3 m pixel reso-lution, 5 nm spectral resoreso-lution, SNR 200–400), by spectrally
and spatially downsampling the AVIRIS-NG data to match EnMAP instrument specifications. Results confirm that En-MAP can successfully detect point sources of∼100 kg h−1 over bright surfaces. Source rates inferred with a generic integrated mass enhancement (IME) algorithm were lower for EnMAP than for AVIRIS-NG. Better agreement may be achieved with a more customized IME algorithm. Our results suggest that imaging spectrometers in space could play an important role in the future for quantifying methane emis-sions from point sources worldwide.
1 Introduction
spectrom-eters) to also detect individual methane plumes in the short-wave infrared (SWIR) and from there to quantify the corre-sponding methane point sources.
There has been considerable interest in using SWIR satel-lite observations of atmospheric methane columns by solar backscatter to detect methane sources and test emission in-ventories (Jacob et al., 2016). These observations are tra-ditionally made by atmospheric sensors with high spectral resolution (< 1 nm) to capture the fine structure of methane rovibrational absorption features (Table 1). The requirement of high spectral resolution has generally forced a coarse pixel resolution (> 1 km) to achieve satisfactory signal-to-noise ra-tios (SNRs), but this limits the ability to identify, locate, and quantify individual point sources. Inverse analyses of obser-vations from the SCIAMACHY instrument with 60 km pixel resolution, and from the Greenhouse Gases Observing Satel-lite (GOSAT) instrument with sparse sampling at 10 km pixel resolution, have quantified emissions over regional scales (Bergamaschi et al., 2009; Kort et al., 2014; Turner et al., 2015). The recently launched TROPOMI instrument with global daily coverage at 7 km nadir pixel resolution (Hu et al., 2018) will refine the regional characterization but still cannot resolve point sources (Sheng et al., 2018). Planned in-struments with∼1 km pixel resolution (MethaneSat, CEOS, 2018; Geo-FTS, Xi et al., 2015) should be able to detect large point sources after inversion of several days of observations (Cusworth et al., 2018; Turner et al., 2018) but would not resolve densely clustered or temporally variable sources.
Space-based methane sensors have previously focused on achieving high precision (< 1 %) and low relative bias (< 0.3 %) for measurements of the dry air column methane mixing ratio (XCH4), as is appropriate for regional character-ization of sources (Buchwitz et al., 2015). However, these requirements can be relaxed if the focus is to observe in-dividual plumes. Precision can be traded for pixel resolu-tion because methane plumes are generally subkilometer in scale (Frankenberg et al., 2016), so that plume enhance-ments are larger when the pixel resolution is finer (Jacob et al., 2016). Bias may not be an issue if the plume enhance-ment is referenced to the local background. Two commercial instruments, GHGSat and Bluefield Technologies, have re-cently been developed to observe individual methane plumes (CEOS, 2018). The GHGSat instrument samples selected 12 km×12 km scenes with 50 m×50 m effective pixel res-olution (McKeever et al., 2017). A demonstration GHGSat instrument (GHGSat-D) launched in 2016, with an estimated precision of about 13 %, has proven able to detect large point sources in excess of 1000 kg h−1(Varon et al., 2018a).
Here we examine the potential of a different class of satel-lite instruments, imaging spectrometers, to detect and quan-tify individual methane point sources. These instruments are designed for global land surface measurements, but they may be repurposed for nonoptimal methane remote sensing. They have fine pixel resolution (< 100 m), with much coarser spec-tral resolution than atmospheric sensors because surface
re-flectance spectra are relatively smooth. Some current im-agers such as Landsat (Roy et al., 2014) and WorldView-3 (http://worldviewWorldView-3.digitalglobe.com, last access: 18 Octo-ber 2019) have observing bands in the SWIR to retrieve soil moisture, mineral composition, and vegetation traits (Cleem-put et al., 2018). However, the SWIR spectral resolutions for Landsat (100 nm) and WorldView-3 (40–50 nm) are too coarse to usefully resolve methane absorption features. The Hyperion instrument on board NASA Earth Observing-1 had a 10 nm spectral resolution in the SWIR but a low signal-to-noise ratio (SNR) of 20 (Folkman et al., 2001). Hyperion was able to detect the massive Aliso Canyon methane blowout (Thompson et al., 2016), but its SNR is too low for detection of smaller point sources.
A new generation of imaging spectrometers set for launch over the next decade (EnMAP, PRISMA, EMIT, and the anticipated SBG and CHIME investigations) will achieve
∼10 nm or better spectral resolution in the SWIR with a pixel resolution in the range 30–60 m and SNR of 180– 400 or beyond (Table 1). Experience with airborne imag-ing spectrometers of comparable specifications suggests that these satellite instruments should be able to observe methane plumes from moderate to large sources. The Air-borne Visible/Infrared Imaging Spectrometer (AVIRIS-C), with a 10 nm spectral resolution and SNR of 70 (Green et al., 1998), was able together with Hyperion to detect the mas-sive Aliso Canyon methane leak in California (Thompson et al., 2016). The next generation AVIRIS instrument (AVIRIS-NG), with a finer spectral resolution of 5 nm and SNR of 200 (Thorpe et al., 2014), was able to detect a range of methane plumes over the Four Corners region of New Mexico, in-cluding from gas-processing facilities, storage tanks, pipeline leaks, well pads, and coal mine venting shafts (Frankenberg et al., 2016). AVIRIS-NG has since been flown over 272000 potential methane-emitting point sources in California be-tween 2016 and 2018 (CARB, 2017; Duren et al., 2019).
2 Imaging spectrometer spectra including methane plumes
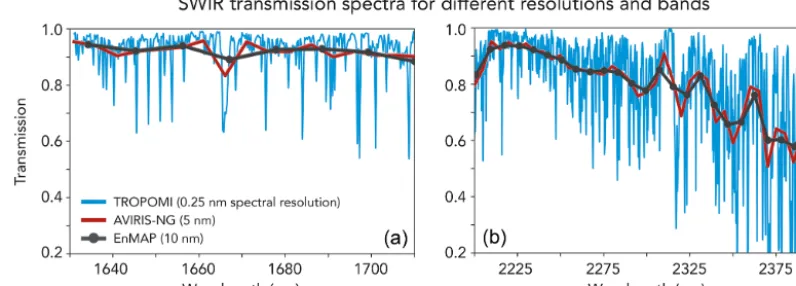
En-Figure 1.Simulated top-of-atmosphere (TOA) transmission spectra for different spectral resolutions (FWHM: full width at half maximum) in the 1650(a)and 2300 nm(b)shortwave infrared (SWIR) bands. High-resolution spectra were simulated for the US Standard Atmosphere with 1800 ppb total column methane using the HITRAN spectroscopic database and the HITRAN Application Programming Interface (HAPI) tool (Kochanov et al., 2016), and they were then sampled with spectral resolutions of 0.25 nm (TROPOMI), 5 nm (AVIRIS-NG), and 10 nm (EnMAP) at the appropriate wavelength positions.
Table 1.Shortwave infrared (SWIR) remote sensors for observing methane point sources.
Instrument Pixel SWIR spectral Spectral Signal-to- Observing size range resolution noise ratio record (km2) (nm)a (nm)b (SNR)c
Aircraft
AVIRIS-NGd 0.003×0.003 1600–1700, 2200–2510 5.0 200–400e Campaigns
Satellite atmospheric sensors
SCIAMACHYf 30×60 1630–1670 1.4 1500 2002–2012 GOSATg 10×10 1630–1700 0.06 300 2009–present GHGSath 0.05×0.05 1600–1700 0.3–0.7i n/aj 2016–present TROPOMIk 7×7 2305–2385 0.25 100 2017–present AMPSl 0.03×0.03 1990–2420 1.0 200–400 Concept
Satellite imaging spectrometers
PRISMAm 0.03×0.03 1600–1700, 2200–2500 10 180 2019–present EnMAPn 0.03×0.03 1600–1700, 2200–2450 10 180 2020 EMITo 0.06×0.06 1600–1700, 2200–2510 7–10 200–300 2022 SBGp 0.03×0.03 1600–1700, 2200–2510 7–10 200–300 2025 CHIMEq 0.03×0.03 1600–1700, 2200–2510 < 10 In 2025
preparation
aMethane has absorption bands around 1650 and 2300 nm (Fig. 1).bSpectral resolution is represented by the full width at half maximum (FWHM).cFor SCIAMACHY and GOSAT, SNR is for the CO2band used in the CO2proxy method retrieval. For other instruments, SNR is at 2300 nm. SNR estimates are for a reference 30◦solar zenith angle and 0.3 surface reflectivity with clear sky.dAirborne
Visible/Infrared Imaging Spectrometer – Next Generation (Thorpe et al., 2017). AVIRIS-NG provides roughly a ground sampling distance (GSD) of 1 m per kilometer altitude. The Frankenberg et al. (2016) and Duren et al. (2019) campaigns operated at 3–4 km altitude. eAlong-track oversampling increases SNR by√N, whereNis the number of along-track frames. AVIRIS-NG typically hasN> 4 so AVIRIS-NG effective SNR at 2300 nm can be as much as 400.fSCanning Imaging Absorption SpectroMeter for Atmospheric
MAP, for which detailed documentation is available (Guan-ter et al., 2015), and examine other instruments through sen-sitivity analyses. EnMAP is a push-broom-style instrument with 10 nm resolution in the SWIR and an expected 180 SNR at 2300 nm. PRISMA has very similar instrument specifica-tions to EnMAP (Loizzo et al., 2018). The EMIT instrument is slated to have a 7–10 nm spectral resolution and 60 m pixel resolution (Green et al., 2018). Other investigations, such as SBG, are called for in the NASA Earth Science and Ap-plications Decadal Survey (National Academies, 2018). The Airborne Methane Plume Spectrometer (AMPS) instrument concept would be tailored specifically for methane detection and have 1 nm SWIR spectral resolution with 30 m pixel res-olution (Thorpe et al., 2016).
Figure 1 shows simulated transmission spectra in the weak (∼1650 nm) and strong (∼2300 nm) SWIR methane absorption bands at the spectral resolutions of TROPOMI (0.25 nm full width at half maximum, FWHM), AVIRIS-NG (5 nm), and EnMAP (10 nm). EnMAP spectra are sampled following the precise wavelength positions given in Guanter et al. (2015). The 1650 nm methane band has the advantage of being near a CO2band, so that joint retrievals of methane
and CO2 can be combined with independent knowledge of
the CO2column mixing ratio to remove joint errors in surface
reflectivity and atmospheric scattering (the so-called “CO2
proxy” method; Frankenberg et al., 2005a). However, the 1650 nm band is much weaker than the 2300 nm band and only the 2ν Qbranch can be detected at the EnMAP spectral resolution. Sampling the transmission spectra at the EnMAP spectral resolution yields only 8 data points in the 1650 nm band as compared to 25 in the 2300 nm band. The 2300 nm band also exhibits more resolved structure. Our early at-tempts to use the CO2 proxy method in the 1650 nm band
with EnMAP synthetic spectra were unsuccessful. In what follows we focus on the 2300 nm band as sampled in the use-ful 2210–2410 nm range.
We examined the sensitivity of EnMAP to atmospheric methane by generating synthetic top-of-atmosphere (TOA) EnMAP scenes with added methane plumes over a vari-ety of surface types. We used for this purpose the EnMAP end-to-end simulation tool (EeteS; Segl, 2012), developed to generate EnMAP TOA solar backscattered spectra with expected instrument error included. EeteS takes surface in-formation from another imaging instrument (e.g., SPOT-5) and passes the image through spatial, atmospheric, spectral, and radiometric modules to generate EnMAP spectra. The atmospheric module is based on the MODTRAN5 radiative transfer code (Berk et al., 2006). It assumes a horizontally invariant 1800 ppbXCH4, and here we add methane plumes simulated with the Weather and Research Forecasting Model large-eddy simulation (WRF-LES) at 30 m×30 m resolution (Varon et al., 2018b).
Figure 2 shows a simulated red–blue–green (RBG) EeteS image over Berlin. We consider four scenes within this do-main to add WRF-LES methane plumes and perform
subse-quent retrievals. The scenes are labeled asgrass,dark (wa-ter),bright, andurban. They have mean SWIR surface re-flectances of 0.09, 0.02, 0.30, and 0.13, respectively. The ur-ban scene is highly heterogeneous. The WRF-LES simula-tion is conducted with 30 m×30 m resolution (the EnMAP pixel resolution), 100 W m−2sensible heat flux (moderately unstable meteorological conditions), and a mean wind speed of 3.5 m s−1. We generate an ensemble of 15 instantaneous plumes by sampling the WRF-LES simulation at five time slices and for three source rates of 100, 500, and 900 kg h−1. This range is typical of large (but not unusually large) indi-vidual point sources (Jacob et al., 2016).
We compute the optical depth of the methane plumeτ (λ) at wavelengthλ by multiplying HITRAN absorption cross sections (σH; Kochanov et al., 2016) by the methane
vol-ume mixing ratio enhancement (1VMR) and vertical column density of dry air (VCD) in the 72-layered atmosphere of the MERRA-2 meteorological reanalysis (Gelaro et al., 2017):
τ (λ)= 72
X
i=1
1VMRiVCDiσH,i(λ) . (1)
Following Beer’s law, the plume transmissionT (λ) is the negative exponential ofτ (λ)weighted by the geometric air mass factorA(AMF) for the backscattered solar radiation:
T (λ)=exp{−Aτ (λ)}. (2)
Each pixel’s EeteS radiance spectrum is multiplied by this additional plume transmission. We do not add noise or aerosol effects to the plume transmission spectra because the EeteS scene already accounts for those in the computation of back-scattered radiances, so that multiplying by the addi-tional plume transmission already factors in the correspond-ing noise. Figure 3 shows an example WRF-LES plume (500 kg h−1source rate) superimposed over the grass and ur-ban scenes.
We extended our analysis to other new-generation imag-ing spectrometers of Table 1 by adaptimag-ing the EnMAP scenes to different spectral resolutions and SNRs. For this purpose, we interpolated EeteS surface radiance spectra to the desired spectral resolution assuming no instrument noise. We then multiplied these radiance spectra by the transmission spec-tra from the US Standard Atmosphere (Kneizys et al., 1996) with WRF-LES methane plumes added. The SNR values in Table 1 are for a specific reference solar zenith angle (30◦) and reflectivity (0.3), but the EeteS radiometric module pro-duces different noise estimates over different surfaces. Here we took the ratios of SNR values relative to EnMAP from Table 1 and applied these ratios to the EeteS noise fields.
and wavelength positions (Guanter et al., 2015). AVIRIS-NG flew at 3–4 km above the ground, so we simulated ad-ditional extinction at higher altitudes based on the US Stan-dard Atmosphere. We compared the retrieved methane from AVIRIS-NG and the synthetic EnMAP to determine the abil-ity of EnMAP to detect and quantify the methane point sources identified by AVIRIS-NG.
3 Methane retrieval
We retrieved methane from the synthetic imaging spectrom-eter spectra by adapting the iterative maximum a posteriori differential optical absorption spectroscopy (IMAP-DOAS) algorithm developed for AVIRIS (Frankenberg et al., 2005b; Thorpe et al., 2017; Ayasse et al., 2018). DOAS retrievals isolate higher-frequency features resulting from gas absorp-tion from lower-frequency features that include surface re-flectance as well as Rayleigh and Mie scattering (Bovens-mann et al., 2011). A polynomial term accounts for the low-frequency features (Thorpe et al., 2017).
3.1 State vector
In addition to methane (CH4), the retrieval must account for
variable absorption by water vapor (H2O) and nitrous oxide
(N2O) over the 2210–2400 nm spectral region. We
parame-terize low-frequency spectroscopic features as a sum of Leg-endre polynomials of orderk=[0,K] with coefficientsak. The state vector (x) optimized through the retrieval is com-posed of the following elements:
x= sCH4, sH2O, sN2O, a0, . . ., aK
,
wheresis a scaling factor applied to the column mixing ratio of each gas from the US Standard Atmosphere. We also cor-rect for uncertainty in the instrument’s wavelength calibra-tion with a spectral shift parameter, which has been shown in previous studies to reduce wavelength position uncertainty (Thorpe et al., 2017; Frankenberg et al., 2005b). EnMAP has strict requirements of 1 nm spectral calibration accuracy and 0.5 nm spectral stability in the SWIR. Preflight calibration campaigns as well as onboard calibration means will be used to ensure the compliance with those requirements (Guanter et al., 2015). Additional uncaptured uncertainty in spectral shift may worsen retrievedXCH4. However, given the strong absorption features across the strong 2300 nm CH4band, we
expect this effect to be small compared other low-frequency features and do not explore this effect further. We do not in-clude aerosols in the retrieval as they play little role at the relevant spatial and spectral resolution (Ayasse et al., 2018). Methane point sources generally do not coemit aerosols.
3.2 Optimal estimation
To retrieve the state vector from the EeteS TOA radiances, we use a forward model similar to previous IMAP-DOAS algorithms (Thorpe et al., 2017; Ayasse et al., 2018), with a modification to the polynomial term for surface reflectance:
Fh(x)=I0(λ)exp −A 3
X
n=1
sn
72
X
l=1
τn,l ! K
X
k=0
akPk(λ). (3)
HereFhis the high-resolution backscattered TOA radiance at wavelengthλ,I0is the incident TOA solar intensity,τn,lis the default optical depth from the US Standard Atmosphere for trace gas elementn=[1,3] of the state vector at vertical levell=[1,72],sn is the scaling factor to that default opti-cal depth optimized in the retrieval,Pk is thekth Legendre polynomial, and the ak represent coefficients optimized in the retrieval. The optical depthτn,lis computed in the same fashion as Eq. (1), using information from the MERRA-2 reanalysis and HITRAN absorption cross sections. For satel-lite retrievals, the AMF is a scalar describing the optical path through the atmosphere. In Sect. 4.3, we apply the IMAP-DOAS algorithm to airborne AVIRIS-NG scenes and use a vector-valued AMF that depends on the height of the aircraft. Previous IMAP-DOAS algorithms used a simple polyno-mial approximation for the surface reflectance, but here we use Legendre polynomials to exploit their orthogonality. Or-thogonal polynomials can potentially constrain surface re-flectance with fewer terms, leading to better conditioning of the inverse solution. We find thatK=4 provides sufficient spectral resolution, whereas previous applications using sim-ple polynomials requiredK=6 (Ayasse et al., 2018).
We compute the TOA backscattered radiancesFh(x) over the 2210–2410 nm spectral range at 0.02 nm resolution and assemble these in a vector Fh(x) representing the high-resolution spectrum as simulated by the forward model for a givenx. We convolve this spectrum with the instrument FWHM and then sample at the known wavelength positions. For example, for EnMAP, we convolveFh(x)with a 10 nm FWHM and sample the resulting spectra at EnMAP’s 10 nm intervals to get the low-resolutionF (x). Since the convolu-tion operator is not linear (Frankenberg et al., 2005b), we also explored performing separate convolutions on the high resolution transmission and polynomial terms in Eq. (3) and then multiplying them together to getF (x). We found little difference in the results between methods.
Observed backscattered TOA radiances (y) can be repre-sented as
y=F(x)+, (4)
The forward model is nonlinear so that the solution must be obtained iteratively. A Jacobian matrix is calculated for each iterationiof the state vector
Ki= ∂F
∂x
x=x
i
, (5)
and we employ a Gauss–Newton iteration to solve iteratively for the optimal state vector (Rodgers, 2000):
xi+1=xA+
KTi S−O1Ki+S−A1 −1
KTi S−O1
y−F(xi)+Ki(xi−xA)
. (6)
HereSO=[εεT] is the observation error covariance matrix
defined by the instrument SNR,xA is the prior estimate of the state vector, andSAis the prior error covariance matrix. We set a weak prior error variance for methane (unitless):
ˆ
S=KTi SO−1Ki+S−A1 −1
. (7)
ˆ
S gives information on the error correlation between re-trieved methane and surface reflectivity, which is a major concern for methane retrievals (Butz et al., 2012).
3.3 Inferring point source rates from methane plume observations
The plume observations can be related to the corresponding source rates by computing the integrated mass enhancements (IMEs) within the plume mask (Frankenberg et al., 2016; Varon et al., 2018b). Following Varon et al. (2018b), we de-fine the plume for the retrieved scenes with a plume mask that applies median and Gaussian filters to pixels above the 80th percentile ofXCH4within the scene. These filters help to remove spurious signals surrounding a plume and determine the spatial extent of the plume, which is needed for subse-quent calculations. The IME is calculated as
IME=XN
i=11i3i, (8)
where1i is the plume mass enhancement in pixel i rel-ative to background (kg m−2),3i is the corresponding area of the pixel, and the summation is over theN pixels within the plume mask. Here, we define the background as the me-dianXCH4 within the scene. The point source rateQis then inferred from the IME as (Varon et al., 2018b)
Q=Ueff
L IME, (9)
whereL=
q PN
i=13i is a characteristic plume size andUeff
is an effective wind speed describing the rate of turbulent dissipation of the plume (L/Ueffis the lifetime of the plume
against turbulent dissipation to below the detection limit). Varon et al. (2018b) relateUeffto the 10 m wind speed (U10)
by fitting to WRF-LES simulations. Here we use their rela-tionship derived for the GHGSat instrument with 50 m pixel resolution and 5 % precision:
Ueff=1.1 logU10+0.6, (10)
whereUeffandU10are in units of meters per second (m s−1).
TheUeff–U10 relationship should depend on the instrument
pixel resolution and precision, and on the plume masking procedure, which would require customized WRF-LES sim-ulations and fitting. Here we simply apply Eq. (10) to the AVIRIS-NG and EnMAP plumes without further modifica-tion. In Sect. 4.3, we do not a priori know the wind speed, and we obtainU10from the HRRR-Reanalysis at 3 km hourly
resolution (https://rapidrefresh.noaa.gov/, Benjamin et al., 2016).
4 Results and discussion
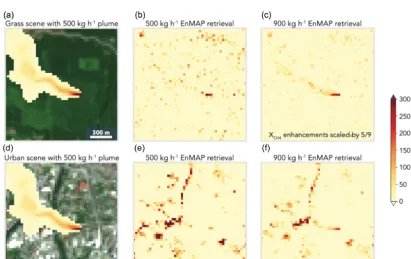
4.1 EnMAP plume retrievals over different surfaces Figure 3 shows examples of the IMAP-DOAS retrievals of 500 and 900 kg h−1WRF-LES plumes over the grass and ur-ban scenes. The 500 kg h−1plume is clearly defined in the grass scene near the emission source. It is also detectable in the urban scene but obscured by retrieval artifacts, as some of the variability in surface reflectivity is erroneously retrieved as methane variability. The 900 kg h−1plume is better cap-tured over both surfaces, though major retrieval artifacts re-main in the urban scene.
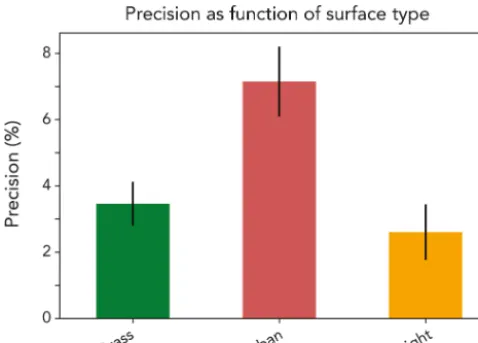
Varon et al. (2018b) previously estimated the theoretical ability of a satellite instrument to quantify source rates from point sources as a function of instrument precision, assum-ing a uniform surface reflectance. They concluded that an in-strument with 1 %–5 % precision forXCH4 would be able to quantify point sources with an error of 70–170 kg h−1. Here we characterize the EnMAP instrument precision as the rel-ative residual standard deviation (RRSD) between the true and retrieved column methane concentrations for individual 30 m×30 m pixels in the scenes of Fig. 2 including the WRF-LES plumes. Figure 4 summarizes the results for the four scenes of Fig. 2. We find precisions of 3.5±0.07 % for grass, 7.2±0.1 % for urban, and 2.6±0.08 % for bright scenes. The standard deviations refer to the RRSDs computed for the 15 different realizations of the WRF-LES plumes and for the 3 source rates of 100, 500, and 900 kg h−1. The dark scene was consistently unsuccessful, with error of at least 100 % for each realization, and we do not discuss it further. The bright scene performs the best because of the large backscattered photon flux. The urban scene performs worse than the grass scene, even though its average SWIR surface reflectance is larger, due to the larger variability in reflectance over the scene including dark pixels.
Figure 2.RGB image of a synthetic EnMAP scene simulated using the EnMAP end-to-end simulation tool (EeteS) over Berlin. Four scenes with 30 m×30 m pixel resolution are shown (grass, dark, bright, urban) with average surface reflectances in the SWIR (2210–2410 nm) given in parentheses. These different scenes are used in Sect. 3 to evaluate the ability of EnMAP to retrieve atmospheric methane plumes.
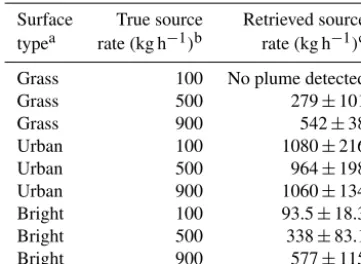
Table 2.True and retrieved point source rates from EnMAP scene simulations with WRF-LES methane plumes.
Surface True source Retrieved source typea rate (kg h−1)b rate (kg h−1)c
Grass 100 No plume detected Grass 500 279±101 Grass 900 542±38 Urban 100 1080±216 Urban 500 964±198 Urban 900 1060±134 Bright 100 93.5±18.3 Bright 500 338±83.1 Bright 900 577±115
aSurface reflectances determined using the end-to-end simulation tool (EeteS; Fig. 2).bPrescribed in the WRF-LES methane plume simulations (Sect. 2).cMean and standard deviation of retrieved source rates for five WRF-LES plume realizations.
plumes, by applying the IME algorithm of Sect. 3.3 to the same ensemble of five WRF-LES plume realizations for each of the three different surfaces and for true source rates 100, 500, and 900 kg h−1. Results are summarized in Table 2. We find that it is possible to quantify source rates as low as 100 kg h−1for the bright scene and as low as 500 kg h−1for the grass scene, though the true source rates are underesti-mated by up to a factor of 2. There could be several fac-tors behind this underestimate, including (1) error correlation with surface reflectivity in the EnMAP retrieval that would cause some loss of the plume and (2) use of the Varon et al. (2018b) Ueff–U10 relationship in Eq. (10) without
cus-tomization for the EnMAP conditions. As pointed out by Varon et al. (2018b), theUeff–U10relationship should be
cus-tomized to the plume mask definition and to the instrument pixel resolution and precision. This would require an ensem-ble of WRF-LES simulations specific to the EnMAP condi-tions and to the plume mask used here. The inability to quan-tify the 100 kg h−1 plume over the grass scene is properly diagnosed in our retrieval by the failure of the plume mask to detect a plume. However, the surface artifacts in the urban scene lead to spurious retrievals of source rates as the sur-face features are mistakenly attributed to plumes. This is due to the error correlation betweenXCH4and surface reflectivity (explained in greater detail in Sect. 4.2) and can be diagnosed by inspection of the off-diagonal terms ofSˆ(Eq. 7).
4.2 Sensitivity to instrument spectral resolution and SNR
We examine the potential of future imaging spectrome-ters with improved spectral resolution and SNR relative to EnMAP (Table 1) to achieve improved retrievals of point sources. Figure 5 shows the change in the methane retrieval precision as we vary the spectral resolution from 10 to 1 nm and the mean scene-wide SNR from 100 to 500.
Specifica-tions of the instruments in Table 1 are identified on the plot. Precision improves as spectral resolution and SNR increase, as expected. The dependencies are not linear, and the con-tours are concave, meaning that precision is more effectively improved by increasing spectral resolution by a certain factor than by increasing SNR by the same factor. Increasing the spectral resolution improves precision through multiple in-dependent factors: by increasing the number of inin-dependent measurements across the useful spectral window; by increas-ing the effective squared depth of the sharpest methane ab-sorptions, for improved spectral contrast relative to the con-tinuum; and by better resolution of the unique methane ab-sorption shape, which improves discrimination against po-tential surface confusers.
We saw in Fig. 3 that the inability to decouple surface and methane features at low spectral resolution was a ma-jor source of error over inhomogeneous surfaces such as the urban scene. This is manifested in the retrieval by an error correlation between state vector elementssCH4 (scaling fac-tor for methane column mixing ratios) andak (coefficients for the surface reflectivity described by Legendre polyno-mials). This error correlation is described by the posterior error covariance matrix Sˆ obtained as part of the retrieval (Eq. 7). The bivariate probability density between retrieved XCH4 and the mean SWIR surface reflectivity can be ob-tained by summing the error covariances of the Legendre polynomial terms. We find in this manner that the error corre-lation betweenXCH4and the mean SWIR surface reflectivity for the urban scene decreases between EnMAP (r= −0.33) and AMPS (r= −0.19). This is driven by the increase in spectral resolution from 10 to 1 nm. We further find that sim-ply increasing the SNR to 300 (as recommended for SBG) while keeping spectral resolution constant does not improve the error correlation.
Figure 4.Precision of atmospheric methane retrievals from the En-MAP instrument (Table 1) over the grass, urban, and bright surfaces of Fig. 2. Precision is defined as the relative residual standard devia-tion (RRSD) between the true methane columns in synthetic scenes and values obtained from the IMAP-DOAS retrieval applied to the EnMAP top-of-atmosphere (TOA) backscattered radiances. The er-ror bars represent the standard deviation over 15 WRF-LES plume realizations and three source magnitudes for the plume (100, 500, 900 kg h−1). Precision over the dark surface in Fig. 2 is worse than 100 %.
4.3 Evaluation with AVIRIS-NG observations
To test the EnMAP retrieval capability with actual observa-tions, we downsampled AVIRIS-NG airborne spectra taken over California methane-emitting facilities (CARB, 2017). We chose three scenes observed by AVIRIS-NG on differ-ent days over oil and gas facilities. Figure 7 shows the RGB images, the AVIRIS-NG plume retrievals performed by ap-plying the method of Sect. 3 with a variable AMF, and the downsampled EnMAP retrievals. Plume masks were applied as described in Sect. 3.3 and shown in Fig. 6. At the altitudes used for the California survey, AVIRIS-NG has a 3 m×3 m pixel resolution and hence features much sharper methane enhancements than EnMAP (note the different scales for the middle and right panels). Nevertheless, we see from Fig. 7 that EnMAP is able to detect the same plumes as AVIRIS-NG (two plumes in the bottom panels). This is facilitated by the brightness of the surfaces. The surface reflectivities retrieved simultaneously with the methane enhancements in our IMAP-DOAS algorithm are 0.39–0.49, which is brighter than the bright EeteS scene in Sect. 4.1.
Figure 7 shows the source rates inferred from the AVIRIS-NG and EnMAP retrievals for each point source. The AVIRIS-NG source rates are a factor of 1.2–3.0 greater (av-erage 1.9) than the EnMAP source rates. The EnMAP un-derestimate is consistent with the results in Table 2 and may reflect the same sources of bias, in part correctable through an improvedU10–Ueff relationship. The results confirm that
Figure 5. Precision of methane retrievals for spaceborne imag-ing spectrometers observimag-ing in the SWIR (2210–2400 nm), as a function of instrument signal-to-noise (SNR) and full-width-at-half-maximum (FWHM) spectral resolution. The SNR values are for a reference 30◦ solar zenith angle and 0.3 surface reflectivity with clear sky, same as in Table 1. Actual SNR for individual pixels may vary, depending in particular on surface reflectivity. Precision is expressed as the relative residual standard deviation (RRSD) of the difference between retrieved and true methane columns over three synthetic scenes of Fig. 2 (grass, urban, bright) including point sources of 100–900 kg h−1and for 15 different WRF-LES plume realizations. Black dots show different instrument specifi-cations from Table 1. Specifispecifi-cations for the SBG and AMPS in-struments are still at the design stage, and values shown here are for the ranges under consideration. Results given for AVIRIS-NG are for a satellite instrument with 30 m×30 m pixel resolution but other specifications (spectral resolution, SNR) same as the airborne instrument.
EnMAP should be able to detect plumes and estimate source rates down to∼100 kg h−1 when the scene is sufficiently bright.
5 Conclusions
Figure 6.Plume pattern recognition algorithm applied to a point source of 500 kg h−1over grass and urban scenes as shown in Fig. 3. The plume pattern is defined by applying median and Gaussian filters to pixels above the 80th percentile ofXCH4 in the scene. Areas excluded by the mask are shown in gray. The panels show retrievals from the EnMAP, SBG, and AMPS instruments.
We focused our baseline analysis on EnMAP (spectral res-olution 10 nm, SNR 180, 2020 launch date) as its specifica-tions are well documented (Guanter et al, 2015). We created synthetic spectra using the EnMAP end-to-end simulation tool (EeteS) to simulate various surface scenes (grass, ur-ban, bright) with instrument errors and with superimposed methane plumes generated by a WRF large-eddy simula-tion (LES). We then retrieved these scenes for atmospheric methane together with surface reflectivities (fitted with Leg-endre polynomials) using the iterative maximum a posteriori differential optical absorption spectroscopy (IMAP-DOAS) approach. The resulting precisions for methane are 3.5 % for the grass scene, 7.2 % for urban, and 2.6 % for bright. A 500 kg h−1 methane plume (typical of very large point
sources) is readily detected over the relatively homogeneous grass surface. The highly heterogeneous urban surface is much more challenging because of retrieval artifacts.
The limitation of EnMAP in detecting methane plumes over heterogeneous surfaces is caused by error correlation between methane and surface reflectivity in the retrieval. We examined how precision and error correlation could be improved by increasing spectral resolution and SNR. We find that increasing spectral resolution reduces the error cor-relation more efficiently than increasing SNR by enabling
separation of fine spectral structure (methane) from coarse spectral structure (surface). The Airborne Methane Plume Spectrometer (AMPS) instrument concept, which bridges the gap between imaging spectrometers and spaceborne methane sensors (1 nm spectral resolution, SNR 400), can greatly de-crease surface artifacts and detect a 500 kg h−1plume even over the heterogeneous urban surface. Alternative retrieval parameterizations might also improve separation of methane and surface reflectivity features (Thompson et al., 2018; Ong et al., 2019).
Figure 7. Retrieval of atmospheric methane plumes from facilities in the San Joaquin Valley of California imaged by the AVIRIS-NG instrument at 3–4 km altitude (CARB, 2017).(a),(d), and(g)show the RGB images mapped by AVIRIS-NG with the oil/gas facilities of interest circled. Inset in the bottom left corner is the mean retrieved SWIR surface reflectivity for the scene.(b),(e), and(h)show the IMAP-DOAS retrieval applied to the AVIRIS-NG images with 3 m×3 m pixel resolution and 5 nm spectral resolution.(c),(f), and(i)show the IMAP-DOAS retrieval applied to spectra that were spatially and spectrally downsampled to match EnMAP instrument specifications (30 m×30 m pixels, 10 nm spectral resolution). Note the difference in color scale for the methane enhancements in the AVIRIS-NG and EnMAP retrievals, reflecting the coarser pixel resolution of EnMAP. The plume mask described in the text is overlaid on each. The source rates for each plume obtained from the IME method are inset.
In summary, our analysis shows that future spaceborne imaging spectrometers designed to map land surfaces in the SWIR also have potential for detecting methane plumes from point sources and quantifying source rates. The detection ca-pability of 100–500 kg h−1over relatively bright and homo-geneous land surfaces would allow accounting for a wide range of point sources. The fine spatial resolution of these in-struments should make them a unique resource to contribute to tiered observing systems for greenhouse gases (Duren and Miller, 2012).
Data availability. Example EeteS scenes are available at http:// www.enmap.org/node/21.html (Segl et al., 2012). WRF-LES simu-lations are available upon request. HITRAN absorption cross sec-tions are available at https://hitran.org/hapi/ (Kochannev et al., 2016). AVIRIS-NG raw radiances are available at https://avirisng. jpl.nasa.gov/alt_locator/ (Gao et al., 1993). MERRA-2 reanaly-sis is available at https://gmao.gsfc.nasa.gov/reanalyreanaly-sis/MERRA-2/ (Gelaro et al., 2017).
radiative transfer simulations. AKT and CF helped with the de-velopment of the IMAP-DOAS retrieval. AKT, RMD, CEM, and DRT provided guidance on the AVIRIS-NG instrument, campaigns, and retrieval. LG provided EeteS simulations. All authors provided comments to the manuscript.
Competing interests. The authors declare that they have no conflict of interest.
Acknowledgements. Portions of this work were undertaken at the Jet Propulsion Laboratory, California Institute of Technology, under contract with NASA.
Financial support. This work was supported in part by the Exxon-Mobil Research and Engineering Company and NASA’s Carbon Monitoring System (CMS) Prototype Methane Monitoring Sys-tem for California. Data from the California Methane Survey was supported by NASA’s Earth Science Division and the California Air Resources Board under ARB–NASA agreement 15RD028 and Space Act agreement 82-19863 as well as the California Energy Commission under CEC-500-15-004.
Review statement. This paper was edited by Dominik Brunner and reviewed by Gerrit Kuhlmann and one anonymous referee.
References
Allen, D. T., Torres, V. M., Thomas, J., Sullivan, D. W., Harrison, M., Hendler, A., Herndon, S. C., Kolb, C. E., Fraser, M. P., Hill, A. D., Lamb, B. K., Miskimins, J., Sawyer, R. F., and Seinfeld, J. H.: Measurements of methane emissions at natural gas pro-duction sites in the United States, P. Natl. Acad. Sci. USA, 110, 17768–17773, https://doi.org/10.1073/pnas.1304880110, 2013. Ayasse, A. K., Thorpe, A. K., Roberts, D. A., Funk, C. C.,
Den-nison, P. E., Frankenberg, C., Steffke, A., and Aubrey, A. D.: Evaluating the effects of surface properties on methane retrievals using a synthetic airborne visible/infrared imaging spectrome-ter next generation (AVIRIS-NG) image, Remote Sens. Environ., 215, 386–397, https://doi.org/10.1016/j.rse.2018.06.018, 2018. Benjamin, S. G., Weygandt, S. S., Brown, J. M., Hu, M.,
Alexan-der, C. R., Smirnova, T. G., Olson, J. B., James, E. P., Dow-ell, D. C., GrDow-ell, G. A., Lin, H., Peckham, S. E., Smith, T. L., Moninger, W. R., Kenyon, J. S., and Manikin, G. S.: A North American Hourly Assimilation and Model Forecast Cy-cle: The Rapid Refresh, Mon. Weather Rev., 144, 1669–1694, https://doi.org/10.1175/MWR-D-15-0242.1, 2016.
Bergamaschi, P., Frankenberg, C., Meirink, J. F., Krol, M., Vil-lani, M. G., Houweling, S., Dentener, F., Dlugokencky, E. J., Miller, J. B., Gatti, L. V., Engel, A., and Levin, I.: In-verse modeling of global and regional CH4 emissions using
SCIAMACHY satellite retrievals, J. Geophys. Res.-Atmos., 114, https://doi.org/10.1029/2009JD012287, 2009.
Berk, A., Anderson, G. P., Acharya, P. K., Bernstein, L. S., Mura-tov, L., Lee, J., Fox, M., Adler-Golden, S. M., Chetwynd Jr, J. H., Hoke, M. L., Lockwood, R. B., Gardner, J. A., Cooley, T. W., Borel, C. C., Lewis, P. E., and Shettle, E. P.: MODTRAN5: 2006 update, in: Algorithms and Technologies for Multispectral, Hyperspectral, and Ultraspectral Imagery XII, Vol. 6233, Inter-national Society for Optics and Photonics, 508–515, 2006. Bovensmann, H., Doicu, A., Stammes, P., Van Roozendael, M., Von
Savigny, C., de Vries, M. P., Beirle, S., Wagner, T., Chance, K., Buchwitz, M., Kokhanovsky, A., Richter, A., Rozanov, A. V., and Rozanov, V. V.: From Radiation Fields to Atmo-spheric Concentrations–Retrieval of Geophysical Parameters, in: SCIAMACHY-Exploring the Changing Earth’s Atmosphere, Springer, 99–127, 2011.
Buchwitz, M., Reuter, M., Schneising, O., Boesch, H., Guerlet, S., Dils, B., Aben, I., Armante, R., Bergamaschi, P., Blumen-stock, T., Bovensmann, H., Brunner, D., Buchmann, B., Bur-rows, J., Butz, A., Chédin, A., Chevallier, F., Crevoisier, C., Deutscher, N., Frankenberg, C., Hase, F., Hasekamp, O., Hey-mann, J., Kaminski, T., Laeng, A., Lichtenberg, G., Mazière, M. D., Noël, S., Notholt, J., Orphal, J., Popp, C., Parker, R., Scholze, M., Sussmann, R., Stiller, G., Warneke, T., Zehner, C., Bril, A., Crisp, D., Griffith, D., Kuze, A., O’Dell, C., Os-hchepkov, S., Sherlock, V., Suto, H., Wennberg, P., Wunch, D., Yokota, T., and Yoshida, Y.: The Greenhouse Gas Cli-mate Change Initiative (GHG-CCI): Comparison and quality assessment of near-surface-sensitive satellite-derived CO2 and
CH4 global data sets, Remote Sens. Environ., 162, 344–362, https://doi.org/10.1016/j.rse.2013.04.024, 2015.
Butz, A., Galli, A., Hasekamp, O., Landgraf, J., Tol, P., and Aben, I.: TROPOMI aboard Sentinel-5 Precursor: Prospec-tive performance of CH4 retrievals for aerosol and cirrus
loaded atmospheres, Remote Sens. Environ., 120, 267–276, https://doi.org/10.1016/j.rse.2011.05.030, 2012.
CARB: Introduction to the Phase I Report of the California Methane Survey from the Staff of the California Air Resources Board (CARB), Tech. Rep., The California Air Resources Board, 2017. CEOS: A Constellation Architecture for Monitoring Carbon Dioxide and Methane from Space, Tech. Rep., University of Zurich, Department of Informatics, available at: http://ceos. org/document_management/Meetings/Plenary/32/documents/ CEOS_AC-VC_White_Paper_Version_1_20181009.pdf (last access: 18 October 2019), 2018.
Cleemput, E. V., Vanierschot, L., Fernández-Castilla, B., Honnay, O., and Somers, B.: The functional characterization of grass-and shrublgrass-and ecosystems using hyperspectral remote sensing: trends, accuracy and moderating variables, Remote Sens. En-viron., 209, 747–763, https://doi.org/10.1016/j.rse.2018.02.030, 2018.
Cusworth, D. H., Jacob, D. J., Sheng, J.-X., Benmergui, J., Turner, A. J., Brandman, J., White, L., and Randles, C. A.: De-tecting high-emitting methane sources in oil/gas fields using satellite observations, Atmos. Chem. Phys., 18, 16885–16896, https://doi.org/10.5194/acp-18-16885-2018, 2018.
Duren, R. M. and Miller, C. E.: Measuring the carbon emissions of megacities, Nat. Clim. Change, 2, 560–562, 2012.
M. L., Falk, M., Herner, J., Croes, B. E., Green, R. O., and Miller, C. M.: California’s Methane Super-emitters, Nature, 575, https://doi.org/10.1038/s41586-019-1720-3, 2019.
Folkman, M. A., Pearlman, J., Liao, L. B., and Jarecke, P. J.: EO-1/Hyperion hyperspectral imager design, development, charac-terization, and calibration, in: Hyperspectral Remote Sensing of the Land and Atmosphere, Vol. 4151, International Society for Optics and Photonics, 40–52, 2001.
Frankenberg, C., Meirink, J. F., van Weele, M., Platt, U., and Wagner, T.: Assessing Methane Emissions from Global Space-Borne Observations, Science, 308, 1010–1014, https://doi.org/10.1126/science.1106644, 2005a.
Frankenberg, C., Platt, U., and Wagner, T.: Iterative maximum a posteriori (IMAP)-DOAS for retrieval of strongly absorb-ing trace gases: Model studies for CH4 and CO2 retrieval
from near infrared spectra of SCIAMACHY onboard ENVISAT, Atmos. Chem. Phys., 5, 9–22, https://doi.org/10.5194/acp-5-9-2005, 2005b.
Frankenberg, C., Meirink, J., Bergamaschi, P., Goede, A., Heimann, M., Körner, S., Platt, U., van Weele, M., and Wagner, T.: Satel-lite chartography of atmospheric methane from SCIAMACHY on board ENVISAT: Analysis of the years 2003 and 2004, J. Geo-phys. Res.-Atmos., 111, https://doi.org/10.1029/2006JD007268, 2006.
Frankenberg, C., Thorpe, A. K., Thompson, D. R., Hulley, G., Kort, E. A., Vance, N., Borchardt, J., Krings, T., Ger-ilowski, K., Sweeney, C., Conley, S., Bue, B. D., Aubrey, A. D., Hook, S., and Green, R. O.: Airborne methane re-mote measurements reveal heavy-tail flux distribution in Four Corners region, P. Natl. Acad. Sci. USA, 113, 9734–9739, https://doi.org/10.1073/pnas.1605617113, 2016.
Gao, B. C., Heidebrecht, K. H., and Goetz, A. F. H.: Derivation of scaled surface reflectances from AVIRIS data, available at: https: //avirisng.jpl.nasa.gov/alt_locator (last access: 18 October 2019) Remote Sens. Env., 44, 165–178, 1993.
Gelaro, R., McCarty, W., Suárez, M. J., Todling, R., Molod, A., Takacs, L., Randles, C. A., Darmenov, A., Bosilovich, M. G., Re-ichle, R., Wargan, K., Coy, L., Cullather, R., Draper, C., Akella, S., Buchard, V., Conaty, A., da Silva, A. M., Gu, W., Kim, G.-K., Koster, R., Lucchesi, R., Merkova, D., Nielsen, J. E., Par-tyka, G., Pawson, S., Putman, W., Rienecker, M., Schubert, S. D., Sienkiewicz, M., and Zhao, B.: The Modern-Era Retrospective Analysis for Research and Applications, Version 2 (MERRA-2), J. Clim., 30, 5419–5454, https://doi.org/10.1175/JCLI-D-16-0758.1, 2017.
Green, R., Mahowald, N., Clark, R., Ehlmann, B., Ginoux, P., Kalashnikova, O., Miller, R., Okin, G., Painter, T., Pérez García-Pando, C., Realmuto, V. J., Swayze, G. A., Thompson, D. R., Middleton, E., Guanter, L., Ben Dor, E., and Phillips, B. R.: NASA’s Earth Surface Mineral Dust Source Investigation, in: AGU Fall Meeting Abstracts, 2018.
Green, R. O., Eastwood, M. L., Sarture, C. M., Chrien, T. G., Aronsson, M., Chippendale, B. J., Faust, J. A., Pavri, B. E., Chovit, C. J., Solis, M., Olah, M. R., and Williams, O.: Imag-ing Spectroscopy and the Airborne Visible/Infrared ImagImag-ing Spectrometer (AVIRIS), Remote Sens. Environ., 65, 227–248, https://doi.org/10.1016/S0034-4257(98)00064-9, 1998. Guanter, L., Kaufmann, H., Segl, K., Foerster, S., Rogass, C.,
Chabrillat, S., Kuester, T., Hollstein, A., Rossner, G., Chlebek,
C., Straif, C., Fischer, S., Schrader, S., Storch, T., Heiden, U., Mueller, A., Bachmann, M., Mühle, H., Müller, R., Habermeyer, M., Ohndorf, A., Hill, J., Buddenbaum, H., Hostert, P., Van der Linden, S., Leita ˜o, P. J., Rabe, A., Doerffer, R., Krasemann, H., Xi, H., Mauser, W., Hank, T., Locherer, M., Rast, M., Staenz, K., and Sang, B.: The EnMAP Spaceborne Imaging Spectroscopy Mission for Earth Observation, Remote Sens., 7, 8830–8857, https://doi.org/10.3390/rs70708830, 2015.
Hochberg, E. J., Roberts, D. A., Dennison, P. E., and Hulley, G. C.: Special issue on the Hyperspectral Infrared Imager (HyspIRI): Emerging science in terrestrial and aquatic ecology, radiation balance and hazards, Remote Sens. Environ., 167, 1–5, https://doi.org/10.1016/j.rse.2015.06.011, 2015.
Hu, H., Landgraf, J., Detmers, R., Borsdorff, T., Aan de Brugh, J., Aben, I., Butz, A., and Hasekamp, O.: Toward Global Map-ping of Methane With TROPOMI: First Results and Intersatel-lite Comparison to GOSAT, Geophys. Res. Lett., 45, 3682–3689, https://doi.org/10.1002/2018GL077259, 2018.
Jacob, D. J., Turner, A. J., Maasakkers, J. D., Sheng, J., Sun, K., Liu, X., Chance, K., Aben, I., McKeever, J., and Franken-berg, C.: Satellite observations of atmospheric methane and their value for quantifying methane emissions, Atmos. Chem. Phys., 16, 14371–14396, https://doi.org/10.5194/acp-16-14371-2016, 2016.
Kneizys, F., Abreu, L., Anderson, G., Chetwynd, J., Shettle, E., Berk, A., Bernstein, L., Robertson, D., Acharya, P., and Rothman, L.: The MODTRAN 2/3 report and LOWTRAN 7 model, Phillips Laboratory, Hanscom AFB, MA, http://web. gps.caltech.edu/~vijay/pdf/modrept.pdf (last access: 18 Octo-ber 2019), 1996.
Kochanov, R., Gordon, I., Rothman, L., Wcisło, P., Hill, C., and Wilzewski, J.: HITRAN Application Programming In-terface (HAPI): A comprehensive approach to working with spectroscopic data, J. Quant. Spectrosc. Ra., 177, 15–30, https://doi.org/10.1016/j.jqsrt.2016.03.005, 2016.
Kort, E. A., Frankenberg, C., Costigan, K. R., Lindenmaier, R., Dubey, M. K., and Wunch, D.: Four corners: The largest US methane anomaly viewed from space, Geophys. Res. Lett., 41, 6898–6903, 2014.
Kuze, A., Suto, H., Shiomi, K., Kawakami, S., Tanaka, M., Ueda, Y., Deguchi, A., Yoshida, J., Yamamoto, Y., Kataoka, F., Tay-lor, T. E., and Buijs, H. L.: Update on GOSAT TANSO-FTS performance, operations, and data products after more than 6 years in space, Atmos. Meas. Tech., 9, 2445–2461, https://doi.org/10.5194/amt-9-2445-2016, 2016.
Loizzo, R., Guarini, R., Longo, F., Scopa, T., Formaro, R., Facchinetti, C., and Varacalli, G.: Prisma: The Italian Hy-perspectral Mission, in: IGARSS 2018–2018 IEEE Interna-tional Geoscience and Remote Sensing Symposium, 175–178, https://doi.org/10.1109/IGARSS.2018.8518512, 2018.
McKeever, J., Durak, B., Gains, D., Jervis, D., Varon, D., Germain, S., and Sloan, J.: GHGSat-D: Greenhouse gas plume imaging and quantification from space using a Fabry-Perot imaging spectrom-eter, Abstract (A33G-2450) presented at 2017 AGU Fall Meet-ing, New Orleans, LA, 11–15 December, 2017AGUFM, 2017. National Academies of Sciences, Engineering, and Medicine:
Nieke, J. and Rast, M.: Towards the Copernicus Hy-perspectral Imaging Mission For The Environment (CHIME), in: IGARSS 2018–2018 IEEE International Geoscience and Remote Sensing Symposium, 157–159, https://doi.org/10.1109/IGARSS.2018.8518384, 2018.
Ong, C., Carrère, V., Chabrillat, S., Clark, R., Hoefen, T., Kokaly, R., Marion, R., Souza Filho, C. R., Swayze, G., and Thompson, D. R.: Imaging Spectroscopy for the Detection, Assessment and Monitoring of Natural and Anthropogenic Hazards, Surv. Geo-phys., 40, 431–470, https://doi.org/10.1007/s10712-019-09523-1, 2019.
Rodgers, C. D.: Inverse methods for atmospheric sounding: theory and practice, Vol. 2, World scientific, Chap. 5, 81–100, 2000. Roy, D., Wulder, M., Loveland, T., C. E., W., Allen, R., Anderson,
M., Helder, D., Irons, J., Johnson, D., Kennedy, R., Scambos, T., Schaaf, C., Schott, J., Sheng, Y., Vermote, E., Belward, A., Bind-schadler, R., Cohen, W., Gao, F., Hipple, J., Hostert, P., Hunting-ton, J., Justice, C., Kilic, A., Kovalskyy, V., Lee, Z., Lymburner, L., Masek, J., McCorkel, J., Shuai, Y., Trezza, R., Vogelmann, J., Wynne, R., and Zhu, Z.: Landsat-8: Science and product vision for terrestrial global change research, Remote Sens. Environ., 145, 154–172, https://doi.org/10.1016/j.rse.2014.02.001, 2014. Segl, K., Guanter, L., Rogass, C., Kuester, T., Roessner, S.,
Kauf-mann, H., Sang, B., Mogulsky, V., and Hofer, S.: EeteS—The EnMAP End-to-End Simulation Tool, IEEE J. Sel. Top. Appl., 5, 522–530, https://doi.org/10.1109/JSTARS.2012.2188994, 2012. Sheng, J.-X., Jacob, D. J., Maasakkers, J. D., Zhang, Y., and Sulprizio, M. P.: Comparative analysis of low-Earth orbit (TROPOMI) and geostationary (GeoCARB, GEO-CAPE) satel-lite instruments for constraining methane emissions on fine regional scales: application to the Southeast US, Atmos. Meas. Tech., 11, 6379–6388, https://doi.org/10.5194/amt-11-6379-2018, 2018.
Thompson, D. R., Thorpe, A. K., Frankenberg, C., Green, R. O., Duren, R., Guanter, L., Hollstein, A., Middleton, E., Ong, L., and Ungar, S.: Space-based remote imaging spectroscopy of the Aliso Canyon CH4superemitter, Geophys. Res. Lett., 43, 6571– 6578, https://doi.org/10.1002/2016GL069079, 2016.
Thompson, D. R., Natraj, V., Green, R. O., Helmlinger, M. C., Gao, B.-C., and Eastwood, M. L.: Optimal estimation for imag-ing spectrometer atmospheric correction, Remote Sens. Environ., 216, 355–373, 2018.
Thorpe, A. K., Frankenberg, C., and Roberts, D. A.: Re-trieval techniques for airborne imaging of methane concen-trations using high spatial and moderate spectral resolution: application to AVIRIS, Atmos. Meas. Tech., 7, 491–506, https://doi.org/10.5194/amt-7-491-2014, 2014.
Thorpe, A. K., Frankenberg, C., Green, R. O., Thompson, D. R., Aubrey, A. D., Mouroulis, P., Eastwood, M. L., and Matheou, G.: The Airborne Methane Plume Spectrom-eter (AMPS): Quantitative imaging of methane plumes in real time, in: 2016 IEEE Aerospace Conference, 1–14, https://doi.org/10.1109/AERO.2016.7500756, 2016.
Thorpe, A. K., Frankenberg, C., Thompson, D. R., Duren, R. M., Aubrey, A. D., Bue, B. D., Green, R. O., Gerilowski, K., Krings, T., Borchardt, J., Kort, E. A., Sweeney, C., Conley, S., Roberts, D. A., and Dennison, P. E.: Airborne DOAS re-trievals of methane, carbon dioxide, and water vapor concentra-tions at high spatial resolution: application to AVIRIS-NG, At-mos. Meas. Tech., 10, 3833–3850, https://doi.org/10.5194/amt-10-3833-2017, 2017.
Turner, A. J., Jacob, D. J., Wecht, K. J., Maasakkers, J. D., Lund-gren, E., Andrews, A. E., Biraud, S. C., Boesch, H., Bowman, K. W., Deutscher, N. M., Dubey, M. K., Griffith, D. W. T., Hase, F., Kuze, A., Notholt, J., Ohyama, H., Parker, R., Payne, V. H., Sussmann, R., Sweeney, C., Velazco, V. A., Warneke, T., Wennberg, P. O., and Wunch, D.: Estimating global and North American methane emissions with high spatial resolution us-ing GOSAT satellite data, Atmos. Chem. Phys., 15, 7049–7069, https://doi.org/10.5194/acp-15-7049-2015, 2015.
Turner, A. J., Jacob, D. J., Benmergui, J., Brandman, J., White, L., and Randles, C. A.: Assessing the capability of different satellite observing configurations to resolve the distribution of methane emissions at kilometer scales, Atmos. Chem. Phys., 18, 8265– 8278, https://doi.org/10.5194/acp-18-8265-2018, 2018. Varon, D., Jacob, D., McKeever, J., Durak, B., and Jervis, D.:
Quan-tifying Methane Emissions from Individual Coal Mine Vents with GHGSat-D Satellite Observations, in: American Geophysi-cal Union, Fall Meeting 2018, abstract no. A43R-3443, 2018a. Varon, D. J., Jacob, D. J., McKeever, J., Jervis, D., Durak,
B. O. A., Xia, Y., and Huang, Y.: Quantifying methane point sources from fine-scale satellite observations of atmo-spheric methane plumes, Atmos. Meas. Tech., 11, 5673–5686, https://doi.org/10.5194/amt-11-5673-2018, 2018b.
Xi, X., Natraj, V., Shia, R. L., Luo, M., Zhang, Q., Newman, S., Sander, S. P., and Yung, Y. L.: Simulated retrievals for the remote sensing of CO2, CH4, CO, and H2O from geostationary orbit,