R E S E A R C H A R T I C L E
Open Access
Waist circumference, waist-to-hip ratio and
waist-to-height ratio reference percentiles for
abdominal obesity among Greek adolescents
Flora Bacopoulou
*, Vasiliki Efthymiou, Georgios Landis, Anastasios Rentoumis and George P Chrousos
Abstract
Background:Indices predictive of adolescent central obesity include waist circumference (WC), waist-to-hip ratio (WHR) and waist-to-height ratio (WHtR). Such reference data are lacking for Greek adolescents. The aim of this study was to develop age- and gender-specific WC, WHR and WHtR smoothed reference percentiles for abdominal obesity among Greek adolescents aged 12–17 years, to investigate possible obesity cut-offs of WHR and WHtR and to compare WC percentiles to other adolescent populations.
Methods:A representative sample of 1610 high school adolescents (42.2% boys, 57.8% girls; mean age ± sd 14.4 ± 1.72 years) participated in this cross-sectional study in Attica, Greece, in 2013. Weight, height, body mass index (BMI), WC, hip circumference (HC), WHR and WHtR were measured and percentiles were calculated using the LMS method. The relation between WHR, WHtR and general obesity, as defined by the International Obesity Task Force, was investigated with receiver operating characteristic (ROC) analysis. The discriminating power of WHR and WHtR was expressed as area under the curve (AUC). Greek adolescents’WC measurements at the 50th and 90th percentile were compared with their counterparts’smoothed percentiles from Norway, Turkey, Poland, South India, Germany and Kuwait.
Results:Boys had significantly higher mean in all measures than girls, except for BMI where there was no statistical difference in terms of gender. BMI, WC and HC showed an increasing trend with age. WC leveled off in both genders at the age of 17 years. WHR and WHtR showed a continuous decrease with advancing age. WHtR was a better predictor for general obesity in both boys and girls (AUC 95% CI 0.945-0.992) than the WHR (AUC 95% CI 0.758-0.870); the WHtR cut-off of 0.5 had sensitivity 91% and specificity 95% for both genders and all age groups combined. International comparisons showed that Greek adolescents had relatively high levels of abdominal obesity in early-middle adolescence but this did not persist at the age of 17 years.
Conclusions:These reference percentile curves could be used provisionally for early detection of abdominal obesity in Greek adolescents aged 12–17 years; WHtR of 0.5 could also be used as a threshold for obesity in this age group.
Keywords:Percentiles, Waist circumference, Waist-hip ratio, Waist-height ratio, Abdominal obesity, Greece, Adolescents
* Correspondence:bacopouf@hotmail.com
Center for Adolescent Medicine and UNESCO Chair in Adolescent Health Care, First Department of Pediatrics, University of Athens Medical School, Aghia Sophia Children’s Hospital, 3 Thivon Street, Athens 115 27, Greece
Background
The worldwide prevalence of overweight (OW) and obesity (OB) in children and adolescents has reached worrying levels. School-based studies using standard-ized Greek or international cut-off points, have shown high prevalence of adolescent OW and OB over the two past decades in Greece. A nationwide study carried out during 1997–1998 in a representative sample of adoles-cents 11–16 years of age reported an overall prevalence of OW and OB 15.3% and 1.8% respectively, according to the International Obesity Task Force (IOTF) criteria [1,2]. In a large-scale epidemiological survey throughout all parts of Greece in 2003, the overall prevalences of OW and OB for adolescents aged 13–19 years were 23.3% and 6.1% in boys vs. 14% and 2.7% in girls, respectively [3]. A regional study in the second largest Greek city of Thessaloniki reported a prevalence of OW and OB of 19% and 2.6% for the ages 11–17 years [4]. For the same city, another study showed a prevalence of OW and OB of 23.8% and 4.8% according to IOTF cut-off points, for the ages 12–18 years [5].
The above findings were based on body mass index (BMI), which gives no indication of distribution of body fat. In adolescents, as in adults, central or abdominal fat increases the risk for metabolic (dyslipidemia and insu-lin resistance) and cardiovascular complications [6,7]. Indices predictive of adolescent central obesity include waist circumference (WC), waist-to-hip ratio (WHR) and waist-to-height ratio (WHtR). WC is a highly sensi-tive and specific measure of upper body fat in young people and thus it is valuable for identifying overweight and obese adolescents at risk of developing metabolic complications. The same applies for risk factors of cardiovascular disease in children and adolescents, in whom WC and WHtR are better predictors than BMI [8].
Previous literature suggests the use of pre-specified cut-off points for defining central obesity; WHtR ≥0.5 [9], WHR > 0.90 in men and > 0.85 in women, in order to standardize comparisons within and between popula-tions [10]. However such cut-off points may not be suit-able for all adolescents, as the sensitivity and specificity change with age end ethnicity. Moreover, developing ethnic-specific cut-offs requires a demonstration of dif-ferential predictive validity. Only few specific cut-offs or even reference percentiles for WC, WHR, WHtR are available for adolescents in some countries [11-17] and differ from one country to another, due to genetic and environmental factors. Such reference data are lacking for Greek adolescents, thus comprehensive reference values for WC, WHR, WHtR are needed in order to establish an ethnic accepted age- and gender-specific definition of central obesity for adolescents in Greece.
The aim of this study was to develop age- and gender-specific WC, WHR and WHtR smoothed reference
percentiles for abdominal obesity among Greek adoles-cents 12–17 years of age, to compare them to world-wide curves generated for other adolescent populations and to investigate possible WHR and WHtR cut-offs for detecting general obesity as defined by the IOTF.
Methods Subjects
Cross-sectional anthropometric data were obtained from adolescents aged 12–17 years, as part of a“program for health promotion, prevention and screening for charac-teristics of metabolic syndrome in adolescents attending high schools in three municipalities (Palaio Faliro, Aghios Dimitrios, Alimos) in the Attica region in Greece, with the use of portable telemedicine”. The program was funded by the European Union and conducted from September to November 2013. The study was in agreement with the Helsinki Declaration. Ethical approval was obtained from the Uniform Administrative Sector of Primary and Sec-ondary Education of the Greek Ministry of Education and Religious Affairs (reference number 86758/Γ2).
Attica includes the capital and surrounding urban areas; it is the largest and most populated region in Greece. The inhabitants are quite similar to the general Greek population as the urban population represents 60% of the country population and people from any-where in Greece have been immigrating to Athens in the last 70 years. A total of 23 public high schools were ran-domly selected and the adolescents attending the schools were informed about the study. All adolescents who pro-vided a consent form signed by them and their parents or guardians, participated in the study. A total of 2,100 adolescents were initially contacted, however, 490 eligible adolescents (323 boys, 167 girls) were excluded from the measurements as they did not provide consent forms signed by them and their parents or guardians. Finally, a total of 1610 adolescents (680 males and 930 females) were included in the study (Figure 1). As far as possible, the sample was representative of the Attica population of adolescent girls and boys. The adolescent population aged
12 to 17years was estimated at 212,189 adolescents in the middle of 2011. The population sample of 1610 adoles-cents satisfied a margin error of 3.2% at a 99% confidence interval.
Measurements
Sampled schools were visited on pre-arranged dates, early in the morning, by a team of pediatricians and nurses, appropriately trained to perform anthropometry by the principal investigator and an exercise physiologist.
Participants were instructed to fast overnight before screening. The study protocol included the anthropo-metric parameters body weight (BW), height (Ht), WC and hip circumference (HC), with adolescents being bare-foot and in minimal clothing. Adolescents’ weight was measured with electronic portable scales (Fora w100b, Switzerland) connected to suitable telemedicine software (vida24, Vidavo Health Telematics). Height was measured by portable stadiometers with the participants’ feet placed together with heels, buttocks and shoulder blades against the stick and head positioned in the Frankfurt horizontal plane. Waist and hip circumfer-ences were measured twice using inextensible anthropo-metric tape with the adolescents standing erect and relaxed with arms at the sides and feet positioned close together. Waist circumference was measured midway between the lowest border of rib cage and the upper border of iliac crest, at the end of normal expiration [18]. HC was measured at the widest part of the hip at the level of the greater trochanter. For all measurements the tape was positioned at a level parallel to the floor.
All measurements were in centimeters (cm) to the near-est 0.1cm. For each participant, measurements were reg-istered in the software database.
Statistical analysis
Mean values were calculated for BW, Ht, BMI, WC, HC, WHR and WHtR. BMI was calculated as the ratio of body weight to the square of height (kg/m2), WHR was calcu-lated as the ratio of waist to hip circumference and WHtR as the ratio of waist circumference to height. Smoothed age- and gender-specific table and graph percentiles were constructed for BMI, WC, WHR and WHtR by the LMS method. The 3rd, 10th, 25th, 50th, 75th, 90th and 97th percentiles were calculated to be in agreement with the official Greek BMI curves for adolescents [19].
To evaluate the representativeness of the study data, we examined if the study participants’ BMI had equal means with the BMI derived from the Greek official growth curves for age-matched adolescents. Using Stu-dent t-test, we found that there was no statistical differ-ence between these two populations.
Statistical analyses were carried out using the SPSS software 21 version for Windows. Smoothed age and gender-specific curves for all percentiles were constructed with the use of software package LMS Chart Maker Pro, version 2.54. The LMS method assumes that the data can be normalized by using power transformation. The per-centile curves were the results of smoothing the age specific curves: L for skewness, M for median and S for coefficient of variation [20,21].
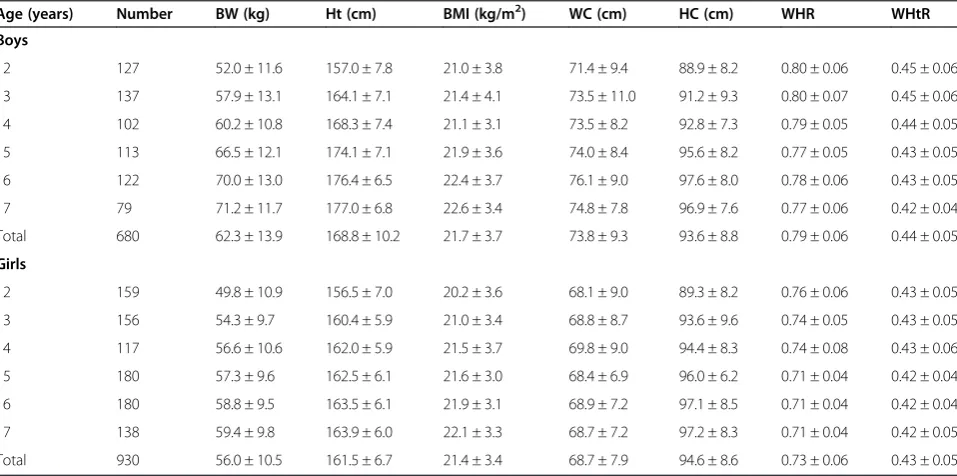
Table 1 Mean values (±sd) for body weight (BW), height (Ht), body mass index (BMI), waist circumference (WC), hip circumference (HC), waist-to-hip ratio (WHR) and waist-to-height ratio (WHtR) for Greek adolescents aged 12–17 years
Age (years) Number BW (kg) Ht (cm) ΒΜΙ(kg/m2) WC (cm) HC (cm) WHR WHtR
Boys
12 127 52.0 ± 11.6 157.0 ± 7.8 21.0 ± 3.8 71.4 ± 9.4 88.9 ± 8.2 0.80 ± 0.06 0.45 ± 0.06
13 137 57.9 ± 13.1 164.1 ± 7.1 21.4 ± 4.1 73.5 ± 11.0 91.2 ± 9.3 0.80 ± 0.07 0.45 ± 0.06
14 102 60.2 ± 10.8 168.3 ± 7.4 21.1 ± 3.1 73.5 ± 8.2 92.8 ± 7.3 0.79 ± 0.05 0.44 ± 0.05
15 113 66.5 ± 12.1 174.1 ± 7.1 21.9 ± 3.6 74.0 ± 8.4 95.6 ± 8.2 0.77 ± 0.05 0.43 ± 0.05
16 122 70.0 ± 13.0 176.4 ± 6.5 22.4 ± 3.7 76.1 ± 9.0 97.6 ± 8.0 0.78 ± 0.06 0.43 ± 0.05
17 79 71.2 ± 11.7 177.0 ± 6.8 22.6 ± 3.4 74.8 ± 7.8 96.9 ± 7.6 0.77 ± 0.06 0.42 ± 0.04
Total 680 62.3 ± 13.9 168.8 ± 10.2 21.7 ± 3.7 73.8 ± 9.3 93.6 ± 8.8 0.79 ± 0.06 0.44 ± 0.05
Girls
12 159 49.8 ± 10.9 156.5 ± 7.0 20.2 ± 3.6 68.1 ± 9.0 89.3 ± 8.2 0.76 ± 0.06 0.43 ± 0.05
13 156 54.3 ± 9.7 160.4 ± 5.9 21.0 ± 3.4 68.8 ± 8.7 93.6 ± 9.6 0.74 ± 0.05 0.43 ± 0.05
14 117 56.6 ± 10.6 162.0 ± 5.9 21.5 ± 3.7 69.8 ± 9.0 94.4 ± 8.3 0.74 ± 0.08 0.43 ± 0.06
15 180 57.3 ± 9.6 162.5 ± 6.1 21.6 ± 3.0 68.4 ± 6.9 96.0 ± 6.2 0.71 ± 0.04 0.42 ± 0.04
16 180 58.8 ± 9.5 163.5 ± 6.1 21.9 ± 3.1 68.9 ± 7.2 97.1 ± 8.5 0.71 ± 0.04 0.42 ± 0.04
17 138 59.4 ± 9.8 163.9 ± 6.0 22.1 ± 3.3 68.7 ± 7.2 97.2 ± 8.3 0.71 ± 0.04 0.42 ± 0.05
The relation between WHR, WHtR and general obesity as defined by the IOTF was investigated with nonparamet-ric receiver operating characteristic (ROC) analysis. The discriminating power of the WHR and the WHtR was expressed as area under the curve (AUC) ± std. error or 95% confidence intervals (CI).
Results
The study included a sample of 1610 high school adoles-cents aged 12 to 17 years. The male to female ratio was 0.73 with 42.2% boys and 57.8% girls. The mean age (±sd) was 14.4 (±1.72) years. Descriptive statistics for BW, Ht, BMI, WC, HC, WHR and WHtR, by age group for boys and girls are presented in Table 1. Boys had a significantly higher mean in all measures than girls, except for BMI where there was no statistical difference in terms of gender. BMI, WC and HC showed an in-creasing trend with age. WC leveled off in both genders at the age of 17years. WHR and WHtR showed a con-tinuous decrease with advancing age.
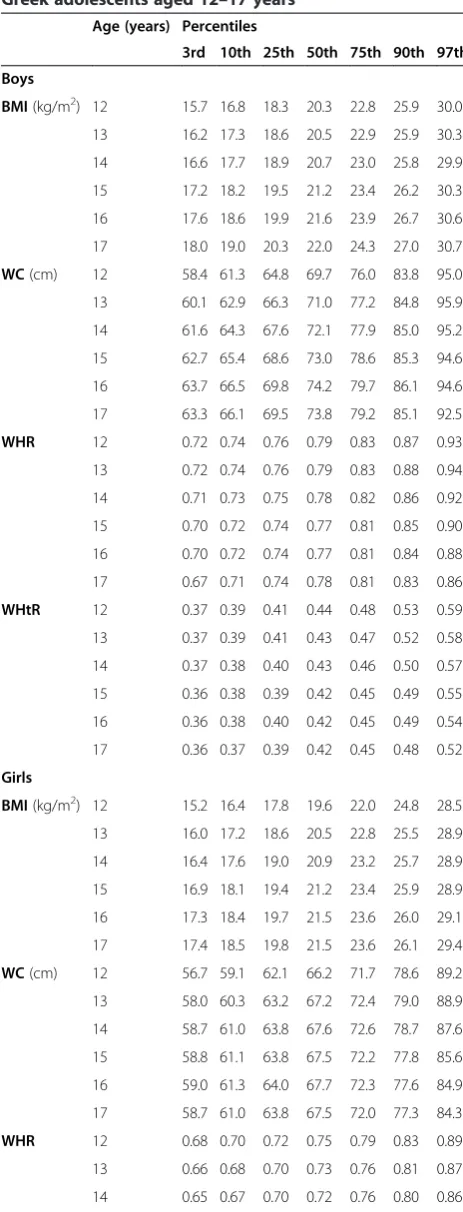
The following tables and curves demonstrate the smoothed gender- and age-specific percentile values at the 3rd, 10th, 25th, 50th, 75th, 90th and 97th percen-tiles, which were developed and smoothed by the LMS method; for WC [Table 2, Figure 2], for WHR [Table 2, Figure 3] and for WHtR [Table 2, Figure 4].
ROC analysis showed that WHtR had higher discrimin-ating power to detect IOTF obesity than WHR [Figure 5]. For obesity, the WHtR cut-off of 0.5 had a sensitivity of 91% and a specificity of 95% for both genders (AUC 0.969 ± 0.018 for boys, 0.968 ± 0.015 for girls) and all age groups combined (AUC 0.968 ± 0.012). The cut-off for WHR > 0.90 in boys had a sensitivity of 22% and a specificity of 97% (AUC 0.866 ± 0.028) whereas the WHR > 0.85 cut-off in girls had a sensitivity of 24% and a specificity of 99% (AUC 0.772 ± 0.047). WHtR was a better predictor of general obesity than the WHR in both boys and girls.
Table 2 Age- and gender-specific smoothed body mass index (BMI), waist circumference (WC), waist-to-hip ratio (WHR) and waist-to-height ratio (WHtR) percentiles for Greek adolescents aged 12–17 years
Age (years) Percentiles
3rd 10th 25th 50th 75th 90th 97th
Boys
BMI(kg/m2) 12 15.7 16.8 18.3 20.3 22.8 25.9 30.0
13 16.2 17.3 18.6 20.5 22.9 25.9 30.3
14 16.6 17.7 18.9 20.7 23.0 25.8 29.9
15 17.2 18.2 19.5 21.2 23.4 26.2 30.3
16 17.6 18.6 19.9 21.6 23.9 26.7 30.6
17 18.0 19.0 20.3 22.0 24.3 27.0 30.7
WC(cm) 12 58.4 61.3 64.8 69.7 76.0 83.8 95.0
13 60.1 62.9 66.3 71.0 77.2 84.8 95.9
14 61.6 64.3 67.6 72.1 77.9 85.0 95.2
15 62.7 65.4 68.6 73.0 78.6 85.3 94.6
16 63.7 66.5 69.8 74.2 79.7 86.1 94.6
17 63.3 66.1 69.5 73.8 79.2 85.1 92.5
WHR 12 0.72 0.74 0.76 0.79 0.83 0.87 0.93
13 0.72 0.74 0.76 0.79 0.83 0.88 0.94
14 0.71 0.73 0.75 0.78 0.82 0.86 0.92
15 0.70 0.72 0.74 0.77 0.81 0.85 0.90
16 0.70 0.72 0.74 0.77 0.81 0.84 0.88
17 0.67 0.71 0.74 0.78 0.81 0.83 0.86
WHtR 12 0.37 0.39 0.41 0.44 0.48 0.53 0.59
13 0.37 0.39 0.41 0.43 0.47 0.52 0.58
14 0.37 0.38 0.40 0.43 0.46 0.50 0.57
15 0.36 0.38 0.39 0.42 0.45 0.49 0.55
16 0.36 0.38 0.40 0.42 0.45 0.49 0.54
17 0.36 0.37 0.39 0.42 0.45 0.48 0.52
Girls
BMI(kg/m2) 12 15.2 16.4 17.8 19.6 22.0 24.8 28.5
13 16.0 17.2 18.6 20.5 22.8 25.5 28.9
14 16.4 17.6 19.0 20.9 23.2 25.7 28.9
15 16.9 18.1 19.4 21.2 23.4 25.9 28.9
16 17.3 18.4 19.7 21.5 23.6 26.0 29.1
17 17.4 18.5 19.8 21.5 23.6 26.1 29.4
WC(cm) 12 56.7 59.1 62.1 66.2 71.7 78.6 89.2
13 58.0 60.3 63.2 67.2 72.4 79.0 88.9
14 58.7 61.0 63.8 67.6 72.6 78.7 87.6
15 58.8 61.1 63.8 67.5 72.2 77.8 85.6
16 59.0 61.3 64.0 67.7 72.3 77.6 84.9
17 58.7 61.0 63.8 67.5 72.0 77.3 84.3
WHR 12 0.68 0.70 0.72 0.75 0.79 0.83 0.89
13 0.66 0.68 0.70 0.73 0.76 0.81 0.87
14 0.65 0.67 0.70 0.72 0.76 0.80 0.86
Table 2 Age- and gender-specific smoothed body mass index (BMI), waist circumference (WC), waist-to-hip ratio (WHR) and waist-to-height ratio (WHtR) percentiles for Greek adolescents aged 12–17 years(Continued)
15 0.64 0.66 0.68 0.71 0.74 0.77 0.81
16 0.64 0.66 0.68 0.71 0.73 0.76 0.79
17 0.64 0.66 0.68 0.70 0.73 0.76 0.78
WHtR 12 0.37 0.38 0.40 0.42 0.46 0.50 0.57
13 0.36 0.38 0.39 0.42 0.45 0.49 0.55
14 0.36 0.38 0.39 0.42 0.45 0.49 0.54
15 0.36 0.37 0.39 0.42 0.45 0.48 0.52
16 0.36 0.37 0.39 0.42 0.44 0.48 0.52
Comparisons
We compared our WC reference curves with those of other countries in an attempt to evaluate ethnic ences in adolescent abdominal obesity. Because of differ-ent methods that have been used in published national reference values for adolescents, caution is needed when comparing WC percentile reference data between studies. Therefore, comparison was limited among studies that used the LMS method. To use contemporary data, only surveys conducted from the year 2000 onwards were included. The results of the Greek adolescents’ WC measurements were compared with those from coun-tries of diverse geographical location and ethnicity: Norway, Turkey, Poland, South India, Germany and Kuwait [17,22-26]. Percentile curves for these coun-tries were also based on cross-sectional data obtained from adolescents in the school setting. For the adoles-cents aged 12–17 years the reported mean BMIs ranged from 20.4 to 24.2 for boys and from 20.3 to 23.9 for girls [23,25,26]. Our study participants had mean BMI values of 21.7 for boys and 21.4 for girls (Table 1). Data about WC is of special interest at the 50th percentile (WC50) because they reflect the majority
as a median point and at the 90th percentile (WC90)
be-cause they reflect the pathological point of abdominal obesity. Comparison of WC50 (median) and WC90
(ab-dominal obesity cut-off ) for Greek adolescents with their
counterparts’ smoothed percentiles developed over the past 15years in six countries, are presented in Figure 6.
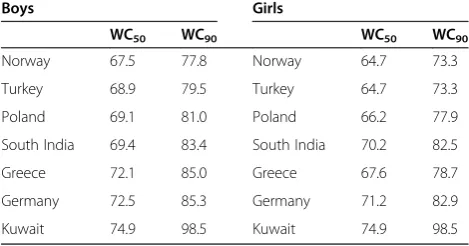
Our findings showed that Kuwaiti adolescents had higher WC and Turkish adolescents had lower WC than Greeks in all ages for both genders. Greek adolescents had higher WC values compared to South Indian, Polish and Norwegian adolescents at all ages except at the age of 17 years, where WC dropped to lower levels. Greek adolescents in general had lower WC than Germans except at the ages of 12–13 years, where Greek boys did worse. Inter-country comparisons were also performed for adolescents’ WC50 and WC90 at the mean age of
14years as shown in Table 3. Results showed that 50th and 90th WC percentile curves for Greek adolescents aged 14years were higher for girls and boys as com-pared to those for Norwegian, Turkish, and Polish ado-lescents but lower than German and Kuwaiti girls and boys. WC50 and WC90were higher for Greek boys and
lower for girls compared with their counterparts from South India.
Discussion
This study presents the first age- and gender-specific smoothed percentiles for WC, WHR and WHtR for Greek adolescents 12 to 17 years of age. Percentile data were developed from a representative sample of 1610 Greek high school adolescents. These curves represent the first attempt to develop smoothed percentile curves for those indices and to suggest Greek cut offs for defin-ing abdominal obesity in this population.
Consistent with previous literature in adolescents [11,13,17,22-29], WC showed an increasing trend with age among both girls and boys. This is an expected find-ing durfind-ing puberty, as it represents a critical period for body fat development and distribution [30]. At the upper end of the age range, WC leveled off in both genders. Boys had higher WC, WHR and WHtR values than girls at all ages. This probably reflects gender-specific influ-ences on waist circumference and can be explained by the fact that in boys central fat distribution is more pre-dominant than in girls. Adipose tissue is distributed Figure 2Smoothed waist circumference (WC in cm) percentile
curves for Greek adolescents.
Figure 3Smoothed waist-to-hip ratio (WHR) percentile curves for Greek adolescents.
mainly in the upper body (nape of neck, shoulders, epigastrium) in boys, whereas in girls peripheral fat accumulation in the lower body predominates.
Data about WC percentiles might be of special interest as it remains the most widely accepted method and the simplest clinical measure of pubertal central obesity; it is noninvasive and easy to obtain. For adults, a cut-off for predicting the risk for metabolic syndrome exists, how-ever, adolescents require separate cut-offs of sex-specific WC norms relative to age because of the normal in-crease in WC throughout puberty. The 90th percentile for WC is commonly suggested [31-33] as a cut-off percentile at and above which the risk for metabolic syndrome in adolescence increases substantially. As WC cut off values vary according to ethnicity and such data are lacking for Greek adolescents, we aimed to establish the 90th percentile for WC in an effort to provide popu-lation specific reference values for this age group. Pro-vided that a specific WC cut-off exists, measurement of this anthropometric indicator will be a useful screening tool for cardiovascular and metabolic disease risk in adolescents in primary care practice in Greece.
In young children, WC is reported to be a better estimate of body fat percentage when adjusting for gender and age, thus pointing to the importance of examining age-range
specific subgroups [34]. When all of our study adolescents were combined, mean BMI increased with age and 11.1% were found to have obese waist circumference (based on their 90th percentile). The percentage of adolescents who exceeded the 90th percentile reached a peak at the age of 13 years (averaging about 14%) and showed a decrease at the age of 15 years (averaging about 8.6%). Thus, the age group of 13 years appeared to be at increased risk for cen-tral obesity but this risk seemed to decrease after the age of attainment of peak height velocity.
WHR and WHtR exhibited an age-dependent decrease for both genders. The cut-off of WHR > 0.90 corre-sponded at the 97th WHR percentile for adolescent boys whereas the cut-off of > 0.85 corresponded at the 93rd-99th percentiles in girls according to age. These WHR cut-offs used in adults were not suitable to be used as a threshold for general obesity in our adolescents because of a low sensitivity demonstrated by ROC analysis. Previ-ous literature suggests the cut-off of WHtR ≥ 0.5 as a useful predictor of central obesity in representative
criteria. We conclude that WHtR of 0.5 could also be used as a threshold for obesity in Greek adolescents 12–17 years of age.
Our study had several strengths such as the fact that similar studies have not been previously performed in Greek adolescents. Anthropometric data were collected by appropriately trained health professionals that used the same anatomic sites of measurements. Furthermore, results are likely to be representative of today’s adoles-cents because BMI data were collected during a recent specific period of time and were similar to contemporary Greek official adolescent BMI data.
Limitations include the lack of information of the effect of pubertal status on the anthropometric indices, as well as the cross-sectional design of the study based on data collection in 2013 with a high prevalence of overweight/obesity. The prevalence of pediatric and ado-lescent overweight/obesity in Greece has risen to more than 30% over the past 5 years [38], however the lack of earlier analytic data did not allow accurate comparisons. Although our reference lines are based on contemporary data that are likely to be representative of the current situation in Greece, validation of these percentile curves against equivalent longitudinal data are warranted in future studies. Another limitation was the lower partici-pating rate of boys vs. girls. The higher percentage of boys’ missing consent forms was mainly attributed to their negligence to inform their parents. The fact that more girls had taken care for the consent forms to be completed in time, could be partially attributed to their higher interest in body measurement, size and shape as they are more sensitive to their changing physical ap-pearance, than boys [39].
Conclusions
In conclusion, this is the first comprehensive study which determines smoothed age- and sex-specific WC, WHR and WHtR percentiles in the Greek population for adolescents aged 12 to 17 years. We propose that
these percentiles could be used provisionally in clinical practice for early detection of abdominal obesity in Greek adolescents. WHtR could be used as an additional or alternative screening tool for general obesity in this age group.
Abbreviations
OW:Overweight; OB: Obesity; IOTF: International Obesity Task Force; BMI: Body mass index; WC: Waist circumference; WHR: Waist-to-hip ratio; WHtR: Waist-to-height ratio; BW: Body weight; Ht: Height; HC: Hip circumference; ROC: Receiver operating characteristic; AUC: Area under the curve; WC50: Waist circumference at the 50th percentile; WC90: Waist circumference at the 90th percentile.
Competing interests
The authors declare that they have no competing interests.
Authors’contributions
All authors have made substantial contributions to conception, acquisition and interpretation of data. They have participated in drafting the article and they have approved the final submitted version. FB acquired and interpreted the data, conceptualized and drafted the initial manuscript and approved the final submitted version. VE actively participated in data analysis, in drafting the manuscript and approved the final manuscript as submitted. GL and AR reviewed and interpreted the data, revised the manuscript and approved the final manuscript as submitted. GPC supervised data collection and interpreted the data, critically reviewed the manuscript and approved the final manuscript as submitted.
Authors’information
Dr FB (MD, PhD), Pediatrician in adolescent medicine, is a Research Fellow at the Center for Adolescent Medicine (C.A.M.) of the First Department of Pediatrics of the Athens University in Greece. C.A.M. is a tertiary referral center for adolescents and young people in Greece, that hosts the UNESCO Chair in Adolescent Health Care. C.A.M. was the scientific institution running the program. Professor GPC (MD, MACP, MACE, FRCP London), the Chairholder and Director of C.A.M. and of the First Department of Pediatrics of the Athens University, is a Professor in Pediatric Endocrinology. Professor GPC and Dr FB were members of the research team of the program. VE is a Statistician, GL a Registered Dietitian and AR a Health Services Manager at C.A.M.
The authors are responsible for the choice and presentation of views contained in this article and for opinions expressed therein, which are not necessarily those of UNESCO and do not commit the Organization.
Acknowledgements
We would like to thank all health professionals, municipalities and school staff who provided assistance with the program.
Received: 29 April 2014 Accepted: 17 April 2015
References
1. Karayiannis D, Yannakoulia M, Terzidou M, Sidossis LS, Kokkevi A. Prevalence of overweight and obesity in Greek school-aged children and adolescents. Eur J Clin Nutr. 2003;57:1189–92.
2. Cole TJ, Bellizi MC, Flegal KM, Dietz WH. Establishing a standard definition for child overweight and obesity worldwide: international survey. BMJ. 2000;320:1240–3.
3. Tzotzas T, Kapantais E, Tziomalos K, Ioannidis I, Mortoglou A, Bakatselos S, et al. Epidemiological survey for the prevalence of overweight and abdominal obesity in Greek adolescents. Obesity. 2008;16:1718–22. 4. Krassas GE, Tzotzas T, Tsametis C, Konstantinidis T. Prevalence and trends in
overweight and obesity among children and adolescents in Thessaloniki, Greece. J Pediatr Endocrinol Metab. 2001;14:1319–26.
5. Christoforidis A, Dimitriadou M, Papadopolou E, Stilpnopoulou D, Katzos G, Athanassiou-Metaxa M. Defining overweight and obesity among Greek chil-dren living in Thessaloniki: international versus local reference standards. Hippokratia. 2011;15:141–6.
Table 3 Comparison of WC50(median) and WC90(cut-off)
for waist circumference (in cm) among 14-year old boys and girls from different countries
Boys Girls
WC50 WC90 WC50 WC90
Norway 67.5 77.8 Norway 64.7 73.3
Turkey 68.9 79.5 Turkey 64.7 73.3
Poland 69.1 81.0 Poland 66.2 77.9
South India 69.4 83.4 South India 70.2 82.5
Greece 72.1 85.0 Greece 67.6 78.7
Germany 72.5 85.3 Germany 71.2 82.9
6. Brambilla P, Manzoni P, Sironi S, Simone P, Del Maschio A, di Natale B, et al. Peripheral and abdominal adiposity in childhood obesity. Int J Obes Relat Metab Disord. 1994;18:795–800.
7. Caprio S, Hyman LD, McCarthy S, Lange R, Bronson M, Tamborlane WV. Fat distribution and cardiovascular risk factors in obese adolescent girls: importance of the intraabdominal fat depot. Am J Clin Nutr. 1996;64:12–7. 8. Savva SC, Tornaritis M, Savva ME, Kourides Y, Panagi A, Silikiotou N, et al.
Waist circumference and waist-to-height ratio are better predictors of cardiovascular disease risk factors in children than body mass index. Int J Obes Relat Metab Disord. 2000;24:1453–8.
9. McCarthy HD, Ashwell M. A study of central fatness using waist-to-height ratios in UK children and adolescents over two decades supports the simple message -‘keep your waist circumference to less than half your height’. Int J Obes (Lond). 2006;30:988–92.
10. World Health Organization. Definition, Diagnosis and Classification of Diabetes Mellitus and Its Complications. Part 1: Diagnosis and Classification of Diabetes Mellitus. 1999. http://whqlibdoc.who.int/hq/1999/
who_ncd_ncs_99.2.pdf. Accessed 21 Feb 2014.
11. Fredriks AM, van Buuren S, Fekkes M, Verloove-Vanhorick SP, Wit JM. Are age references for waist circumference, hip circumference and waist-hip ratio in Dutch children useful in clinical practice? Eur J Pediatr. 2005;164:216–22. 12. Virani N. Reference curves and cut-off values for anthropometric indices of
adiposity of affluent Asian Indian children aged 3–18 years. Ann Hum Biol. 2011;38:165–74.
13. McCarthy HD, Jarrett KV, Crawley HF. The development of waist
circumference percentiles in British children aged 5.0-16.9 y. Eur J Clin Nutr. 2001;55:902–7.
14. Sung RY, So HK, Choi KC, Nelson EA, Li AM, Yin JA, et al. Waist circumference and waist-to-height ratio of Hong Kong Chinese children. BMC Public Health. 2008;8:324.
15. Moreno LA, Mesana MI, Gonzalez-Gross M, Gil CM, Ortega FB, Fleta J, et al. Body fat distribution reference standards in Spanish adolescents: the AVENA Study. Int J Obes (Lond). 2007;31:1798–805.
16. Kromeyer-Hauschild K, Dortschy R, Stolzenberg H, Neuhauser H, Rosario AS. Nationally representative waist circumference percentiles in German adolescents aged 11.0-18.0 years. Int J Pediatr Obes. 2011;6:e129–37. 17. Nawarycz LO, Krzyzaniak A, Stawinska-Witoszynska B, Krzywinska-Wiewiorowska
M, Szilagyi-Pagowska I, Kowalska M, et al. Percentile distributions of waist circumference for 7–19-year-old polish children and adolescents. Obes Rev. 2010;11:281–8.
18. World Health Organization. Physical status: the use and interpretation of anthropometry. Technical Report Series 854. 1995. http://www.who.int/ childgrowth/publications/physical_status/en/. Accessed 21 Feb 2014. 19. Chiotis D, Krikos X, Tsiftis G, Hatzisymeon M, Maniati-Christidi M,
Dacou-Voutetaki A. Body mass index and prevalence of obesity in subjects of Hellenic origin aged 0–18 years, living in the Athens area. Ann Clin Pediatr Univ Atheniensis. 2000;51:139–54.
20. Cole TJ. The LMS, method for constructing normalized growth standards. Eur J Clin Nutr. 1990;44:45–60.
21. Pan H, Cole TJ. LM Schartmaker, a program to construct growth references using the LMS method. Version 2.54. 2011. http://www.healthforallchildren. co.uk. Accessed 5 Jan 2014.
22. Kuriyan R, Tinku T, Lokesh DP, Sheth NR, Mahendra A, Joy R, et al. Waist circumference and waist for height percentiles in urban South Indian children aged 3–16 years. Indian Pediatr. 2011;48:765–71.
23. Brannsether B, Roelants M, Bjerknes R, Júlíusson P. Waist circumference and waist-to-height ratio in Norwegian children 4–18 years of age: reference values and cut-off levels. Acta Paediatr. 2011;100:1576–82.
24. Hatipoglu N, Ozturk A, Mazicioglu MM, Kurtoglu S, Seyhan S, Lokoglu F. Waist circumference percentiles for 7- to 17-year-old Turkish children and adolescents. Eur J Pediatr. 2008;167:383–9.
25. Jackson RT, Al Hamad N, Prakash P, Al SM. Waist circumference percentiles for Kuwaiti children and adolescents. Public Health Nutr. 2011;14:70–6. 26. Haas GM, Liepold E, Schwandt P. Percentile curves for fat patterning in
German adolescents. World J Pediatr. 2011;7:16–23.
27. Fernandez JR, Redden DT, Pietrobelli A, Allison DB. Waist circumference percentiles in nationally representative samples of African-American, European-American, and Mexican-American children and adolescents. J Pediatr. 2004;145:439–44.
28. Eisenmann JC. Waist circumference percentiles for 7- to 15-year-old Australian children. Acta Paediatr. 2005;94:1182–5.
29. Moreno LA, Fleta J, Mur L, Rodriquez G, Sarria A, Bueno M. Waist circumference values in Spanish children-gender related differences. Eur J Clin Nutr. 1999;53:429–33.
30. Maffeis C, Pietrobelli A, Grezzani A, Provera S, Tato L. Waist circumference and cardiovascular risk factors in pre-pubertal children. Obes Res. 2001;9:179–87.
31. Weiss R, Dziura J, Burgert TS, Tamborlane WV, Taksali SE, Yeckel CW, et al. Obesity and the metabolic syndrome in children and adolescents. N Engl J Med. 2004;350:2362–74.
32. Lee JM, Davis MM, Woolford SJ, Gurney JG. Waist circumference percentile thresholds for identifying adolescents with insulin resistance in clinical practice. Pediatr Diabetes. 2009;10:336–42.
33. Zimmet P, Alberti KG, Kaufman F, Tajima N, Silink M, Arslanian S, et al. The metabolic syndrome in children and adolescents - an IDF consensus report. Pediatr Diabetes. 2007;8:299–306.
34. Sijtsma A, Bocca G, L’abée C, Liem ET, Sauer PJ, Corpeleijn E. Waist-to-height ratio, waist circumference and BMI as indicators of percentage fat mass and cardiometabolic risk factors in children aged 3–7 years. Clin Nutr. 2014;33:311–5. 35. Kapantais E, Chala E, Kaklamanou D, Lanaras L, Kaklamanou M, Tzotzas T.
Breakfast skipping and its relation to BMI and health-compromising behaviours among Greek adolescents. Public Health Nutr. 2011;14:101–8. 36. Kosti RI, Panagiotakos DB, Mihas CC, Alevizos A, Zampelas A, Mariolis A,
et al. Dietary habits, physical activity and prevalence of overweight/obesity among adolescents in Greece: the vyronas study. Med Sci Monit. 2007;13:CR437–44.
37. Mäkinen M, Puukko-Viertomies LR, Lindberg N, Siimes MA, Aalberg V. Body dissatisfaction and body mass in girls and boys transitioning from early to mid-adolescence: additional role of self-esteem and eating habits. BMC Psychiatry. 2012;12:35.
38. Organisation for Economic Co-operation and Development. Obesity Update. 2014. http://www.oecd.org/els/health-systems/Obesity-Update-2014.pdf. Accessed 1 Feb 2015.
39. Mallick N, Ray S, Mukhopadhyay S. Eating behaviours and body weight concerns among adolescent girls. Advances in Public Health. 2014;2014:1–8.
Submit your next manuscript to BioMed Central and take full advantage of:
• Convenient online submission
• Thorough peer review
• No space constraints or color figure charges
• Immediate publication on acceptance
• Inclusion in PubMed, CAS, Scopus and Google Scholar
• Research which is freely available for redistribution