APPLIED COMPUTING, MATHEMATICS
AND STATISTICS GROUP
Division of Applied Management and Computing
Cache Visualization Techniques
for Exploring the Performance of a
Distributed System
Alan McKinnon, Mike Cochrane, Clare Churcher and
Roger Jarquin
Research Report No: 00/05
December 2000
R
ESEARCH
E
R
PORT
L I N C O L N
U N I V E R S I T Y
T e W h a r e Wān a k a O A o r a k i
Applied Computing, Mathematics and Statistics
The Applied Computing, Mathematics and Statistics Group (ACMS) comprises staff of the Applied Management and Computing Division at Lincoln University whose research and teaching interests are in computing and quantitative disciplines. Previously this group was the academic section of the Centre for Computing and Biometrics at Lincoln University.
The group teaches subjects leading to a Bachelor of Applied Computing degree and a computing major in the Bachelor of Commerce and Management. In addition, it contributes computing, statistics and
mathematics subjects to a wide range of other Lincoln University degrees. In particular students can take a computing and mathematics major in the BSc.
The ACMS group is strongly involved in postgraduate teaching leading to honours, masters and PhD degrees. Research interests are in modelling and simulation, applied statistics, end user computing, computer assisted learning, aspects of computer networking, geometric modelling and visualisation.
Research Reports
Every paper appearing in this series has undergone editorial review within the ACMS group. The editorial panel is selected by an editor who is appointed by the Chair of the Applied Management and Computing Division Research Committee.
The views expressed in this paper are not necessarily the same as those held by members of the editorial panel. The accuracy of the information presented in this paper is the sole responsibility of the authors.
This series is a continuation of the series "Centre for Computing and Biometrics Research Report" ISSN 1173-8405.
Copyright
Copyright remains with the authors. Unless otherwise stated permission to copy for research or teaching purposes is granted on the condition that the authors and the series are given due acknowledgement. Reproduction in any form for purposes other than research or teaching is forbidden unless prior written permission has been obtained from the authors.
Correspondence
This paper represents work to date and may not necessarily form the basis for the authors' final conclusions relating to this topic. It is likely, however, that the paper will appear in some form in a journal or in conference proceedings in the near future. The authors would be pleased to receive correspondence in connection with any of the issues raised in this paper. Please contact the authors either by email or by writing to the address below.
Any correspondence concerning the series should be sent to:
The Editor
Applied Computing, Mathematics and Statistics Group Applied Management and Computing Division PO Box 84
Lincoln University Canterbury NEW ZEALAND
Cache visualization techniques for exploring the
performance of a distributed system
Alan McKinnon1, Mike Cochrane1, Clare Churcher1 and Roger Jarquin2 1
Applied Computing, Mathematics and Statistics Group Lincoln University
PO Box 84, Lincoln University Canterbury
NewZealand
email: mckinnon/cochrm/[email protected]
2
Aoraki Corporation P.O.Box 20152 Christchurch,
New Zealand
email: [email protected]
Abstract
The cache management of a distributed system has a significant effect on the performance of an application. This paper presents some exploratory
visualizations of cache data from an object-oriented distributed processing system. The visualizations are aimed at helping a developer understand the operation of the cache and how that affects the performance of his application.
Keywords: Information Visualization, Software Performance
1. Introduction
One of the objectives of distributed systems is to achieve performance gains by the placement of data close to where it will be processed. This is often achieved by caching [1], however, the resulting complexity makes the assessment of performance problems difficult. This is especially true for the application developer, who is unlikely to have a complete
understanding of how the system cache management will affect the performance of his or her application. There is a need for visualization tools to allow the application developer to explore these issues.
The visualization of computer system performance has been attempted in a number of
Zealand. It uses a fully object oriented model both for its underlying database and its development environment.
2. The Data
JADE is essentially a client-server system although other deployment options are possible [5]. Being object-oriented, the basic unit of information in the cache managed by JADE is an object instance. These are ordered with the most recently used at the top of the cache and the least recently used (LRU) at the bottom. The latter is the next candidate for swapping out should space be needed for a new object.
Recently, facilities have been incorporated into the JADE kernel to enable information about the current contents of the cache and about requests to the server to be captured from
anywhere on the network. The information available with the requests includes:
time
type of request (e.g. get object, lock object, swap object out, put object to server)
result of request (e.g. cache object updated by lock request)
size of the object involved
ID of the object involved
duration of request (i.e. how long it took)
A typical application involves the processing of large numbers of objects of the same type (e.g. customer). These would be maintained in a collection, which has a collection header and a group of collection blocks containing references to all the customer objects.
3. Exploratory Visualizations
To fully understand the operation of the cache, the data need to be viewed at many different levels. We may wish to see an overview of an application in order to identify the different stages and possible trouble spots. In addition we may want to investigate some areas at a much finer scale to track the flow of individual objects. In this section we describe some of the techniques we have explored to achieve this.
3.1. Overview of an application
One of the original objectives of this project was to gain some understanding of the flow of objects into and out of the cache. One way to see this is to look at the number of objects in the cache over time. Figure 1 shows this information for a test application which traversed a collection of equally sized user objects, loaded a large object then traversed the collection again.
1665 1672 1679 1686 1693 1700 Time
( )
1665 1672 1679 1686 1693 1700
1500 2200 2900 3600 4300 5000
Figure 1. Number of objects in the cache.
The cache is first filled at about 1670sec. At about this time the curve dips down slightly showing that some objects have been swapped out. This will happen only if the cache is full. At this point the cache contains about 2900 objects. However the number of objects rises from there to about 4600. Clearly large objects are being swapped out to make way for a greater number of smaller objects.
A developer can thus identify the different stages of his application. In this case the cache is filling until about 1670sec at which time a high percentage of relatively large system objects begin to be replaced by a greater number of the smaller and equally sized user objects in the collection. At about 1680sec the number of objects in the cache steadies indicating that the cache is swapping similarly sized user objects in and out as the collection is traversed. The sudden dip at time 1683 is where about 600 objects are swapped out to accommodate one very large object. The large object reaches the bottom of the LRU order at about 1697sec and is swapped out. The cache then refills with smaller objects as the collection is traversed a second time.
It is not possible to tell from this graph much about the flow of objects into and out of the cache in terms of whether the objects being swapped out need to be reloaded. This would clearly affect the performance of the system. For example it would be important to know if the objects displaced to make way for the large object at 1683sec in Figure 1 needed to be reloaded within a short time.
3.2. Tracking remote calls for individual objects.
In order to see the affects of reloading objects, a collection of objects with total size slightly bigger than the cache was traversed twice. The remote calls from the cache were monitored and the results are shown in Figure 2a.
2a.
Traversing a collection forwards twice
2b
Traversing a collection forwards then backwards
A
E D
Figure 2. Tracking remote calls on individual objects
The vertical axes in Figure 2 represent each object for which there is a remote call, numbered in the order they were first encountered. Time is along the horizontal axis. The points are coloured according to the type of request. In this case the light (yellow) points (RequestType 1) represent objects coming into the cache, while the dark (blue) points (RequestType 5) indicate a swap.
The first light diagonal line in Figure 2a represents the objects in the collection being read into the cache for the first time. At (A) the first items in the collection begin to be swapped to make room for the last few objects. When the collection is traversed a second time (starting at B) the later objects are successively swapped out to allow for the earlier ones to be
reloaded. The small horizontal distance between the dark blue diagonal line and the next light yellow line indicates that the objects are being swapped out only to be reloaded a very short time later. The final few swaps (C) give an indication of how many objects in the collection cannot be accommodated by the cache – in this case about 10%.
If the developer sees this pattern (closely parallel blue and yellow lines) in a larger application he will be alerted to the fact that he is dealing with a collection slightly larger than the cache size and so may choose to adjust the size of the cache accordingly.
Another way to decrease the number of reloads when traversing a large collection twice is to make the second pass in reverse order. Figure 2b shows this case. While the first few objects
C B
(D) still need to be swapped out to accommodate the later objects, when the second pass is started in the reverse order the objects initially required are already in the cache. There are no remote calls nor corresponding network traffic during the time interval (E) until the traversal needs to reload the objects from the beginning of the collection. The negative gradient of the lines from this point reflects the fact that the objects are being retrieved in the reverse order from which we first encountered them.
3.3. Tracking remote calls on a larger scale
Tracing individual objects gives a very precise description of how the cache is operating. However as the size of the application and/or the number of users increase, pictures such as those in Figure 2 become untenable both from a computational and from a user’s point of view. It is necessary to provide other views of the remote requests at a coarser scale. One way is to present statistical data within time intervals.
Figures 3 shows the number of different request types (in this case predominantly Gets and Swaps) in each time interval.
0 100
Re que s t Fre que ncy By Re que s t Type
0 100 0 100 0 100 0 100
1138.590 1145.08 1151.58 1158.08 1164.58 1171.07 100 Time (s) Get Lock Put GetOID Sw ap Other 0 50 100
Re que s t Fre que ncy By Re que s t Type
0 50 100 0 50 100 0 50 100 0 50 100
1175.550 1181.12 1186.69 1192.26 1197.83 1203.41 50 100 Time (s) Get Lock Put GetOID Sw ap Other 3a.
Traversing a collection forwards twice
3b
Traversing a collection forwards then backwards
Figure 3. Number of different types of remote requests
In Figure 3a we can see that the number of Gets in each time interval is fairly constant reflecting the fact that we are reading in the objects in the collection at a steady rate. The number of swaps initially varies depending on the differing sizes of the objects in the cache when the monitoring starts. In the later stages of the traversal where we have started
swapping out user objects, the jaggedness reflects the fact that every so often a relatively large sized collection block object is swapped out.
In Figure 3b we see the gap in remote calls where the user objects are already in cache at the start of the backwards traversal.
Neither of these pictures alerts the developer to the fact that objects are being reloaded. Figure 3a would look similar if the traversal involved one very large collection, a number of different smaller collections (of the same sized objects) or, as in this case, a collection larger than the cache being traversed twice.
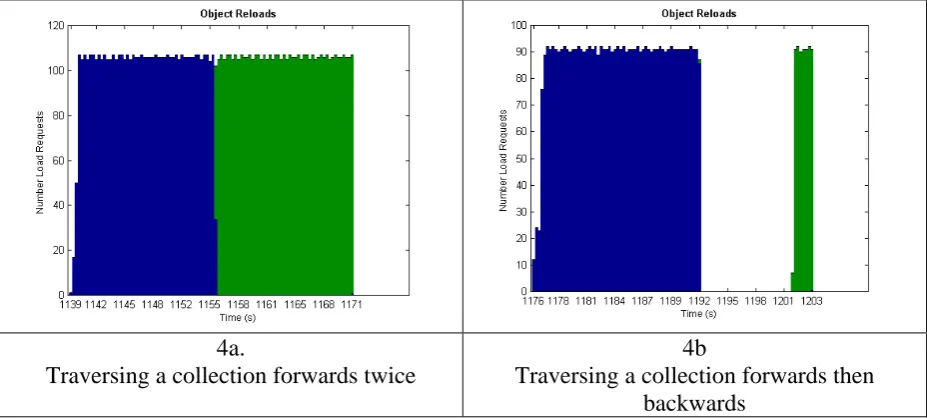
The cost in performance comes when objects are swapped out only to be reloaded within a short time. Figure 4 shows the number of objects being loaded into the cache. The colour represents the number of times that the object has been in the cache before. The dark (blue) rectangle on the left represents objects being loaded for the first time while the lighter (green) rectangle represents objects being reloaded.
4a.
Traversing a collection forwards twice
4b
Traversing a collection forwards then backwards
Figure 4. Numbers of object loads (dark) and reloads (light).
A developer can detect stages in his application where significant numbers of objects are being reloaded (in this case by the large lighter rectangle). He can then obtain a more detailed view (as in Figures 2) of the behaviour of individual objects to determine if there is any way to improve performance. Figure 4b clearly shows the reduced number of reloads when the second traversal of the collection is in reverse order.
3.4. Detecting inefficient locking
Another common inefficient programming feature that was identifiable from the
visualizations was where one object was being repeatedly locked and unlocked during a processing sequence. This occurs in the situation where a collection object is being
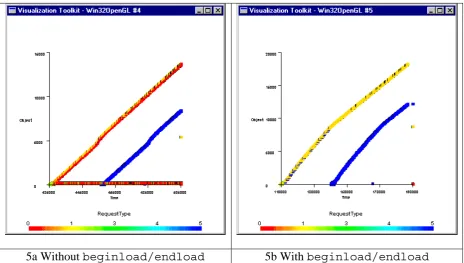
repeatedly accessed. For example if an order refers to a number of products we may wish to check that each of these products is in a collection of available items. This would involve accessing the collection header object for the available items repeatedly and by default applying and removing a lock each time. JADE has a feature beginload/endload that will prevent the locks being removed and reapplied. This can be overlooked by developers. The two pictures in Figure 5 demonstrate this problem.
5a Without beginload/endload 5b With beginload/endload
Figure 5. Repeated access to a collection object.
In Figure 5 the topmost diagonal line (yellow) represents the objects in the collection being loaded into the cache (RequestType 1). The adjacent red line represents the unlocking (RequestType 0) of each object after it has been accessed. The lock requests (green) are mostly obscured by the orange unlock requests. The darker lower line is the swaps (RequestType 5) to accommodate later objects once the cache is full.
In Figure 5a the successive locks (RequestType 3) and unlocks (RequestType 0) on a single object can be seen as a horizontal line along the bottom of the picture (the collection header object being one of the earliest objects encountered). Any horizontal line such as this can alert the developer to a possible means of making the code more efficient. Figure 5b shows the result of applying the beginload/endload feature to prevent the premature release of locks.
4. Discussion
In a distributed system the management of the cache has a major impact on the performance of an application. Developers will benefit from gaining a more detailed understanding of how their applications interact with the underlying system, and how this information can be used to improve the performance of their applications. This work is exploratory in nature and has addressed only a few of the issues involved. Eventually it is hoped that a complete set of tools will be constructed to enable the developer to view the system at a number of different scales.
The amount of data generated by a typical application makes it essential to provide
visualizations that give an overview of the system, before trying to understand the interactions at the level of individual objects. Stolte et al [4] have pointed out that before we can look at any performance problem in detail we need to know “where to look”. Determining where the problem is must be a simple process so that the developer can readily recognise the patterns
8
which reflect various performance problems. In the present situation, observing the total count of objects in the cache (Section 3.1) provides a rapid overview. It is hoped that with some experience the developer will be able to recognise different stages in the application in order to identify the areas requiring more detailed investigation. Another technique which is tenable for large amounts of data is a set of histograms displaying statistics of various
parameters within specified time intervals. In Section 3.3 we showed the numbers of different types of remote requests in this way. This gives an overview of the application and is useful for providing context for more detailed investigations. It would be interesting to include in this data the number of repeated gets for an object, the number of repeated locks or other measures which could highlight possible inefficiencies in the code. By altering the size of the time intervals it would be possible to view the system at different levels of detail. To understand the data at a more detailed level it becomes necessary to track the activity of individual objects or groups of objects. Figures 2 and 5 are examples of these types of
techniques. It is possible to observe the repeated locks on an object or the fact that objects are being swapped out and reloaded into the cache within a short time. There are many other measures provided by the cache monitoring tool which we have not considered in this paper. For example there are data about the class and size of the objects, the duration of the call and information about the different nodes when concurrent use is considered. By changing the variables displayed in graphs similar to Figures 2 and 5 we can see the relationships between these parameters. For example, we could determine which types of requests are most
expensive in time, the relative sizes of the objects in the cache, how many locks result in an update and the different activities on different types of object (e.g. system or user objects). Further work is required to determine which of these views will be helpful in different circumstances.
We hope to define a set of techniques that will enable the developer to be alerted to problems, find the areas of concern, and determine the low level causes. To this end we intend to construct a set of typical programming examples (such as the collection traversal described in this paper) and investigate which techniques are most helpful for revealing problems. An important component of this will be the involvement of developers in the evaluation of the techniques.
References
[1] E.Simon Distributed Information Systems. McGraw Hill, 1996.
[2] E. van der Deijl, G. Kanbier, O.Temam and E.D. Granston. A Cache Visualization Tool. IEEE Computer 30(7), pp71-78, July 1997.
[3] E. Shaffer, D.A.Reed, S.Whitman and B. Schaeffer. Virtue: Performance Vsualization of Parallel and Distributed Applications. IEEE Computer 32(12), pp 44-51, December 1999.
[4] C.Stolte, R.Bosche, P.Hanrahan, M.Rosenblum. Visualizing Application Behaviour on Superscalar Processors. Proceedings of the 1999 IEEE Symposium on Information Visualization, San Francisco, pp 24-29, October, 1999.