Research Article
Elementary Time Frequency Analysis of
EEG Signal Processing
Parag Puranik
1,*, Dr. R.V. Kshirsagar
1and Sagar Motdhare
11
PIGCE, Nagpur
Abstract
EEG analysis is used as a tool for medical diagnosis of various diseases related to brain like epilepsy, dementia, brain disorders like stress etc. To identify such neural disorders it is essential to process these signal because of the non-stationary behavior. The time frequency analysis of EEG signals provide the correct visualization of EEG signals to extract the various rhythms of frequencies like alpha, beta, gamma waves. The Wavelet transform is used to carry out the time frequency analysis of EEG signal. Wavelets are used to analyze the EEG signals correctly. Their applications include seizure analysis, modeling of neuron potentials etc. To perform these applications it is necessary to perform the mathematical operations on EEG signal by windowing, filtering and then finally reconstruction.
Keywords: EEG, Morlett Window, Wavelets, montages, Wavelet Transforms.
Received on 01 December 2017, accepted on 11 May 2018,published on 23 July 2018
Copyright © 2018 Parag Puraniket al., licensed to EAI. This is an open access article distributed under the terms of the Creative Commons Attribution licence (http://creativecommons.org/licenses/by/3.0/), which permits unlimited use, distribution and reproduction in any medium so long as the original work is properly cited.
doi: 10.4108/eai.13-7-2018.155081
1. Introduction
EEG is a tool used to study the brain activities. The need to develop the EEG as a tool is used for detecting the various brain disorders like stress, epilepsy, dementia etc. EEGs are use to identify the neural activities of the brain. These neural activities are diagnosed by multiple-electrode EEG machines which are placed according to the standard montages. The EEG signals are time domain signals but these signals provide other information related to brain in frequency domain with imaging tools to visualize topographies. The time frequency analysis of EEG signal is performed using Wavelet transforms to visualize the signals correctly. Modeling and localization of EEG signals is important to obtain the correct information about these signals after capturing through EEG electrodes. The exact monitoring of patients is required for real time applications provided by EEG sequences. The major information is extracted by the sleeping brain and therefore sleep EEG is carried out. [10].
EEGs are basically non-stationary signals. The analysis of stationary signals is easy and can be easily represented in time or frequency domain. The frequency domain analysis is
performed out using discrete Fourier Transform (DFT), discrete cosine transform (DCT) etc. But these tools for analysis has an disadvantage that spectrum of the signals is degraded due to short term windowing analysis and fixed transforms. Parametric estimation methods of EEG signals like Auto-regression (AR) models have an advantage over DCT of correct representation of frequency domain analysis but has disadvantage of improper estimation of model parameters since the measured signal is of very limited length. EEG signals are statistically non-stationary signals. Because there are many abnormal events occurring while capturing EEG signals. [1]
EEG signals are statistically non-stationary signals. Because there are many abnormal events occurring while capturing EEG signals the analysis of EEG signals become important. During this analysis frequency domain parameters are incorporated over the specified interval and do not calculate the individuality of the signal correctly. Therefore, time frequency analysis is needed. In short, to analyze the EEG and extract the correct frequency components and rhythms time frequency analysis is worked out. [1][2][9]
The paper is divided as follows: Section –II depicts the basic EEG and placement of electrodes as per the
on Pervasive Health and Technology
international standard. Section – III examines the Wavelet transform and need for time frequency analysis of EEG signals. Section – IV describes the results obtained and Section – V represents the conclusion.
2. Basics of EEG Recordings
2.1. EEG Recording
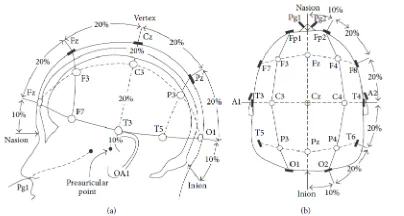
EEG analysis and recording procedure for patients is shown below in figure 1. EEG is done on 24 channel RMS EEG machine with 10-20 electrode system. The figure 2 shows the placement of electrode. 24-recording electrodes including ground and system reference for EEG recording for patients are used; these electrodes were located according to 10–20 electrode system as follows: Fp1, Fp2, F7, F3, Fz, F4, F8, A1, T3, C3, Cz, C4, T4, A2, T5, P3, Pz, P4, T6, O1, and O2. The 10-20 electrode placement system and its three dimensional top view and side view is shown in figure.3.
Figure 1.EEG Recording Procedure
Figure 2.EEG Recording Procedure
Figure 3. (a) 10-20 electrode placement system (b) 3 dimensional side view and top view
2.1. EEG Rhythms
To treat with EEG signals and to extract the correct and useful information from the EEG diagnosis, the rhythmic activities of EEG is to be considered. Clinical EEG wave forms amplitude that is typically between 10 and 100 v and at a frequency range of 1Hz to 100Hz. EEG is classified into the following five rhythms according to their frequency bands.
(1) Alpha ( ) wave: this regular wave is present in healthy adults while they are conscious comfortable, and eyes closed. It arises at a frequency range of 8Hz to 13Hz with a normal voltage range of around 20 v to 200 v. waveform is mostly pragmatic in the posterior region of the head.
(2) Beta ( ) wave: the frequency of waves ranges from 13Hz to 30Hz, and voltage range is 5 v to 10 v. waves appear with additional excitation of the central nervous system, boost with awareness and alertness. waves are observed in the parietal and frontal region of the scalp.
(3) Theta ( ) wave: the frequency range of wave is 4Hz to 7Hz. This waveform is important during sleep, stimulation in older children and adults, exciting stress, and idling. wave is recorded across the temporal and parietal region of the scalp with an amplitude range of 5 v to 10 v. This wave has been linked to activities such as focusing, awareness, psychological effort, and stimulation processing.[2].
(4) Delta ( ) wave: the lowest frequency of wave is less than 3.5Hz, and its voltage ranges from 20 v to 200 v. wave occurs during deep snooze, in newborn, and with serious organic brain diseases. This waveform can be recorded frontally in adults and posteriorly in children.
(5) Gamma( )wave: the frequency of wave ranges from 30Hz to 100Hz. This waveform is recorded in the somatosensory cortex in the case of cross model sensory processing, during short-term memory to distinguish matter, sounds, perceptible impression, and in pathological case because of cognitive decline.[2].
The recorded EEG needs successive stages of processing the signal to extract important indications from the EEG signal of stress patients, and these indications reflect brain medical
2 onPervasive Health and TechnologyEAI Endorsed Transactions
changes. The main stages of EEG signal processing are denoising, feature extraction, and classification.
i. EEG recording: EEG signals are acquired
ii. EEG processing: EEG signals are pre-elaborated in order to improve the noise-signal rate.
iii. Features extraction: relevant features are extracted, in order to detect specific waveforms (Time-Frequency analysis)
iv. EEG classification: subjects’ EEG signals are identified as belonging to appropriate classes [8][10].
3. Time-Frequency Analysis of EEG
signals
As stated, EEG signals are non-stationary. To extract the correct information from these signals it is necessary to perform the analysis. To perform the analysis EEG is considered as stationary signals for very short durations/intervals. EEG signal allocation is considered as Gaussian curve which calculates the mean and covariance for each segmented waveform. EEG signals are seen during the sleep, wakefulness, during eye blinking i.e. where the alpha rhythms are strong. There is a change in distribution of the signal and this can be measured by the Gaussian process. The non-Gaussian parameters can be estimated by skewness, kurtosis, negentropy and Kulback-Laiber (KL) distance. [1].
Skewness is a evaluation of equilibrium of the distribution and is defined as follows for real signals
(1)
Where µ and σ are mean and standard deviation
respectively
Kurtosis is measure to detect whether the data is sharp or even relative to the normal distribution. The kurtosis is defined for normal distribution as:
!! " 3 (2)
The negentropy is defined as :
$ %& ' ( ')*+,, " ( ' (3) Where ')*+,, is a Gaussian random signal with covariance as x(n) and H(.) is differential entropy defined as:
( ' - . '55 /013 2 4' (4)
Where . ' is the signal distribution and negentropy is always non-negative.
The KL distance between two distributions p1 and p2 is defined as:
6 - .55 27'2 8/01339 9! ! 4: (5)
EEG signal segmentation is carried out since this is useful for clinicians and neurologists. The segmented EEG signals are stationary signals with time frequency statistics. EEG signals can be divided into three segments, posterior, occipital, a postictal segment which is highly beneficial to obtain the various rhythmic frequencies of EEGs.[1][2]
While segmentation of EEG signals, the time frequency characteristics of the signals can be oppressed. This causes the variation measurements between the adjoining EEG frames. This is calculated based on autocorrelations for segment of length N defined as: [1]
; , = >@ A ' / B = B ' / B = ,1 0, @ " 1
D 2 E
FGH
0 @, @ B 1
I
(6)
The windowing sequence using Hanning window is obtained for EEG segmented signal and auto-regressive based modeling of the signals is performed. The prediction error of the AR model [1] is defined as:
, = ' . = " ∑3MG2LM = ' " , = (7)
Where p is the forecast order and LM = , k=1,2…p are the prediction coefficients. The main aim is to minimize the error between two samples/segments and windows of the EEG signal.
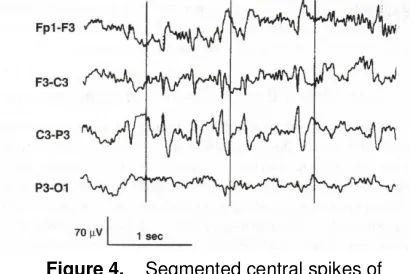
The segmented central spikes of the EEG signal is shown below in figure 4. The segmented EEG shows the frontal electrodes data, frontal and central and posterior and occipital montage.
The short time Fourier transform (STFT) over a sliding window [1] is performed as follows:
, N ∑5 ' O N " O PQR
RG 5 (8)
Where n refers to the position of the window. The spectrogram is defined as:
, N |T , N |U (9)
The windowing function is chosen properly for the estimation of power spectrum. For correct time resolution
Hanning window of various durations of 1 and 2 msec duration is obtained.[1].
3.1. Wavelet Transform
The important parts and coefficients can be better focused the signal components of EEG in time-frequency gap. This is required to develop the need between time and frequency components. Therefore, the main aim of wavelet transform by Morlet window is to have clarity time relative to the sampling period of EEG. The continuous wavelet transforms are analyzed for this purpose. The Morlet continuous wavelet transforms is given as:
V L, W √*2 - Y Z ∗ \55 ] ** ^ 4 (10) Z is the analyzing vector, a(>0) is the scale parameter and b is the position parameter.
This version is linear and is invariant under translational and dilations. Morlet’s wavelet is a complex waveform defined as
Z √U_2 ]/UaPU_bc] (11)
The above wavelet is divided into real and imaginary parts of sine and cos function; where b0 is constant.
3.1. Wavelet Transform using Fourier
Transform
Consider the scalar product dc {Y Z " for continuous wavelets. If Z is band limited to half of the sampling frequency, the data can be properly sampled. The data at the decision j=1 is as follows:
d2 Y .2UZ ]U" (12) And d2 can be computed from dc with discrete time filter with the frequency response H(ώ).
( N f
g UQ
g Q hY |N| < Nj
0 hY Nj≤ |N| <2U
I (13)
Therefore the coefficients at the next scale can be calculated as follows:
lma2 N lP N ( 2PN (14) The cut-off frequency is reduced by twice at each level [1], thereby allowing to reduce the number of samples. The Wavelet coefficients at the scale j+1 are
Pa2G 〈Y , 2 Pa2〉Z 2 Pa2 " (15)
And can be computed from Cj as follows:
VPa2 N lP N q 2P N (16) Where G is the discrete time filter:
q N f
g UQ
g Q hY |N| < Nj
0 hY Nj≤ |N| <2U
I (17)
4. Implementation
The following flowchart shows the implementation of time frequency analysis using Wavelet Transform for EEG signals.
The EEG signal is recorded as shown in figure 1 and 2. The EEGs obtained contain lots of artifacts. Also EEGs are son-stationary signals. Therefore, to extract correct information from these EEGs signals and to carry out time frequency analysis windowing of the signals is carried out. For this Hanning window is used. Also Haar transforms are used to calculate the statistical analysis. Time frequency analysis is carried out using wavelet transforms using Morlet window. This is done for spectrogram calculations. Then wavelet transforms are analyzed using Fourier transforms. And lastly original EEG is reconstructed. This is done for all samples of EEG.[1].
The reconstruction algorithm works as follows at low resolution:[1][2]
i. Compute the fast Fourier transform of the signal
ii. Set ‘j’ i.e. data resolution and Compute the FFT of the wavelet coefficients at scale ‘j’(Equations (14) and (15)
iii. Obtain the product of wavelet coefficients Wj by G. (G=filter)
iv. Calculate the Inverse Fourier transform considering Wj and G
v. Then perform j=j-1 and proceed for step3.
5. Results
The continuous wavelet transforms (CWT) is used to analyze how the frequency content of a signal changes over time. (CWT) is used to analyze signals jointly in time and frequency.
The figure 6 shows the wavelet transform and inverse Wavelet transform of the EEG obtained from patient
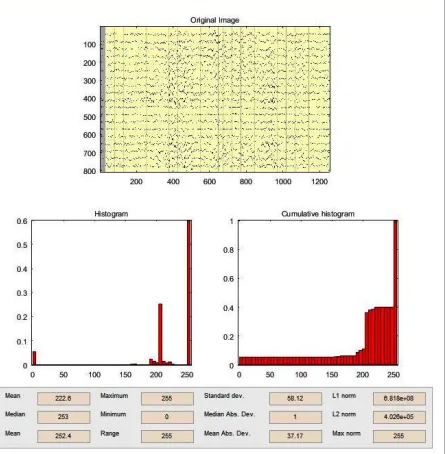
Figure 7 shows the wavelet transform using Morlet window and its histogram analysis which provide the statistical data of mean, standars deviation, median etc for all sampled values of EEG signals. The EEG signal of 1200 msec duration is analyzed. This signal is sampled and windowed for each 200 msec duration. And then its continuous wavelet transform is calculated. The original signal for each sample is reconstructed using the stated algorithm. This provides the time frequency analysis and wavelet coefficients.
Figure 5. Flowchart of Implementation
Figure 6. Wavelet and Inverse Wavelet Transform of EEG Signal
Figure 7. Wavelet Transforms and Histogram Analysis with statistical analysis
6. Conclusion
In this paper, the basic concept of EEG signal processing which include EEG signal segmentation, signal transform, time frequency analysis using Wavelets is covered. The wavelet transform and reconstruction algorithm is based on Acquisition of EEG Signals
using electrode placement
Windowing of EEG signal for short duration
Time frequency analysis using Wavelet transform
Calculation of spectrogram
Wavelet transform using Fourier tansform
Reconstruction of the original signal.
Any other samples to be calculated
6
certain requirements which are used for specific applications like seizure analysis, stress management etc. These are the future scope of the work wherein the EEG signal processing will be carried out. The time frequency analysis provides the statistical data of EEG signals which will be beneficial to classify the EEG signal.
Acknowledgements.
The authors would like to thank Saeid Sanei and J,A, Chambers the authors of the book “EEG signal Processing” for providing the idea of the implementation of this paper. Further authors are thankful to Dr. Karandikar, MD, neurologist for providing the medical background help.
References
[1] Saeid Sanei, J.A. Chambers, “EEG Signal Processing”, Center of Digital Signal Processing, John Wiley and Sons Ltd.
[2] Bassel Abou-Khalil, Karl Misulis, “Atlas of Textbook of EEG & Seizure Semiology”, Textbook of Elsevier. [3] Amjed S. Al-Fahoum and Ausilah A. Al-Fraihat, “Methods
of EEG Signal Features Extraction Using Linear Analysis in Frequency and Time-Frequency Domains”, Hindawi Publishing Corporation ISRN Neuroscience Volume 2014, Article ID 730218.
[4] Davide V. Moretti, “Neurophysiology in Alzheimer’s Disease and Dementia”, EDITORIAL published: 27June2016, Frontiers in Aging Neuroscience.
[5] Alida A. Gouw1,2 and Cornelis J. Stam, “Electroencephalography in the Differential Diagnosis of Dementia”, Epileptologie 2016, pp.-173-186.
[6] Anthoula Tsolaki, Dimitrios Kazis, Ioannis Kompatsiaris, “Electroencephalogram and Alzheimer’s Disease: Clinical and Research Approaches”, Hindawi Publishing Corporation International Journal of Alzheimer’s Disease”, Volume 2014, Article ID 349249
[7] Ales Prochazk, Jaromir Kukal, “ Wavelet Transform used for feature extraction and EEG signal Segments classification”, Institute of chemical technology, Prgaue, http://dsp.vscht.cz, 2012
[8] Neep Hazarika, Jean Zhu Chen, “ Classification of EEG signals using the Wavelet Transform”, Elsevier Signal Processing Journal, Issue-1, Volume 59, May 1997, pp.-61-72.
[9] Costanza D. Avanzo, Vincenza Tarantino, Patrizia Bisiacchi,” A Wavelet Methodology for EEG time-frequency Analysis in a Time Discrimination Task”, International Journal of Bioelectromagnetism, Vol.11, No.4, pp.-185-188, 2009.
[10] A.H. Siddiqi, H. Kodal Sevindir, C. Yazici, “Spectral Analysis of EEG signals by using wavelet and Harmonic Transforms”.
EAI Endorsed Transactions onPervasive Health and Technology