Exploiting Reverse Correlation for the Generation of
Virtual Characters from Personality Traits
Fabrizio Nunnari
SLSI group DFKI / MMCI
Campus D3.2 - 66123 Saarbrcken, Germany Email: [email protected]
Alexis Heloir
SLSI group DFKI / MMCI
Campus D3.2 - 66123 Saarbrcken, Germany Email: [email protected]
Abstract—Judging from appearance, most people assign per-sonality traits to virtual characters. This paper presents a platform capable of generating online Reverse Correlation experi-ments for studying the relations between the appearance of virtual characters and their assumed personality. The method used by the platform, which leverages crowdsourcing and interactive genetic algorithms, can be used to generate virtual characters starting from a description of their personality. The platform requires a training phase to gather the beliefs and convictions that people have when judging a person from his/her appearance. The method is validated through two experiments. The first experiment provides evidence on how effective the method is in improving the mapping through genetic evolution. The second experiment illustrates how the method relates to the technique of Reverse Correlation to infer which physical attributes contribute to the perception of a specific trait.
Keywords—Reverse correlation, virtual characters, interactive genetic algorithms, crowdsourcing.
I. INTRODUCTION
The believability and thus the effectiveness of a virtual character can improve by increasing the coherence between its aesthetics and its duty [1][2]. A virtual character is believable when it fulfills the expectations of the audience in associating its personality to its appearance and to its behavior [3]. These expectations are due to the tendency of people to judge others according to their appearance [4]. The more these expectations are fulfilled, the better the character will be accepted by the audience.
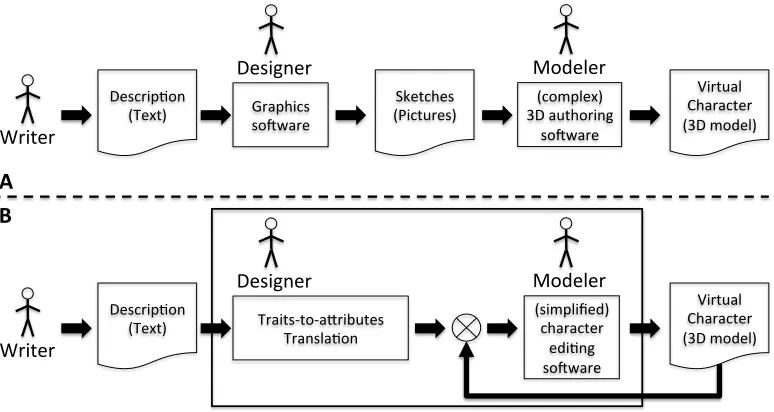
The creation of original characters which fit a specific domain and audience requires the design of an appearance which matches the characters personality or inner characteris-tics. It is an artistic task. Character Design is the discipline of giving a believable visual aspect to a character starting from its description and context of operation. The production of virtual characters, depicted in Figure2A, can be summarized in three stages: description, design, and crafting. In the description
stage, a writer describes the personality of the character,
lists its habits, and gives him a storyline. In the design
stage, a designer provides sketches of the character: the body
proportions, close ups of the face, details of the body, hair cut, and habitual postures. The outcome of the design stage is used in the crafting stage, where a highly specialised 3D author, the
modeler, uses complex software (such as: 3D Studio, Maya, and Blender) to create the skin, the clothes, and the skeletal structure of the character.
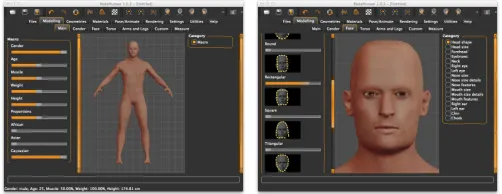
Fig. 1. MakeHuman: an attributes-based virtual character authoring tool.
In the last years, the industry has provided a number of software to ease the crafting stage. Some video games
(e.g.: Oblivion1) and stand-alone tools (e.g.: MakeHuman2
and Fuse3) allow users to generate and customize virtual
characters by using simple user interfaces composed of a set of sliders. Starting from a default androgen character, each slider controls the deformation of macro characteristics (such as: gender, age, and height) or specific body parts (such as: torso height, finger length, hips width, and distance between eyes). For example, with about 200 sliders, MakeHuman (see Figure 1 for an example) gives the possibility to generate a fully skinned and animatable character in a fraction of the time normally required via traditional hand-crafting. This approach shifts the description of the virtual character from a vertex space to an attribute space. However, little has been done to facilitate the second stage, the design process, which provides the connection between the character description and its appearance.
The method presented in this paper, depicted in Figure 2B, aims at easing the design stage. Given the description of a character, the designer translates the description into a
profile, expressed in terms of personality traits. The Traits-to-attributes Translation module then translates the profile into a set of physical attributes. The resulting physical attributes are used as an input for the character generation module. The physical attributes enforced by the translation module are likely to be only a subset of all the available ones. The remaining attributes, which do not influence the perception of the traits of the character, are available to the modeler for further customization.
1http://www.elderscrolls.com/oblivion/ – 30 Apr. 2015 2http://www.makehuman.org/ – 30 Apr. 2015 3https://www.mixamo.com/fuse – 30 Apr. 2015
INTETAIN 2015, June 10-12, Torino, Italy Copyright © 2015 ICST
Writer&
Designer& Modeler&
Graphics& so4ware& Descrip6on&
(Text)& (Pictures)&Sketches& 3D&authoring&(complex)& so4ware&
Virtual& Character& (3D&model)&
Writer&
Designer& Modeler&
TraitsCtoCaDributes& Transla6on& Descrip6on&
(Text)& (simplified)character&
edi6ng& so4ware&
Virtual& Character& (3D&model)&
A"
B"
Fig. 2. A (top): The virtual character generation classical workflow. B (bottom): The thick bordered rectangle marks the method proposed in this paper. It includes a module translating personality trait profiles into set of physical attributes. The attributes are the input of a character generation software which is based on a simplified editing paradigm. The virtual character can be iteratively refined after the initial creation.
Crowdsourcing is an effective method to accomplish some tasks that machines can not achieve. It is suitable for tasks requiring human knowledge and skills which software methods can not represent and process. In this work, crowdsourcing, in conjunction with Interactive Genetic Algorithms, are means to train the Traits-to-attribute Translation module. The training starts by generating a set of random characters with random values for the physical attributes. The characters are shown
to a crowd of people which are asked to vote the virtual
characters along personality traits. The votes of the crowd are used to compute a mapping between the traits and the physical attributes, so that an end-user can search for a char-acter by providing the desired personality. Interactive genetic algorithms help to improve the quality of the mapping as long as votes are collected. The virtual characters are the individuals of a generation; their physical attributes are their genetic code. The votes of the crowd contribute to calculate the fitness function. The individuals with highest fitness value are selected to migrate to the next, better, generation, while other individuals are generated by mutation, cross-over, or randomly.
The data collected from the crowd are also suitable to infer correlations between physical attributes and the perception of personality traits: a practice known from psychology as Reverse Correlation (see related work in Section II). However, existing approaches find correlations between personality traits and morphological attributes which do not have clear semantic description, or at least are not suitable for manual hand-crafting of the virtual character. The method proposed in this paper focuses on finding correlations with the physical attributes used by modelers to author virtual characters, i.e., the input of the simplified, attributes-based, authoring software. This method enables a mixed authoring approach, where the generation platform establishes the physical attributes needed to match a desired personality. After the generation, the modeler can still modify the remaining attributes.
In summary, this paper presents a method for the creation of believable virtual characters from personality traits, whereas
existing approaches require geometrical information as input. The method leverages a crowd of online participants to extract information about their convictions when associating a person-ality profile to a physical appearance. The proposed method generates virtual characters who fulfill people’s expectations in matching the appearance with the personality. This method aims at easing the work of the character designer. The gen-erated character can be further edited by the 3D author using the simplified character generation paradigm. Also, the paper shows how the votes collected from the crowd can be used to find correlations between traits and physical attributes. The method presented in this paper is already implemented in an
online platform called DeEvA4 (Depot of Evolving Avatars).
This paper is organised as follows. Section II presents a short description of Interactive Genetic Algorithms, followed by research in the fields of virtual characters generation and reverse correlation. Section III describes the crowdsourcing method to generate virtual characters from traits descriptions. Section IV presents two experiments; the first shows the effec-tiveness of the evolutionary approach; the second shows how to infer which physical attributes contribute to the perception of a trait. Finally, Section V concludes the paper.
II. RELATEDWORK
A. Interactive Genetic Algorithms
Genetic Algorithms (GAs) have been employed over the last twenty years [5]. They have been designed to find approx-imate solutions for complex problems where the search space is too big for a systematic exploration. A Genetic Algorithm starts by creating an initial set of random solutions, called
individuals. Then, the algorithm modifies the individuals mim-icking the evolution of living species towards better beings. In nature, a better being is one that better fits its environment. In problem solving, a better being is one that more closely matches the criteria of a desired solution.
Solving a problem with genetic algorithms requires the
definition of a genetic representation of an individual and a
fitness function. The former is used to univocally represent the characteristics of an individual. The latter gives an evaluation of how well an individual matches a desired target solution.
A gene is one of the possible values that can compose a
genetic sequence. An instance of the genetic representation of an individual is called genotype. The surfacing realization of the genotype is called phenotype.
A set of individuals in a given moment is calledgeneration. The first generation is randomly generated. To create a next generation, the fitness function is calculated for each of the individuals. To improve the quality of the next generation, a certain percentage of the best individuals of the current generation, i.e., the ones with higher fitness values, iselected
to pass directly to the next generation. Some of the elected
individuals are mutated by randomly changing a segment of
their genetic code. Other individuals are combined (in couples,
or more) and a cross-over is performed, i.e., segments of the
parents genetic code are mixed together to generate one child, thus simulating reproduction by coupling.
A genetic algorithm converges to a good solution when at each evolution step the average fitness value of the new generation increases. The convergence of the algorithm is not guaranteed; it depends on the choice of a proper fitness function together with the choice of the election, mutation, and cross-over percentages. These latter values are normally determined by a human operator through trial and errors. The computation of new generations ends when one of the following two conditions are fulfilled: first, the fitness value of one of the individuals reaches a satisfying value, which means that a good approximate solution is found; second, the maximum computation time elapses. In this traditional approach of genetic computation, the user evaluates the best solution of the latest generation and accepts it. If the solution is not satisfactory, the user fine tunes the election, mutation, and cross-over percentages, and re-runs the evolution aiming at better results. However, for some problems a fitness function cannot be identified because it is related to tasks that only humans can accomplish (such as evaluating the quality of a picture). This has led to the introduction of Interactive Genetic Algorithms (IGAs): in this approach genetic algorithms are run by asking humans to perform an evaluation for each individual of a generation. The evaluation is directly used as fitness value or is used to calculate it.
B. Character Generation
Vieira et al. [6] used genetic algorithms to generate a component of virtual characters: the mesh for the face. The purpose of their system was to generate a consistent repository of realistic faces starting from a limited initial reference set. The faces were described as deformation of a default one. The genotype in this case is the sequences of face modifiers (e.g., width of the eyes, height of the front, and bending of the nose). Their approach in using modifier values as genes is similar to the one proposed in this paper, but their system does not define a mapping from a model to the generated faces.
The interactive variant of genetic algorithms (Interactive Genetic Algorithms, IGAs), where the user assists the
algo-rithm in the evaluation of the fitness function, has also been applied to computer graphics research.
Sims [7] applied IGAs to the generation of artistic 2D and 3D images. In his approach the genes were lisp primitive operators, and the genotypes lisp functions. The phenotypes were generated 2D or 3D images. For each generation, the user had elect images best fitting an imaginary goal or an aesthetic appreciation. In another application by Graf and Banzhaf [8], the genotypes described car components (such as: wheel, doors, and windows), and the phenotypes were images of cars, evolved by combining or mutating the components of the cars in the previous generation. Again, the user had to elect the car best fitting his personal taste.
De Melo and Gratch [9] used IGAs to investigate the role of post-filter color manipulation in the perception of joy and sadness. The genotype was the sequence of color filters to apply, the phenotype was the color altered version of two reference images of a male and a female virtual characters. Differing from other approaches, the users did not have to simply elect an individual (an image) as fittingor non-fitting: they had to score each image according to the joy and sadness dimensions. Similarly, in the generation method proposed in this paper users have to provide a score for each trait of the virtual characters. The use of genetic algorithms aims at improving the correlations between the physical attributes and the target trait at each evolution step. The use of their interactive variant aims at inferring correlations as part of the calculation of the fitness function. The method employed by de Melo and Gratch to collect votes in a generation resembles the Reverse Correlation technique used in the field of Psychology, introduced in the next section.
C. Mapping traits to physical attributes
People naturally have the tendency to judge others based on their appearance. Back in the 1920s, Lombroso tried to find a method to analytically correlate physical attributes to behavioral tendencies [10]. He investigated the tendency of a person to be a criminal with respect to the shape and dimension of his head and face. Sadly, these beliefs have been used in law courts to strengthen the prosecution of individuals. It has been later proved that no correlation exists between skull morphology and line of conduct [11].
expressions. The same results are partially reproduced in the experiment described in Section IV-A.
These recent studies infer their findings via a Reverse Correlation technique. This technique consists of collecting the judgement of a number of subjects who are proposed to look at the face, or body, of a real person or an avatar. The subjects will then classify the material in relation to a specific de-scription model, such as the OCEAN model of personality, or the trustworthiness/dominance traits. The Reverse correlation technique was earlier introduced by Mangini et al. [16] to find the elements of a human face which influence the perception of gender and happiness. It was also used to distinguish between a pair of similarly looking subjects. The same technique has also been used by Dotsch and Todorov [17] to find the parts of the face concurring with the judgment of trustworthiness and dominance.
Virtual character are a very effective tool to collect in-formation about the aesthetics and assumed personality traits. Oosterhof et al. [15] generated the faces for the experiments through an automatic generation of virtual characters, rather than using pictures of real people. This approach had the advantage of enabling the experimenter to select what phys-ical attributes include in the judgment, while blocking other possibly correlated attributes.
The studies presented above aimed at identifying areas of the face and geometrical features which can be used to predict the perception of certain traits. However, an author can hardly use these identified elements to directly control the perception of a desired trait. When an area of the face is found to be related to the perception of a trait (e.g., the eyebrows influence the perception of dominance), the author should be informed on how the area can be reshaped to control the perception level (e.g., to have the character look more dominant should the eyebrows be raised, lowered, or rotated?). Concerning geometrical features, only in few cases they can be used as practical and convenient input (e.g., the distance between the pupils); but most of the times not (e.g., distance from the pupil to the center of the chin). The method proposed in this paper aims at finding the mapping of traits to a set of physical attributes determined by artists as a convenient input for character modeling. With such an approach, the generated character can be further edited by the 3D author.
III. METHOD:MAPPING PERSONALITY TRAITS TO PHYSICAL ATTRIBUTES
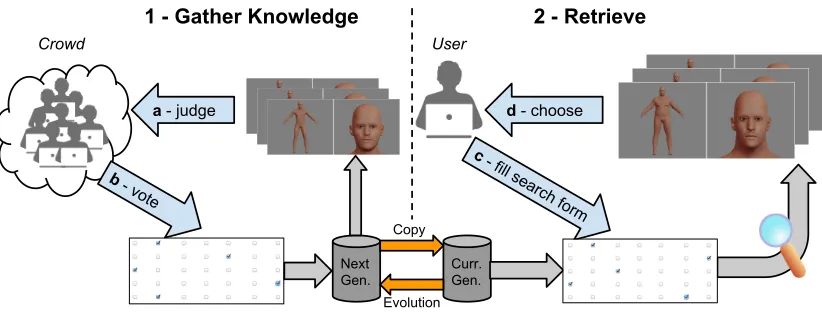
The overall character generation method is described in Figure 3. The first phase consists of gathering people knowl-edge, or beliefs, concerning the correlation between physical aspects and personality traits. The process starts with the creation of a set of random virtual characters. In terms of genetic algorithms, each virtual character is an individual of a generation. The judgment is conducted on a generation of individuals. The virtual characters are shown to a crowd of people. People judge different individuals by voting for them. The voting consists of a rating of the individuals along several traits of a personality profile. The votes of the crowd are used to compute the fitness function of each individual. After sufficient votes have been collected, the generation can be copied to be used for retrieval, while a new (next)
generation will undergo the voting with the aim of improving the retrieval results. In the second phase, retrieval, a user fills in a personality profile. The system searches for a character whose physical aspect matches the expectations of the inputted profile. The system searches for the best matching individuals and returns a set of best candidates among which the user can choose.
The following sections describe the method in more detail. The explanation is exemplified through an experiment whose profile is the OCEAN personality model (also known as Big Five personnality traits) [13]. The OCEAN model for person-ality is a psychological model classifying people with a score along five traits: Openness, Conscientiousness, Extraversion, Agreeableness, and Neuroticism.
A. Virtual characters as individuals of a generation
The genetic representation of an individual is a vector of real positive numbers in the range [0,1]. Each element of the vector is associated to a slider of the GUI of the simplified virtual character editor; it is thus associated to a physical attribute of the virtual character. The genotype is the sequence of the actual values of the physical attributes. The phenotype is the virtual character itself, composed of a mesh and its skeleton.
In order to limit the size of the search space, i.e., the number of possible individuals, each attribute range is divided
into a finite number of segments. Hence, givenna the number
of physical attributes characterizing an individual and sa the
number of segments for an attribute, the total number of different individuals which can be generated is Ni = (sa)na.
For example, in the OCEAN experiment, each individual is characterized by 22 attributes divided in nine segments. The total number of characters is hence922, roughly nine hundred eighty quintillion. Four attributes control macro characteristics: height, muscularity, weight, body proportions. Four attributes influence the shape of the body: torso width, torso v-shape, hips width, stomach tone. Two attributes control the shape of the head: oval or rectangular. Two attributes control the neck width and height. The remaining attributes control several details of (a) the face (eyebrows, angle and vertical position); (b) the nose (upper width, lower width, nostrils size); (c) the mouth (width and height); (d) the chin (width, height, and bones protrusion).
B. The contribution of the crowd: voting characters
Voters watch a visual representation of an individual to judge it and to guess its personality profile. A profile is com-posed of traits. A trait is described by two words describing its extremes. For example, the Openness dimension, the extremes are Close - Open. Each trait dimension id divided inst slots.
The central slot indicates that the character looks neutral with respect to that trait. When a member of the crowd votes for a character, s/he checks one of the slot level on each trait. The division in slots limits the number of possible profiles. Given
nt the number of traits and st the number of slots per trait,
the number of possible profiles is Np = (st)nt. All the traits
of the profile are selected independently. Practically, the user selects nt∗st slots: one for each trait of the guessed profile.
In the OCEAN experiment each of the five traits is divided in
Fig. 3. A diagram of the generation and retrieval method presented in this paper. Left, (a) the crowd judges a set of virtual characters by watching them, and (b) votes the traits of a personality profile. Right, (c) a single user searches for a believable virtual character by filling the form of a personality profile, and (d) chooses among a set of proposals.
Fig. 4. A screenshot of the page used to vote virtual characters.
Figure 4 shows a screen shot of the voting page for the OCEAN experiment. The form shows a full body picture and a face close up of the individual. A ruler is positioned next to the full body picture. It helps the users to have an estimation of the height of the character. Below the pictures there is the voting form. It is composed of an header plus one line for each personality trait. The header contains adjectives for a human friendly quantification of the trait. For example, in the Extraversion/Introversion trait, users can check one or more of the following: Very Extravert, Somewhat Extravert, Slightly Extravert, Neutral (Neither Extravert nor Introvert), Slightly Introvert, Somewhat Introvert, Very Introvert. This yields to a total of 35 checkable slots.
The votes collected with this form can be used to explore correlations between the traits and the physical attributes. An example of such study is presented in Section IV-A.
C. Calculating the fitness function
Each individual is voted alongnttraits, each divided inst
slots. Each slot is associated to a counter which increments when an individual receives a vote in the corresponding slot. Given an individual x and a trait t, let’s define Vt(x), the
vector of counters:
Vt(x) ={c1t, ct2, ..., ctst}
Separately for each trait, the values of the counters are normal-ized in the range [0,1]. Let Vct(x)be the normalized vector,
based on the sum of all votes in the trait:
c
Vt(x) ={c t
1
St
,c
t
2
St
, ...,c
t st
St
}, St= st
X
i=1
cti
For example, an individual collecting, in the Extraversion trait, Neutral=4, Slightly Extravert=4, and Somewhat
Ex-travert=12, will be normalised to the vector Vdextr =
[0.0,0.0,0.0,0.2,0.2,0.6,0.0]. Now let’s extract from each
vector the maximum valueMt:
Mt(x) =max{Vcti(x),1≤i≤st}
The rationale behind this function is to identify virtual charac-ters that are strongly characterising one value (slot) of a trait. A virtual character collecting, let’s say, 100 votes assomewhat extravert, and 0 in the other slots, is much more valuable than a “flat” character collecting 700 votes equally distributed as 100 per slot.
Finally, the fitness value is computed as the average of the maximum values of each normalized trait vector. Given a set of traitsT, the fitness functionF(x)for an individual xis:
F(x) =avg{Mt(x), t∈T}
The value of the fitness function will lie in the range[0,1]. An individualxwho collects, in each trait, votes only in a specific slot, will have F(x) = 1. On the contrary, an individual who collects, in each trait, votes uniformly distributed omong all the slots will have F(x) = s1
t.
D. Retrieval of virtual characters
In order to retrieve the best representative individuals for a certain personality profile, the system takes as input a personality vector P = (P1, P2, ..., Pnt), where the range of
values is normalised so that: Pt ∈ [−1,1] for each trait t
in the profile. Then, the value Pi of each personality trait is
creation of the voting form. Hence, a new vector is defined: P0 = (P10, P20, ..., Pn0t), where each elementP
0
i identifies a slot
of a trait. In other words the vector P0 identifies one of the
(st)nt profiles.
The retrieval of an individual can then be formulated as a maximisation problem. Given a set of individuals in a
generation X and a profile P0, the goal is to retrieve the
individual whose average of the normalised counters in the selected profile has the maximum value:
arg max x∈X
{avg{Vcit(x), i=P0t,1≤t≤nt}}
The system will present to the user a set of alternatives, not only the best candidate. Possibly, candidates might be scattered across the solution space, as they represents different views that people have of the same personality.
E. Evolution of generations
Once a generation collected a sufficient amount of votes (as described later in Section III-G), it can evolve to a new generation. The new generation will have the same number of individuals of the current one. The evolution of a generation involves four factors. The elite factoreis the fraction of elite
individuals that are selected from the current generation to directly migrate to the next one. The elite individuals are selected by according to theirs highest fitness value. The cross-over factorcis the fraction of individuals which will be created by crossing the genetic representation of a couple of parents. The parents are randomly selected among the elite individuals. Children are generated with a uniform cross-over with mixing ratio 0.5, i.e., the value of each attribute is randomly chosen from one of the two parents with 50% chance. The mutation
factor m is the fraction of individuals created by randomly
mutating one of the elites. A mutated individual is created by selecting a random elite and changing the value of a random
attribute. The random factor r is the fraction of individuals
crated by complete random assignment of the attribute values.
To generate the same number of individuals,e+c+m+r= 1
must hold.
Section IV-B reports an analysis which shows how the quality of the character retrieval increases when the elite is extracted from a generation.
F. Number of individuals per generation
This section estimates how much contribution the crowd must provide in order to evolve a generation and get mean-ingful search results. The calculation involves the following variables: the number of traitsnt; the number of slots per trait
st; the elite factore; the number of representative individuals
per profile nr, i.e., the number of different individuals that
should be proposed to a user as result of a search. In the
OCEAN experiment, five traits (nt = 5) are segmented into
seven slots (ns= 7), yielding to75= 16807possible character
profiles. If users should have the possibility to choose among five (nr = 5) representatives for each possible profile, each
generation must contain at least16807∗5 = 84035individuals.
In each generation, only a fraction of its individuals, the “elite” ones, should be considered for retrieval purposes. The other individuals, which are the result of mutation, cross-over,
and random generation, compete with elite ones to get a better fitness value and to migrate to the next generation, but should be excluded from the search. Supposing that the evolution of a generation involves a selection of 25% of elites (e= 0.25), the total number number of individuals in a generation must be 84035/0.25 = 336140.
Summarizing, the number N of individuals populating a
generation should be set to:
N = st nt ∗n
r
e
G. Estimation of the required human contribution
The following gives an estimation of what is the number of
usersU necessary to perform a generation jump in W weeks
given a generation withN individuals.
Consider only one trait of an individual, i.e. seven slots
(again, nt). The worst case is when there is a collection of
only seven votes per individual. In a non-uniform distribution hypothesis this would allow to elect the individual as repre-sentative (for the next generation) of the trait slot in which it scored at least two votes. This means that a generation needs
to collect336140∗7 = 2352980votes before being evolved.
According to preliminary tests, subjects agreed that voting six individuals per day is a fair task. It means that, in five working days, a user can vote 30 individuals. Hence, in order to switch to a new generation every month (let’s say 4 weeks), the contribution of2352980/(30∗4) = 19608users is needed.
In general, given N individuals in a generation, the number
of users U needed to collect enough votes to switch to a new
generation is:
U = N∗nt 30∗W
By reverting this function it is possible to estimate the number of weeks as function of the available users.
The above calculation is true for the first generation. How-ever, the number of users needed from the second generation
onwards will decrease to a factor U0 =U∗(1−e)since the
individuals that are elected to migrate to the next generation will keep their scores.
H. Implementation and usability
The method has been implemented as online web platform
using the Django web framework5 and is running on a Linux
virtual machine equipped with an Apache web server6 and
a MySQL database7. The creation of the virtual characters
is based on the open source application MakeHuman (v1.1) which has been patched to allow an unattended batch process-ing of the character generation. This version of MakeHuman exposes 217 physical attributes to model the virtual character.
Users can access the platform anonymously or register via e-mail authentication. The administrator decides whether an experiment can accept votes from anonymous users or only from authenticated users. The administration interface
also allows for the configuration of new experiments and the management of the generations.
The platform has already undergone two usability phases, involving respectively 5 and 7 users. The results confirm that users are available to vote ca. 30 traits per session (e.g., 6 characters with a profile of 5 traits, or 15 characters with a profile of 2 traits) without dropping the task.
IV. EXPERIMENTS
This section reports the results of a data analysis conducted on two experiments. The first experiment was originally con-ducted by Oosterhof et al. [15] and investigates the correlation between Trustworthiness and Dominance with respect to Age and Gender. The data analysis shows that the fitness function is able to select an elite group of individuals whose correlation increases. Experiment 2, similar to the one conducted by Toscano et al. [14], aims at finding a set of predictors for the Dominance dimension. The analysis shows how to extract the smallest set of physical attributes which maximize the correlation.
Data were collected in one week of testing with a crowd formed by 27 volunteers: 7 female and 20 males, minimum age 18 and maximum 56 (avg=31.37, sd=10.06), various educational levels (12 primary school, 1 diploma, 5 master, 9 PhD), and nationalities (18 DE, 1 FI, 3 FR, 4 IT, 1 US). Users were collected among collaborators and through social networks. Images were shown at a resolution of 471x418 pixels. The experiments were conducted on the online platform DeEvA. Participants were instructed to vote according to their opinion since there was not a “correct” answer.
A. Experiment 1: dominance/trustworthiness vs age/gender
The experiment “Trustworthiness and Dominance”8 aims
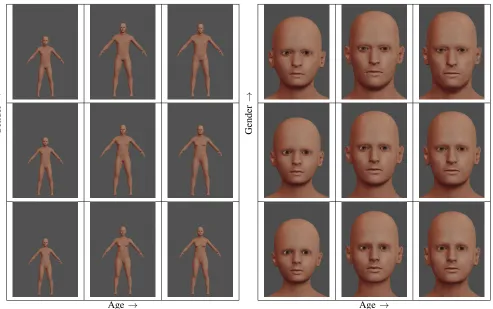
at finding a correlation between two traits – Dominance and Trustworthiness – with respect to two physical attributes – Age and Gender. The two traits are discretised in 5 slots, for a total of52= 25available profiles. The two attributes are divided in 7 segments, yielding to92= 81possible individuals. Figure 6 shows the virtual characters with neutral and extreeme values for Age and Gender.
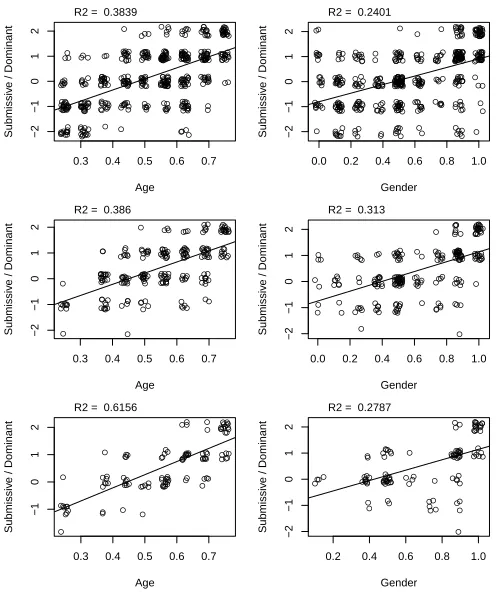
The experiment collected 444 votes. Figure 5 show the plot of the votes for the Dominance dimension. The horizontal axes reports the value of a physical attribute of the voted character. For the Age, the minimum attribute value 0.25 means 13 years old, 0.5 means 25 years old, and the maximum value 0.75 means 57 years old. For the Gender attribute, 0 means fully female, 1 means fully male. The vertical axes is the value of the given vote. Each graphs shows also the line and the adjusted R-square factor of a linear correlation between the plotted dimensions. For the Trustworthiness dimension (not shown in the Figure), the correlation with both the physical attributes remained very low (R2adj ≤0.1).
The two top plots of Figure 5 report the data collected for Dominance on 75 randomly generated individuals. There is some correlation between the Submissive/Dominant dimension and the Age (R2adj = 0.3839) and between the same dimension
8https://deeva.mmci.uni-saarland.de/individuals/vote/8 – 30 Apr. 2015
● ● ● ● ● ● ● ● ● ●● ● ● ● ● ● ● ● ● ●● ● ● ● ● ● ● ● ● ●●●● ● ● ● ● ● ● ● ● ● ● ● ● ● ● ●●● ● ●● ● ● ●● ● ● ● ● ● ● ●●● ● ● ● ● ● ● ● ● ● ● ● ● ● ● ● ● ● ● ●●● ● ● ●●●● ● ● ●● ●● ● ● ● ● ● ● ● ● ● ● ● ● ● ● ● ● ● ● ● ● ● ● ● ● ● ● ● ● ● ● ● ● ● ● ● ●●● ● ● ●● ● ● ● ● ● ●●●● ● ● ● ●● ● ●● ● ● ● ● ● ● ● ● ● ● ●● ● ● ● ●● ● ● ● ● ● ●● ● ●● ● ● ●● ● ● ● ● ● ● ● ● ● ● ● ● ● ● ● ● ●● ●●● ● ● ● ● ● ● ● ● ● ● ● ● ● ● ● ● ● ● ● ● ●● ● ● ● ● ● ● ● ● ● ●● ●● ● ● ● ● ● ● ● ● ● ● ● ● ● ● ● ● ● ● ● ● ● ● ● ● ● ● ● ● ● ● ● ● ● ● ● ● ● ● ●● ● ● ● ● ● ●● ● ● ● ●● ● ● ● ● ● ● ● ● ● ●● ● ● ● ● ●● ● ● ● ● ● ● ●● ● ● ● ● ● ● ● ●● ● ● ● ● ● ● ●● ● ● ● ● ●● ● ● ●●●● ● ● ●● ● ● ● ● ● ● ● ● ● ● ●●● ●● ● ● ● ● ● ● ● ● ● ● ● ● ●● ● ●● ● ● ● ●● ● ● ● ● ● ● ● ● ● ● ● ● ● ● ● ● ● ● ● ● ●●● ● ● ● ● ● ● ● ● ● ● ● ● ● ● ● ● ● ● ●● ● ●●● ● ● ● ●●
0.3 0.4 0.5 0.6 0.7
−2 −1 0 1 2 Age Submissiv
e / Dominant
R2 = 0.3839
● ● ● ● ● ● ● ● ● ● ● ● ● ● ● ● ●● ● ● ● ● ● ● ● ●● ● ● ●●●● ● ● ●● ● ● ● ● ● ● ● ● ● ● ●● ●● ● ●● ● ● ● ● ● ● ● ● ● ● ●● ● ● ● ● ● ● ● ● ● ● ● ● ● ● ● ● ● ●● ●● ● ● ● ● ● ● ● ● ● ● ● ●●●● ● ● ● ● ● ● ● ● ● ● ● ● ● ● ● ● ● ● ● ● ● ● ● ● ● ● ● ● ● ● ● ● ●● ● ● ● ● ● ● ● ● ● ● ● ●●● ● ● ● ●● ● ●● ● ●● ● ● ● ● ● ● ● ● ● ● ● ●●● ● ● ● ●● ●● ● ●● ● ● ● ● ● ● ● ●● ● ● ● ● ● ●●● ● ● ● ● ● ● ● ● ● ●● ● ● ● ● ● ● ● ● ● ● ● ●● ● ● ● ● ●● ● ● ● ● ● ● ● ● ● ● ● ●● ● ● ● ● ● ● ● ●● ● ● ● ● ● ● ● ● ●● ● ● ● ● ● ● ● ● ● ● ● ● ● ● ● ● ● ● ● ● ● ● ● ● ● ● ● ● ● ● ● ●● ● ●● ● ● ● ● ● ● ●● ●● ● ● ● ● ● ● ● ● ● ● ● ● ●● ● ● ● ● ● ● ● ● ● ● ● ● ● ● ● ● ● ● ● ● ● ● ● ● ●●● ● ● ●● ● ● ● ● ● ● ● ● ● ● ● ● ● ●● ● ● ●● ● ●●●●● ● ● ●● ● ● ● ● ● ● ●● ● ● ● ● ● ● ● ● ● ● ● ●● ● ● ●● ● ● ●● ●● ● ● ●● ● ● ●● ● ●●● ● ● ● ● ● ●●● ● ●●● ● ● ● ●●
0.0 0.2 0.4 0.6 0.8 1.0
−2 −1 0 1 2 Gender Submissiv
e / Dominant
R2 = 0.2401
● ● ● ● ● ● ● ● ● ● ● ● ● ● ● ● ● ● ● ● ● ● ● ● ● ●● ● ● ● ● ● ● ● ● ● ● ● ● ● ●●●●● ● ●●● ● ● ● ● ● ● ●●● ● ● ● ● ● ● ● ● ● ● ● ● ●● ●● ● ● ● ● ●● ● ● ● ● ● ●●● ● ● ● ● ● ● ● ● ● ● ● ●● ● ● ● ● ● ● ● ● ● ● ● ● ● ● ● ● ●● ● ● ● ●● ●● ● ●●●● ● ● ● ● ● ● ● ● ● ● ● ● ● ● ●●● ● ● ● ● ● ● ●● ● ● ● ● ●●●●● ● ●●● ● ● ● ●● ● ●● ● ● ● ● ● ● ●● ● ● ● ● ● ● ● ●● ● ● ● ● ● ● ● ● ● ● ● ●●● ●● ● ● ●
0.3 0.4 0.5 0.6 0.7
−2 −1 0 1 2 Age Submissiv
e / Dominant
R2 = 0.386
● ● ● ● ● ● ● ● ● ● ● ● ● ● ● ● ●● ● ● ● ● ● ● ● ● ● ● ● ● ● ●● ● ● ● ●● ● ● ● ● ●● ● ● ● ●● ● ● ● ● ● ● ●●●● ● ● ● ● ● ● ● ● ● ● ● ● ● ● ●● ● ● ● ● ● ● ● ● ● ● ●● ● ●● ●● ● ● ● ● ● ● ● ● ● ● ● ● ●● ● ● ● ● ● ●●● ● ● ● ● ● ● ● ● ● ● ● ● ● ●● ●● ● ● ● ● ● ● ● ● ● ● ● ● ● ●● ●● ● ● ● ●● ● ● ● ●●●● ●● ●●● ● ● ● ● ● ● ● ●● ● ● ● ● ● ● ● ●●●● ● ● ●● ● ● ● ● ● ● ● ● ●● ● ● ● ● ● ● ● ●●●● ● ● ●
0.0 0.2 0.4 0.6 0.8 1.0
−2 −1 0 1 2 Gender Submissiv
e / Dominant
R2 = 0.313
● ● ● ●● ● ● ● ● ●●●● ● ● ●● ● ●● ●● ● ●●●● ● ● ● ● ● ● ●● ● ● ● ● ● ● ● ● ●● ●●●● ● ● ● ● ●● ● ● ●● ● ● ● ●●● ● ● ● ● ● ● ●●● ●● ●● ● ● ● ● ●● ● ● ● ●● ●●● ● ● ● ● ● ● ● ● ● ● ● ● ● ● ●
0.3 0.4 0.5 0.6 0.7
−1 0 1 2 Age Submissiv
e / Dominant
R2 = 0.6156
● ● ●● ● ● ● ● ● ●● ●● ●● ●● ● ● ● ●● ●● ● ● ● ● ● ● ● ● ● ●● ● ● ● ● ● ● ● ● ● ● ●●●● ● ● ● ●●● ● ● ● ● ● ● ●●●● ● ●●●● ● ●●●● ● ● ● ● ● ● ● ● ● ● ● ● ●● ●●● ● ● ●●● ● ● ● ● ●● ● ● ● ●
0.2 0.4 0.6 0.8 1.0
−2 −1 0 1 2 Gender Submissiv
e / Dominant
R2 = 0.2787
Fig. 5. Top: plots for the votes on Dominance as function of the Age and Gender physical attributes. Center: votes for the 50% elite selection. Bottom: votes for the 25% elite selection. Data are jittered to avoid over plotting.
and the Gender attribute (R2
adj = 0.2401). The two central
plots of Figure 5 show the results on a selection of the 37 individuals (ca. 50%) with the highest value of fitness function
F (as defined in Section III-C). The aim is to verify that the
fitness function is indeed able to select individuals bringing to a better correlation between the traits and the attributes. The correlation between the Dominance dimension and the Age didn’t significantly change (Radj2 0.386vs 0.3839), while
the correlation with the Gender dimension did (R2
adj0.313 vs 0.2401). The two bottom plots of Figure 5 show the results on a selection of the 18 individuals (ca. 25%) with highest fitness value. With respect to the 50% selection, the correlation be-tween Dominance and Age significantly increased (Radj2 0.6156
vs 0.386), while the correlation with the Gender dimension
decreased (R2adj0.2787vs 0.313).
Overall, the correlations between the single traits and the single attributes increased when selecting the 25% of the most valuable individuals. The increase is notable when calculating the correlation over a combination of both Gender and Age, as predictors of Dominance and Trustworthiness. Table I reports a summary of the comparison between the three selections:
all individuals, 50%, and 25%. Results show that the R2adj
Gender
→
Age→
Gender
→
Age→
Fig. 6. Experiment 1: extreme and average values for Age and Gender of the virtual characters submitted for voting.
TABLE I. EXPERIMENT1:EFFECTS ON THE PREDICTION POWER WHEN ELECTING INDIVIDUALS OF A GENERATION.
R2
adj˜ Age+Gender Fitness
Elites #indiv. #votes Dom. Trustw. avg AOV vs all
100% 75 444 0.5627 0.0906 0.5499 F=0, p=1
50% 37 213 0.6139 0.1325 0.6473 F=23.49, p<0.001
25% 18 107 0.7731 0.1386 0.7011 F=30.41, p<0.001
generation. The results for the 25% and the 50% elites (all p-values<0.001) support the hypothesis that the selection of the individuals is far from a random selection.
These results only partially match the findings of Oosterhof et al. [15], reporting that both Dominance and Trustworthi-ness are highly correlated with both Age and Gender. The experiment presented in this paper confirm the prediction power of both Gender and Age for Dominance, but shows a very limited prediction for Trustworthiness. Considering the many differences between the two experiments, like the use of a combination of both face and body for the evaluation, finding the reasons of this mismatch would require further investigation.
B. Experiment 2: what affects dominance?
The experiment “What affects dominance?”9 aimed at
studying the relationship between the perception of dominance and 22 different physical attributes, which are the same used for the OCEAN experiment and are listed in Section III-A. Note that this experiment, differently from the previous one,
9https://deeva.mmci.uni-saarland.de/individuals/vote/4 – 30 Apr. 2015
TABLE II. EXPERIMENT2:THE BEST PREDICTORS FOR DOMINANCE, FOUND USING A BACKWARD ELIMINATION MODEL SELECTION BASED ON
R2
adj(LEFT)AND P-VALUE(RIGHT).
TotalR2
adj= 0.2331 R
2
adj
Attribute if removed
chin.bones.in..out 0.2148
chin.height 0.2317
eyebrows.angle.up..down 0.1092
head.oval 0.2294
head.rectangular 0.2244
body.proportions 0.2327
muscle 0.2278
weight 0.2275
mouth.scale.horiz 0.2309
neck.scale.horiz 0.1750
torso.scale.horiz 0.2214
torso.vshape 0.2318
TotalR2adj= 0.2123
Attribute p-value
chin.bones.in..out. 0.001711 eyebrows.angle.up..down <0.001
head.rectangular 0.02021
neck.scale.horiz <0.001
torso.scale.horiz 0.01503
do not include Gender and Age among the physical attributes. Gender is set to fully male and Age is set to 25 years. Voters from the crowd had to judge the images of virtual characters on a five points scale for the dominance trait only. The experiment collected 328 votes. Two model selections were performed in order to find the set of physical attributes which are significantly predicting dominance.
The first model selection was based on a backward elim-ination using adjusted R-square value. It aims at maximizing theR2
adj with the minimum number of attributes. As shown in
Table II, left, the selected model is able to predict Dominance
with an R2
adj of 0.2331 using 12 out of 24 attributes. The
second column shows to what value theR2
adj would fall if the
Fig. 7. Experiment 2: the most Submissive (top) and Dominant (bottom) characters found via model selection using p-value.
two attributes eyebrows.angle.up..down and neck.scale.horiz
suggest their importance in the prediction.
The second model selection was based on a backward elimination using the p-value. It aims at selecting a list of attributes whose prediction confidence level is below a defined threshold, in this case 0.05. As shown in Table II, right, the resulting model consists of only five predictors which are correlating with R2
adj of 0.2123. The resulting correlation
factor is smaller than using the R2
adj, but it is achieved with
a consistently smaller number of predictors (5 instead of 12). The importance in the prediction of the two attributes
eyebrows.angle.up..downandneck.scale.horizis confirmed by their small p-value. The other three significant predictors are the bones of the chin, the rectangularity of the face, and the width of the torso. Figure 7 shows the most submissive and the most dominant characters according to the selected model.
The relevance of the eye brows matches with the finding of Toscano et al. [14]. The relevance of the rectangularity of the face and of the chin bones (both influencing the size of the lower face) matches the results of Windhager et al. [18]. Other relevant predictors found by the aforementioned researches (lips thickness, mouth width, eyes aperture) were not included in this experiment. However, the joint combination of full face
Dominance and Trustworth.
Submissive / Dominant
# of V
otes
−2 −1 0 1 2
0
40
80
120
Dominance and Trustworth.
Untrustworthy / Trustworthy
# of V
otes
−2 −1 0 1 2
0
50
100
150
What affects dominance?
Submissive / Dominant
# of V
otes
−2 −1 0 1 2
0
40
80
120
Fig. 8. Distribution of votes for the experiments.
and full body models revealed the importance of neck width and torso width in the perception of dominance.
C. Discussion
The analyses of the experiments presented in the two previous sections illustrate the potential of the virtual character generation method introduced in this paper. The analysis of first experiment (Section IV-A) shows that there is indeed a correlation between the average value of the fitness function in a generation and the value of the adjusted R-square correlation factor between the traits and the attributes. In other words, the higher is the fitness function, the higher is the predictive power of a combination of physical attributes over a personality trait. The analysis of the second experiment (Section IV-B) shows how to find the physical attributes which are strongly influencing the judgment of personality traits. The search is based on a linear model selection using backward elimination.
The presented experiments have some limitations: the num-ber of segments for the traits judgment was limited to five slots. This limit was set in order to limit the search space and reduce the number of votes needed before testing a generation evolution. As a consequence, there were only two options of votes to favour a trait. Given that voters are generally reluctant to extend the votes to the end of a scale, such limited resolution brought to approximate results. Previous studies [15] suggest that future experiments should be conducted on a nine points scale, rather than five.
As depicted in Figure 8, votes accumulates to the center of the voting scale, meaning that most of the votes judged
a personality as neutral. It is not clear whether the votes
accumulated to the neutral dimension means that “the character looks balanced along this trait” or “the character doesn’t suggest anything on this trait”. Next versions of the interface will give the possibility to check the vote on a trait as “Not applicable”, instead of implicitly voting it as neutral. The distribution is thus expected to become closer to a uniform distribution rather than to a normal one. The left skewness of the distributions suggests also that theneutralexpression is not really perceived as such. In future, corrective factors might be applied in order to neutralize this effect.
V. CONCLUSIONS ANDFUTUREWORK
approach improved the quality of the individuals in a genera-tion. The second experiment demonstrated that the knowledge gathering phase can be used to conduct reverse correlation experiments, which link physical attributes to the perception of specific traits.
This method has the potential to reshape the job of the character designer by supporting text-based character creation approach. This approach would be radically different from the slider-based customization technique available in current video games and other simplified character generation platforms. The designer can determine the traits of a character by reading its fictional biography; then, the designer can answer a question-naire or a personality test (e.g., [19]) while taking the role of the character. The generation platform can use the traits emerging from the textual description to give a preview of the character, whose appearance would be consistent with the expectations of a wide audience. Nevertheless, the proposed method does not compromise the collaboration between de-signers and modellers. The physical attribute space describing the virtual characters is the same space used by modellers. Modellers are thus free to perform further edits on the character and add props which do not influence the perception of the input traits.
The platform is under development to add more options to the configuration of the experiments. Providing side views of the characters could allow a study of the perception of other physical attributes, such as nose length. Further extensions will include the possibility to provide the characters with props, clothes, and hair. Since animations and postures are important elements in the judgement of characters traits [12], there are plans to support them in the platform. Also, future versions will offer the possibility to vote through a side-by-side comparison of two characters (e.g., “which of the two characters looks more dominant?”), rather than asking users to give an absolute evaluation of a trait. It will help in evaluating the influence of physical attributes like height, which are hardly perceived without absolute references. Finally, we plan to exploit crowd-sourcing services, such as the Amazon Mechanical Turk, to run extended versions of the experiments and conduct user studies to verify the convergence of the genetic algorithm. Further research will also test the effectiveness of the search phase, which represents the character generation itself.
ACKNOWLEDGMENT
The authors would like to thank Nicolas Erback, Nils Lipp, and Anjana Vakil for the development of the DeEvA platform.
REFERENCES
[1] S. Mansour, M. El-Said, C. Rude-Parkins, and J. Nandigam, “The Interactive Effect of Avatar Visual Fidelity and Behavioral Fidelity in the Collaborative Virtual Reality Environment on the Perception of Social Interaction,” in Proceedings of the 10th WSEAS International Conference on Communications, ser. ’06. WSEAS, 2006, pp. 387–395. [Online]. Available: http://dl.acm.org/citation.cfm?id=1981726.1981803 [2] J. Cassell, “Social Practice: Becoming Enculturated in Human-Computer Interaction,” in Universal Access in Human-Computer Interaction. Applications and Services, ser. Lecture Notes in Computer Science, C. Stephanidis, Ed. Springer Berlin Heidelberg, 2009, vol. 5616, pp. 303–313. [Online]. Available: http://dx.doi.org/10.1007/ 978-3-642-02713-0 32
[3] A. B. Loyall, “Believable agents: building interactive personalities,” Ph.D. dissertation, Mitsubishi Electric Research Laboratories, 1997.
[4] R. Hassin and Y. Trope, “Facing faces: Studies on the cognitive aspects of physiognomy.”Journal of Personality and Social Psychology, vol. 78, no. 5, pp. 837–852, 2000.
[5] D. E. Goldberg, “Genetic and evolutionary algorithms come of age,” Communications of the ACM, vol. 37, no. 3, pp. 113–119, Mar. 1994. [Online]. Available: http://portal.acm.org/citation.cfm?doid= 175247.175259
[6] R. C. C. Vieira, C. A. Vidal, and J. B. Cavalcante-Neto, “A biologically inspired generation of virtual characters,” in symposium on Applied computing (SAC). ACM Press, 2008, p. 1218. [Online]. Available: http://portal.acm.org/citation.cfm?doid=1363686.1363968
[7] K. Sims, “Artificial evolution for computer graphics,”ACM SIGGRAPH Computer Graphics, vol. 25, no. 4, pp. 319–328, Jul. 1991. [Online]. Available: http://portal.acm.org/citation.cfm?doid=127719.122752 [8] J. Graf and W. Banzhaf, “Interactive evolution of images,” in
Evolution-ary Programming IV: Proceedings of the Fourth Annual Conference on Evolutionary Programming. San Diego, California: MIT Press, 1995, pp. 53–65.
[9] C. M. de Melo and J. Gratch, “Evolving Expression of Emotions through Color in Virtual Humans using Genetic Algorithms,” in Pro-ceedings of the 1st International Conference on Computational Creativ-ity (ICCC-X), Jan. 2007, pp. 248–257.
[10] C. Lombroso, Crime, its causes and remedies. Little, Brown and Company, 1911, vol. 3.
[11] C. Goring, K. Pearson, and E. D. Driver, The English Convict: A Statistical Study: Including the Schedule of Measurements and General Anthropological Data. Patterson Smith, 1972.
[12] L. P. Naumann, S. Vazire, P. J. Rentfrow, and S. D. Gosling, “Personality Judgments Based on Physical Appearance,” Personality and Social Psychology Bulletin, vol. 35, no. 12, pp. 1661–1671, Sep. 2009. [Online]. Available: http://psp.sagepub.com/cgi/doi/10.1177/ 0146167209346309
[13] R. R. McCrae and O. P. John, “An Introduction to the Five-Factor Model and Its Applications,”Journal of Personality, vol. 60, no. 2, pp. 175–215, Jun. 1992. [Online]. Available: http://doi.wiley.com/10.1111/ j.1467-6494.1992.tb00970.x
[14] H. Toscano, T. Schubert, and A. N. Sell, “Judgments of dominance from the face track physical strength,” Evolutionary Psychology, vol. 12, no. 1, pp. 1–18, 2014. [Online]. Available: http://urn.nb.no/URN:NBN: no-44049
[15] N. N. Oosterhof and A. Todorov, “The functional basis of face evaluation,” Proceedings of the National Academy of Sciences, vol. 105, no. 32, pp. 11 087–11 092, 2008. [Online]. Available: http://www.pnas.org/content/105/32/11087.abstract
[16] M. C. Mangini and I. Biederman, “Making the ineffable explicit: estimating the information employed for face classifications,”Cognitive Science, vol. 28, no. 2, pp. 209 – 226, 2004. [Online]. Available: http://www.sciencedirect.com/science/article/pii/S0364021304000023 [17] R. Dotsch and A. Todorov, “Reverse Correlating Social Face
Perception,” Social Psychological and Personality Science, vol. 3, no. 5, pp. 562–571, Sep. 2012. [Online]. Available: http://spp.sagepub. com/cgi/doi/10.1177/1948550611430272
[18] S. Windhager, K. Schaefer, and B. Fink, “Geometric morphometrics of male facial shape in relation to physical strength and perceived attractiveness, dominance, and masculinity,” American Journal of Human Biology, vol. 23, no. 6, pp. 805–814, 2011. [Online]. Available: http://dx.doi.org/10.1002/ajhb.21219