Available online on 15.12.2019 at http://ajprd.com
Asian Journal of Pharmaceutical Research and Development
Open Access to Pharmaceutical and Medical Research© 2013-19, publisher and licensee AJPRD, This is an Open Access article which permits unrestricted non-commercial use, provided the original work is properly cited
Open
Access
Research Article
Lead Exposure Causes Alteration of Haematological Indices in
Adult Female Wistar Rats
Adeyomoye O.I, Adewumi N.A
Department of Physiology, Faculty of Basic Medical Sciences, University of Medical Sciences, Ondo City, Nigeria.
A B S T R A C T
Objective: Lead is a heavy metal widely distributed in the environment. It is known to be a toxicant and has no biological function. Humans are constantly exposed to lead from many sources and its effects on the haematological indices have not been fully elucidated. Therefore, this study aimed to investigate the changes in haematological profile of adult female Wistar rats exposed to lead.
Design: Forty-five female Wistar rats with average weight of 150 ± 20g were randomly distributed into 3 groups of 15 rats each. Group 1 served as the control and was exposed to water only, group 2 was exposed to lead acetate (500mg/L) while group 3 was exposed to lead acetate (1000mg/L). The rats were exposed to lead for 52 days. On the 26th, 39th and 52nd days of exposure, five rats (n=5) were sacrificed from each group after mild anaesthesia and their blood samples were taken into EDTA bottles for haematological analysis using blood auto-analyzer. Results were analyzed using two-way ANOVA and p<0.05 were considered statistically significant.
Main outcome measure: There was significant increase (p<0.05) in white blood cell and lymphocyte counts in 500mg/L and 1000mg/L lead exposed groups when compared to the control. There was significant decrease (p<0.05) in monocyte and granulocyte counts in 500mg/L and 1000mg/L lead exposed groups when compared to control group. Platelet counts significantly increased (p<0.05) in 500mg/L and 1000mg/L lead exposed groups when compared to control group.
Conclusion: In conclusion, exposure to lead at 500 and 1000mg/L increased white blood cells, lymphocyte and platelet counts while it decreased monocyte and granulocyte counts in adult female Wistar rats. Therefore, lead at the exposed levels caused some alterations in the haematological parametersin adult female Wistar rats.
Keywords: Lead, Environment, Toxicant, Haematological indices, Blood auto-analyzer.
A R T I C L E I N F O:Received 27 Nov. 2019; Review Completed 06 Dec. 2019; Accepted 09 Dec. 2019; Available online 15 Dec. 2019
Cite this article as:
Adeyomoye O.I, Adewumi N.A, Lead Exposure Causes Alteration of Haematological Indices in Adult Female Wistar Rats, Asian Journal of Pharmaceutical Research and Development.2019; 7(6):30-34,
DOI:http://dx.doi.org/10.22270/ajprd.v7i6.610
*Address for Correspondence:
Adeyomoye Olorunsola Israel, Department of Physiology, Faculty of Basic Medical Sciences, University of Medical Sciences, Ondo City, Nigeria.
INTRODUCTION
ead as one of the environmental pollutants can threaten the life of living creatures in many ways. From a biological point of view, lead is considered as a non-essential trace element and has no biological function 1. Lead is a naturally occurring toxic metal found in the Earth’s crust. Its widespread use has resulted in extensive environmental contamination, human exposure and significant public health problems in many parts of the world 2. Lead is a ubiquitous and versatile metal that has been used by mankind for over 9000 years and is today one of the most widely distributed toxins in the environment3. Lead is a soft, silvery grey metal, melting at 327.5°C,
highly resistant to corrosion with high density and thermal expansion. It is easily recycled, and inexpensive 4. Lead exposure is a global issue since lead mining, smelting, battery manufacturing, disposal, and recycling are common in many countries. Lead enters the body via inhalation, ingestion or skin absorption5. Most ingested lead is absorbed into the bloodstream 5. After absorption into the blood, 99% of lead is bound to erythrocytes and the remaining 1 percentage stay in plasma to be carried to other tissues. Serum lead half-life is around 25 days6. Children are more likely to be exposed to and affected by lead poisoning and have more serious cases than adults due to their specific physiological and behavioural characteristics
7.
Poisoning typically results from ingestion of food or water contaminated with lead and accidental ingestion of contaminated soil, dust or lead based paint5. Sea water products can contain lead if affected by nearby industrial waters 8. Soil can be contaminated through particulate accumulation of lead in pipes, lead paint and residual emissions from leaded gasoline 9. Additional source of exposure is the use of certain types of unregulated cosmetics and medicines. Once lead enters the body, it is distributed to organs such as the brain, kidneys, liver and bones. The body stores lead in the teeth and bones10. The haematopoietic system consists of organs and tissues, primarily the bone marrow, spleen, tonsils, and lymph nodes involved in the production of blood 11. Blood is a fluid that moves through the vessels of a circulatory system and in humans, it includes plasma (the liquid portion), blood cells (which come in both red and white varieties), and cell fragments called platelets 12. Blood accounts for 7% of human body weight 13. Haematological parameters are those parameters that are related to the blood and blood forming organs and are good indicators of the physiological status of man14.
Studies have shown that lead have multiple target organs such as the haematopoietic system, immune system, kidneys and the nervous system. Hence, there is need to assess the effects of lead exposure on these organs and how these effects change with time. Therefore, this study was designed to investigate the effects of lead on the haematological profile of adult female Wistar rats at different duration of exposure.
MATERIALS AND METHODS
Experimental animals and reagent purchase
Forty-five (45) female Wistar rats with average weight of 150 ± 20g were gotten from the University of Medical
Sciences animal house, divided into 3 groups (n=15). They were kept in standard conditions at a temperature of 18-24ºC and 12 hours light and darkness. Food (growers pellet) and drinking water were made available ad-libitum
and they were allowed to acclimatize for 2 weeks. Lead acetate, a chemical compound of lead was purchased from Loba chemie pvt. Limited. India. The rats were exposed to lead by dissolving lead acetate daily into their drinking water (1 Litre). The rats were divided into group 1(Control group) which were exposed to water only, group 2were exposed to lead acetate (500mg/L) dissolved in water and group 3 were exposed to lead acetate (1000mg/L) dissolved in water.
Blood collection and analysis
The rats were exposed to lead acetate for 52 days. On the 26th, 39th and 52nd day of exposure, five rats (n=5) were sacrificed from each group. Blood samples were collected after mild anaesthesia using sodium thiopental, 30mL/kg via intra-peritoneal route of administration 15. The rats were open up through mid-line laparotomy and blood samples were collected into EDTA tubes through cardiac puncture. The whole blood was analysed immediately using a blood auto-analyser (MC-600 haematology analyser Shenzen Maxcom Electronics Co., Limited China) at the haematology laboratory of the University of Medical Sciences Teaching Hospital Complex (UMIMEDTHC), Laje, Ondo, Nigeria.
Data analysis
Two-way analysis of variance (ANOVA) and Tuckey HSD post-hoc tests were used to compare the results from each parameters in the study groups. Results were expressed as mean ± standard error of mean. P values less than 0.05 were considered to be statistically significant.
RESULTS
Table 1: Haematological profile on the 26th day of exposure to Lead in the control and exposed groups (500mg/L and 1000mg/L).
Haematological parameters Control group Lead acetate (500mg/L) Lead acetate (1000mg/L)
TWBC (10^9/L) 2.20±0.34 4.36±0.27a 2.34±0.14c
LYMPHOCYTE (%) 74.66±11.49 84.74±1.82 92.26±0.55b,c
MONOCYTE (%) 8.36±4.55 10.00±1.83 0.78±0.56b,c
GRANULOCYTE (%) 16.98±7.28 5.26±0.74a 6.96±0.36b
RBC COUNT (10^12/L) 4.69±0.31 4.63±0.13 4.66±0.20
HGB CONC (g/dL) 14.96±0.71 15.36±0.48 14.8±0.75
MCV (fL) 36.12±1.56 34.96±0.34 36.54±0.63
MCH (pg) 32.34±1.62 33.14±0.28 31.76±0.55
MCHC (g/dL) 90.86±7.57 94.8±1.55 87.06±2.71c
PCV (%) 44.88±2.12 46.08±1.43 44.40±2.25
PLT (10^9/L) 357.8±219.1 1238.8±342.3a 970.2±252.2bc
a&b show values significantly different from control group,c shows values significantly different from 500mg/L group (n=5; p<0.05).TWBC = total white
blood cell count, RBC = red blood cell, HGB CONC = haemoglobin concentration, MCV = mean corpuscular volume, MCH = mean corpuscular haemoglobin, MCHC = mean corpuscular haemoglobin concentration, PCV = packed cell volume, PLT = platelet count.
Table 1 showed the effect of lead exposure on haematological profile of adult female Wistar rats after 26th day of exposure. The white blood cell count of the 500mg/L group was significantly higher relative to the control group and also increased when compared to the 1000mg/L group. There was also a significant increase in the lymphocyte count of the 1000mg/L group when compared to the control group and 500mg/L group. The
in the platelet count in lead exposed groups when compared with the control group. However the significant
difference in the 500mg/L group was higher than the 1000mg/L group.
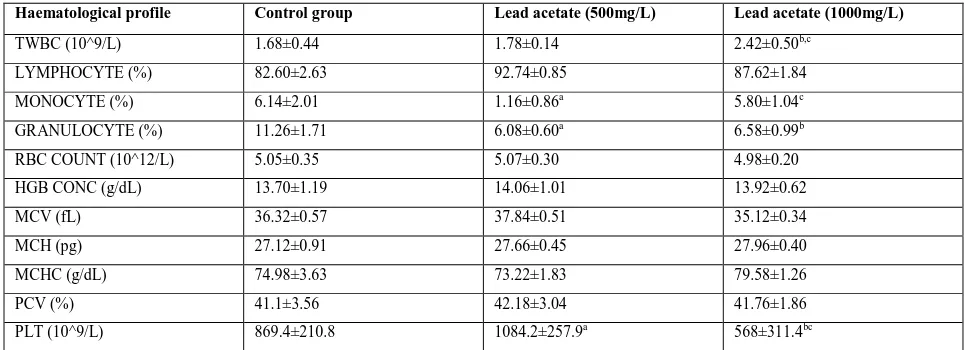
Table 2: Haematological profile on the 39th day of exposure to lead in the control and exposed groups (500mg/L and 1000mg/L).
Haematological profile Control group Lead acetate (500mg/L) Lead acetate (1000mg/L)
TWBC (10^9/L) 1.68±0.44 1.78±0.14 2.42±0.50b,c
LYMPHOCYTE (%) 82.60±2.63 92.74±0.85 87.62±1.84
MONOCYTE (%) 6.14±2.01 1.16±0.86a 5.80±1.04c
GRANULOCYTE (%) 11.26±1.71 6.08±0.60a 6.58±0.99b
RBC COUNT (10^12/L) 5.05±0.35 5.07±0.30 4.98±0.20
HGB CONC (g/dL) 13.70±1.19 14.06±1.01 13.92±0.62
MCV (fL) 36.32±0.57 37.84±0.51 35.12±0.34
MCH (pg) 27.12±0.91 27.66±0.45 27.96±0.40
MCHC (g/dL) 74.98±3.63 73.22±1.83 79.58±1.26
PCV (%) 41.1±3.56 42.18±3.04 41.76±1.86
PLT (10^9/L) 869.4±210.8 1084.2±257.9a 568±311.4bc
a&b show values significantly different from control group, c shows values significantly different from 500mg/L group (n=5; p<0.05). TWBC = total white
blood cell count, RBC = red blood cell, HGB CONC = haemoglobin concentration, MCV = mean corpuscular volume, MCH = mean corpuscular haemoglobin, MCHC = mean corpuscular haemoglobin concentration, PCV = packed cell volume, PLT = platelet count.
Table 2 showed the effect of lead exposure on haematological profile of adult female Wistar rats after 39th day of exposure. The total white blood cell count in the 1000mg/L group showed a significant increase when compared to both control group and 500mg/L group. There was no significant difference in the lymphocyte count in the control group and the lead exposed groups. The monocyte count of the 500mg/L showed a significant decrease when compared to the control group although it showed a significant increase when compared to the
1000mg/L group. The granulocyte count of the lead exposed groups showed significant decrease when compared to the control group. The RBC, HGB, PCV, MCV, MCH and MCHC in the lead exposed groups shows no significant difference when compared to the control group. Although there was a significant increase in the platelet count in lead exposed groups when compared with the control group. However the significant difference in the 500mg/L group was higher than the 1000mg/L group.
Table 3: Haematological profile on the 52nd day of exposure to lead in the control and exposed groups (500mg/L and 1000mg/L).
Haematological profile Control group Lead acetate (500mg/L) Lead acetate (1000mg/L)
TWBC (10^9/L) 1.90±0.11 0.92±0.07a 1.42±0.12bc
LYMPHOCYTE (%) 88.30±2.40 89.94±2.09 89.62±1.51
MONOCYTE (%) 5.20±1.18 1.32±0.72a 3.00±0.59bc
GRANULOCYTE (%) 6.50±1.51 8.74±1.47a 7.38±0.99
RBC COUNT (10^12/L) 5.50±0.25 4.36±0.42 5.27±0.20
HGB CONC (g/dL) 15.46±0.53 11.88±0.98 14.96±0.20
MCV (fL) 37.92±1.06 38.24±1.078 40.08±0.84
MCH (pg) 28.30±0.59 27.50±0.46 28.52±0.95
MCHC (g/dL) 74.96±3.36 72.16±2.89 71.44±3.30
PCV (%) 49.00±1.92 46.60±1.73 49.20±0.59
PLT (10^9/L) 127.6±241.7 722.6±82.1a 783.2±99.6c
a&b show values significantly different from control group, c shows values significantly different from 500mg/L group (n=5; p<0.05). TWBC = total white
blood cell count, RBC = red blood cell, HGB CONC = haemoglobin concentration, MCV = mean corpuscular volume, MCH = mean corpuscular haemoglobin, MCHC = mean corpuscular haemoglobin concentration, PCV = packed cell volume, PLT = platelet count.
Table 3 showed the effect of lead exposure on haematological profile of adult female Wistar rats after 52nd day of exposure. The total white blood cell count of the lead exposed group showed a significant decrease when compared to the control group. But the TWBC count in 1000mg/L group significantly increased when compared to the 500mg/L group. Lymphocyte count showed no significant difference between the lead exposed groups and control group. The monocyte count of the lead exposed group was significantly decreased when compared to the control group although the monocyte count in 1000mg/L group was significantly increased when compared to the
500mg/L group. The granulocyte count in the 500mg/L showed a significant increase relative to the control group. The RBC, HGB, PCV, MCV, MCH and MCHC in the lead exposed groups shows no significant difference when compared to the control group. Although there was a significant increase in the platelet count in lead exposed groups when compared with the control group. However the significant difference in the 500mg/L group was higher than the 1000mg/L group.
WBC count: On 26th and 52nd days, white blood cell count decreased by 59% and 36% respectively compared to 39th day in 500mg/L lead exposed group. The white blood cell count in 1000mg/L lead exposed group on the 26th day of exposure increased by 3% when compared to the 39th day. However on the 52nd day, there was decrease in white blood cell count by 41% when compared to the 39th day of exposure to lead.
Monocyte count: In 500mg/L lead exposed group, monocyte count decreased by 88% on the 39th day when compared to the 26th day of exposure. However, monocyte count increased by 14% on the 52nd day when compared to the 39thday of exposure to lead. In 1000mg/L lead exposed group, monocyte count increased on the 39th day by 87% when compared to 26th day of exposure. However, it decreased by 48% on the 52nd day when compared to 39th day of exposure to lead.
Granulocyte count: In 500mg/L, there was increase in granulocyte count by 13% on the 39th day when compared to the26thday of exposure to lead. There was further increased by 30% on the 52nd day when compared to 39th day. In 1000mg/L lead exposed group, there was increase of 11% in granulocyte count on the 52nd day when compared to the 39th day of exposure to lead.
RBC count: In 500mg/L lead exposed group, there was increase in red blood cell count by 9% on the 39th day when compared to the 26thday of exposure to lead. However, it decreased by 17% on the 52nd day when compared to 39th day. In 1000mg/L lead exposed group, there was an increase of 6% in red blood cell count on the 39th day when compared to 26th day of exposure. There was also an increase of 6% in red blood cell count on the 52nd day when compared to the 39th day of exposure to lead.
HGB concentration: In 500mg/L lead exposed group, the haemoglobin concentration decreased by 18% on the 52nd day when compared to the 39th day of exposure to lead.
MCV: In the 1000mg/L lead exposed group, there was a decrease in mean corpuscular volume by 4% on the 39th day when compared to the 26th day of exposure to lead. However, it increased slightly by 14% on the 52nd day.
MCH: In 500mg/L lead exposed group, there was decrease in mean corpuscular hemoglobin by 17% on the 39th day when compared to the 26th day of exposure. In 1000mg/L lead exposed group, there was decrease of 12% in mean corpuscular hemoglobin on the 39th day when compared to the 26th day of exposure.
MCHC: In 500mg/L lead exposed group, there was decreased in mean corpuscular haemoglobin concentration by 22% on the 39th day when compared with the 26th day of exposure to lead. In 1000mg/L lead exposed group, there was decrease in mean corpuscular haemoglobin concentration by 9% on the 39th day when compared to the 52nd day of exposure.
PCV: In 500mg/L lead exposed group, the packed cell volume decreased slightly by about 8% on the 39th day of exposure when compared to the 26th day. However the packed cell volume increased by 10% on the 52nd day when compared to 39th day of the exposure. In 1000mg/L lead exposed group, the packed cell volume decreased by 5% on the 39th day of exposure when compared to the 26th day.
However the packed cell volume increased by 17% on the 52nd day when compared to 39th day of exposure.
Platelet count: In the 500mg/L lead exposed group, there was a decrease of 13% in platelet count on the 39th day when compared to the 26th day of exposure. It further decreased by 33% on the 52nd day of exposure. In the 1000mg/L lead exposed group, the platelet count decreased by 41% on the 39th day of exposure. Platelet count further increased by 27% on the 52nd day of exposure to lead.
DISCUSSION
Haematological indices are variables that help in assessing the health and physiological status of man and are good indicators of many disease conditions. This present study evaluated the effect of lead exposure on the haematological parameters in adult female Wistar rats.
White blood cells (Leucocytes) are cells of the immune system that play vital role in protecting the body against foreign invaders. They are produced by multi-potent cells in the bone marrow and circulate in the blood and the lymphatic system. In this study, exposure to lead at 500 and 1000 mg/L was observed to cause a significant increase in the white blood cell count relative to the control group. This increase may indicate hypersensitivity of leucocytes to lead acetate and the changes may be as a result of immunological reactions to produce antibodies to cope with the stress induced by lead acetate. Fink and Salibian 16 had earlier also reported elevated white blood cell count during heavy metal toxicity which further corroborate the findings in the exposed groups.
The mean lymphocytes, granulocytes and monocyte values observed in the exposed group was significantly lower than that seen in the control. Reports have suggested that exposure to lead affects humoral immune response, functional impairment of lymphocytes and production of cytokines17. It is also well established that lead affects humoral and cell mediated immunity, and diminishes host resistance18. It can therefore be inferred that the decrease in lymphocytes, granulocyte and monocyte counts of the exposed groups may be as a result of chronic exposure to lead acetate.
Piomelli et al., 19had earlier reported the presence of
anemia in chronic lead poisoning which resulted in depletion of heme synthesis through its inhibitory effects
on enzymes involved in heme synthesis (heme
d-aminolevulinic acid dehydratase, d-aminolevulinic acid synthetase and ferrochalatase), which in turn caused
reduced hemoglobin synthesis. However, there was no
significant change in red blood cell count, haemoglobin concentration and packed cell volume in lead exposed groups when compared to the control group. This is in accordance with the report of Khan, 20, who had earlier reported that lead toxicity does not result in anaemia The platelet is an important blood component and together with other coagulation factors, reduce bleeding from an injury by forming clot. The increase in the platelet count in the exposed group could be due to the impairment of clotting function through endothelial tissue injury and nitric oxide synthesis caused by lead acetate (lead-induced thrombocythemia)21.
while it decreased monocyte and granulocyte counts in adult female Wistar rats. Therefore, the exposure to lead at
the various levels caused some alterations in the haematological parameters in adult female Wistar rats.
REFERENCES
1.Srinivasa-Reddy Y, Pullakhandam R, Radha Krishna KV, Uday
Kumar P, Dinesh Kumar B.Lead and essential trace element levels in school children: a cross-sectional study. Ann Hum Biol. 2011; 38(3):372-7.
2.World Health Organization. Brief guide to analytical methods for measuring lead in blood 2011
3.Gagan-Flora F, Deepesh G, and Archana T. Toxicity of lead: A review with recent updates Interdiscip Toxicol. 2012; 5(2):47–58.
4.Centers for Disease Control and Prevention, U. S. Adult Blood Lead
Epidemiology & Surveillance (ABLES). Retrieved 2017,
https://www.cdc.gov/niosh/topics/ables/ description.html
5.Ab-Latif Wani, Anjum Ara, and Jawed Ahmad UsmaniLead toxicity: a review Interdiscip Toxicol. 2015; 8(2):55–64.
6.Deborah E. Keil, Jennifer Berger-Ritchie, Gwendolyn A.
McMillinTesting for Toxic Elements: A Focus on Arsenic, Cadmium, Lead, and Mercury Laboratory Medicine, 2011; 42(12):735–742,
7.Alan A. Lead and children; Clinical management for family physicians; Can Fam Physician. 2010; 56(6):531–535.
8.Paul B Tchounwou, Clement G Yedjou, Anita K Patlolla,
and Dwayne J Sutton. Heavy Metals Toxicity and the Environment. EXS. 2012; 101:133–164.
9. Agency for Toxic Substances and Disease Registry (ATSDR). Toxicological profile for lead. Atlanta,GA: US Department of Health and Human Services, 2007.
10.World Health Organisation. Lead poisoning and health. Fact sheet on Lead 2016, http://www.who.int/mediacentre/factsheets/fs379/en/
11.Michael A. Rieger and Timm Schroeder. Hematopoiesis Cold Spring Harb Perspect Biol. 2012; 4(12):a008250.
12.Debdatta Basu and Rajendra Kulkarni. Overview of blood components
and their preparation. Indian J Anaesth. 2014; 58(5): 529–537.
13.Laura K. Vricella, Judette M. Louis, Edward Chien, and Brian M. Mercer. Am J Obstet Gynecol. 2015; 213(3):408.e1–408.
14.Nunyarat Koomkrong, Chaiwat Boonkaewwan, Watchara
Laenoi, and Autchara Kayan Blood haematology, muscle pH and serum cortisol changes in pigs with different levels of drip lossAsian-Australas J Anim Sci. 2017; 30(12):1751–1755.
15.Adeyomoye O.I, Adewoye E.O Phytol Reduces Oxidative Stress and Cyclooxygenase-2 Expression in Kidney of Diabetic Wistar Rats Recent Advances in Biology and Medicine, 2018; 4(1):16-19.
16.Dyatlov V, Lawrence D, Neonatal lead exposure potentiates sickness behavior induced by Listeria monocytogenes infection of mice. Brain. behav. Imm, 2002; 4(16):477-92.
17.McCabe J, Berthiaume L, 1999. Functional roles for fatty acylated amino-terminal domain in subcellular localization. mol. bio.cell,1999; 11(10):3771-86.
18.Piomelli S, Childhood lead poisoning. Pediatr. Clin. North. Amer,
2002; 49:1285-1304.
19.Khan TA, Zafar F. Haematological Study in Response to Varying Doses of Estrogen in Broiler Chicken. International Journal of Poultry science, 2005; 4(10):748-751.
20.Barman T, Kalahasthi R, Rajmohan HR, Effects of lead exposure on the status of platelet indices in workers involved in a lead-acid battery manufacturing plant. J Expo Sci Environ Epidemiol. 2014; 24(6):629-33.