ISSN: 2320-4850 [12] www.ajprd.com/AJPRD
Open Access
Available online at http://ajprd.com/index.phpResearch Article
DEVELOPMENT AND EVALUATION OF
DISINTEGRATION CONTROL MATRIX TABLETS OF
FEBUXOSTAT BY USING 2
3FACTORIAL DESIGN
Kanke Pralhad*1, Sawant Pankaj1, Md. Rageeb Md. Usman2, Baviskar Kiran3
*1,3Dept. of Pharmaceutics, Smt S. S. Patil College of Pharmacy, Chopda, Maharashtra, India 1Dept. of PDL, Unichem Lab Pvt. Ltd. Goa
2 Dept. of Pharmacognosy, Smt. S. S. Patil College of Pharmacy, Chopda, Maharashtra, India
ABSTRACT
Disintegration control matrix tablet (DCMT) is a new approach for poorly water soluble drugs which successfully sustain therelease up to 24hrs by controlling the disintegration rate of tablet. DCMT mainly forms the granules containing drug febuxostat and disintegrant sodium alginate which controls the release of febuxostat by controlling the rate of disintegration in wax coating plays an important role. The sustained release of drug is maintained by increasing the wax coating or decreasing the amount of disintegrant.The release of drug from tablet is uniform throughout till all the drug releases from tablet and it is justified by in-vitro dissolution studies.DCMT increases the solubility of drug and improves the bioavailability without disturbing gastrointestinal transit.
Key Words:-DCMT, Wax, Disintegrating agent, Solid dispersion, Febuxostat.
Article Info:Received 25 July, 2018; Review Completed 14 Aug 2018; Accepted 18 Aug 2018
Cite this article as:
Kanke Pralhad, Developmen and Evaluation Of Disintegration Control Matrix Tablets Of Febuxostat By Using 23 Factorial Design, Asian Journal of Pharmaceutical research and Development.2018;6 (4): 12-20
DOI:
http://dx.doi.org/10.22270/ajprd.v6.i4.392*Address for Correspondence
Pralhad Kanke, Department. of Pharmaceutics, Smt S. S. Patil College of Pharmacy, Chopda, Maharashtra, India
INTRODUCTION
Disintegration control matrix tablet (DCMT):
CMT is the novel approach employed for sustaining the drug release and increasing the solubility and bioavailability of drug. The drug release is controlled by the penetration of water in the matrix which is the rate determining step for dissolution of the DCMT. It contains water soluble matrix forming polymer HPMC, disintegrating agent sodium alginate, and carnauba wax which is insoluble or hardly soluble in aqueous body fluids and the release of drug is controlled by means of resistance of coating layer or matrix against the diffusion of drug therein[1,2,4]. Febuxostat is poorly water soluble drug belongs to BCS Class-II which is used in the treatment of gout [3]. Poor
solubility of drug is an issue in the formulation so it is firstly prepared with the solid dispersion which helps to
enhance the solubility of drug upto some extent, the SD is prepared with HPMC and sodium alginate which after SD coated with carnauba wax, Febuxostat is chemically 2- [3- cyano-4- (2- methlypropoxy) phenyl]- 4- methlythiazole- 5 carboxylic acid. It is a non purine selective inhibitor of xanthine oxidase that is indicated for use in the treatment of hyperuricemia and gout [4-7]
MATERIALS AND METHODS Materials
Febuxostat is provided as a gift sample by Ajanta Pharma Ltd., Aurangabad. The HPMC and magnesium st is provided by Colorcon, mumbai as gift sample.
Asian Journal of Pharmaceutical Research
and Development
(An International Peer-Reviewed Journal of Pharmaceutical Research and Development)
© 2013-18, publisher and licensee AJPRD, This is an Open Access article which permits unrestricted non-commercial use, provided the original work is properly cited
D
ISSN: 2320-4850 [13] www.ajprd.com/AJPRD
Remaining excipients are purchased from Dipa chemicals Aurangabad.
Preparation of DCMT
The disintegration controlled matrix tablet of febuxostat can be prepared in the steps as follows:
Preparation of solid dispersion Wax coating of solid dispersion Tablet compression
Preparation of solid dispersion
The solid dispersion is prepared by physical mixing of drug and excipients, the accurately weight quantity of febuxostat and HPMC and sodium alginate taken i.e. 40mg ,90mg ,25mg and mixed thoroughly in polybag however the quantity is taken in multiple of ten.
Preparation of wax coated granules
The granules where prepared by hot melt extrusion method in which the carnauba wax is melted and the solid dispersion mixture is incorporated in the melted wax. On molted state the molten mass is pass through sieve 22 to form uniform size granules.
Tablet compression
Finally 500mg tablet were compressed using 8mm in diameter flat punch using Rotary Tablet Compression Machine[7,8]
Analytical method development
Selection of media: phosphate buffer pH 6.8 is selected as media for method development by UV spectroscopy as the drug is found to be stable and soluble in this media.
Preparation of Standard Stock Solution: Standard drug solution of Febuxostat was prepared by dissolving 25 mg in 25 ml of deionized water the resultant solution obtained is 1000µg/ml used as stock solution for further dilutions.
UV Spectra: The UV spectrum of Febuxostat solution (08 µg/ml) exhibited wavelength of absorbance maximum at 315 nm which complies with the reported.[1.5]
Figure 1: UV Spectrum of Febuxostat
Calibration curve:
Figure 2: Calibration curve of Febuxostat
Preparation of Standard Dilutions: The serial dilutions from the above stock solution is prepared in the range of 02, 04, 06, 08, 10 µg/ml. The absorption was measured at λmax 315 nm. The data obtained was summarized in table
1
Table 1: Validation Parameters for Febuxostat
Sr no Parameter Results
1 Wavelength 315 nm
2 Range (µg/ml) 2-10 (µg/ml)
3 Equation of Linearity Y=0.07933X-
0.00557
4 Correlation coefficient (r2 ) 0.99944
5 Accuracy 102.4451
6 Precision Intraday %RSD 0.332757
Interday %RSD 0.351395
7 Limit of Detection 0.055693825
8 Limit of Quantification 0.168769167
Fourier Transform Infra-Red Spectra
ISSN: 2320-4850 [14] www.ajprd.com/AJPRD
was concordant with the reference as depicted in Figure 2;
Drug Excipient Compatibility Study by FTIR
In all physical mixtures of drug and polymer, there was neither masking of single characteristic peak nor
existence of additional peak in the spectra. (Fig 3,4) so we can conclude that drug and polymers are compatible with each other
Figure 3: FTIR spectrum of Febuxostat Figure 4: IR Spectrum of Physical Mixture
Evaluation of Flow Properties of Powder Blends of Factorial Batche
The characterization of flow properties of powder blends is important in tablet compression. The powder
blends with good flow properties gives uniform die fill and consequently it gives the uniform tablet weight as shown in below table.2
Table 2: Powder Flow properties of factorial batches
Batch Bulk Density* Tapped Density* Carr’s Index* Hausner’s Ratio* Angle of Repose* (0)
F1 0.423 ± 0.003 0.512 ± 0.003 17.38 ± 0.68 1.21 ± 0.046 27.12 ± 0.886
F2 0.419 ± 0.003 0.499 ± 0.003 16.32 ± 0.7 1.19 ± 0.02 29.24 ± 0.831
F3 0.437 ± 0.002 0.567 ± 0.001 22.92 ± 0.356 1.24 ± 0.044 25.36 ± 1.333
F4 0.417 ± 0.001 0.494 ± 0.01 16.59 ± 0.668 1.18 ± 0.02 25.12 ± 0.72
F5 0.413 ± 0.003 0.497 ± 0.004 16.9 ± 0.344 1.2 ± 0.079 26.42 ± 0.524
F6 0.42 ± 0.007 0.527 ± 0.001 20.3 ± 0.603 1.25 ± 0.036 28.54 ± 0.813
F7 0.431 ± 0.005 0.521 ± 0.003 17.27 ± 0.882 1.2 ± 0.05 27.18 ± 1.006
F8 0.428 ± 0.002 0.535 ± 0.008 20 ± 0.96 1.25 ± 0.046 29.36 ± 0.584
All values are mean ± SD, * =3
Formulation batches of febuxostat
Table 3: Amount of excipients in 23 factorial design (optimized) batches
Batch Code F1 F2 F3 F4 F5 F6 F7 F8
Febuxostat 40 40 40 40 40 40 40 40
HPMC K100M 90 90 90 102 102 102 90 102
Sodium Alginate 15 15 25 25 15 25 25 15
Carnauba Wax 185 151 185 185 185 151 151 151
Lactose 150 184 140 128 138 162 174 172
Mg. Stearate 20 20 20 20 20 20 20 20
ISSN: 2320-4850 [15] www.ajprd.com/AJPRD Evaluation of Febuxostat DCMT
The tablets from the factorial batches were evaluated for different evaluation parameters of table no.4.
Physical Appearance
The tablets from all factorial batches were light Yellowish, circular. The surface texture was smooth. The thickness of tablets of factorial batches was 3.13 to 3.22 mm and it was found to be within limit of deviation from average value.
Weight Variation
For tablet weighing 500 mg or more, not more than two tablets differ from the average weight by 5% deviation. The percent deviation in weight variation from average value for all formulation of factorial design batches were within limit (Table 4). The weight variation within limits indicates uniformity in tablet compression and consequently content of drug in a unit.
Hardness
The hardness is important characteristics to be evaluated for handling and transportation properties of the tablets. The hardness of tablets was found to be 4-5 Kg/cm2 which indicate good handling and transportation characteristics.
Friability
The friability is important characteristics to be evaluated for handling and transportation properties of the tablets. The friability of tablets was less than 0.7% which indicates good handling and transportation characteristics.
Drug Content
The drug content of the eight formulations was found to be between 97.22 to 101.89 % (i.e. variation of ±4%). The value ensures good uniformity of the drug content in the tablet.
Thus all the physical parameters of the compressed matrices were found to be practically within control. As shown in the following table 4.
Table 4: Evaluation of Febuxostat DCMT
Batch Appearance Weight Variation* mg ± SD
Hardness (Kg/cm2) ±SD
Friability# %
Thickness (mm) ±SD
Drug content (%mg) ±SD
F1 Yellowish
white, circular 500±0.74 4.2±0.28 0.81±0.03 3.20±0.12 99.13± 0.14
F2 Yellowish
white, circular 500±0.41 4.7±0.5 0.69±0.07 3.19±0.220 98.03± 1.11
F3 Yellowish
white, circular 500±0.97 4.1±0.31 0.82±0.03 3.18±0.03 100.09±0.45
F4 Yellowish
white, circular 500±1.24 4.5±0.21 0.52±0.03 3.21±0.13 99.5±0.79
F5 Yellowish
white, circular 500±0.47 5.0±0.28 0.60±0.06 3.24±0.11 99.5±0.49
F6 Yellowish
white, circular 500±1.24 4.9±0.5 0.62±0.09 3.20±0.12 98.1± 0.49
F7 Yellowish
white, circular 500±0.94 4.0±0.28 0.61±0.06 3.18±0.25 97.89± 0.83
F8 Yellowish
white, circular 500±0.81 4.6±0.5 0.63±0.02 3.17±0.15 98.22± 0.36
* n=20, #n=10,All values are mean ± SD
Disintegration Study
The disintegration study of the optimized F7 batch was studied as the Japanese pharmacopeia. The disintegration test was carried out by a modified disintegration test of Japanese Pharmacopoeia (JP) using the disintegration apparatus listed in JP at a frequency of 30 cycles per minute. One tablet was tested in 900 mL of JP first medium (pH 1.2), which were maintained at 37.5 C. The tablet was dried at 30 C for 12 h, and the disintegration ratio (% disintegrated) was calculated by the following equation.
%disintegrated= Wi – Wt/ Wi*100
Where, Wt is the weight of tested DCMT sampled at time t and Wi is the initial weight of DCMT.
ISSN: 2320-4850 [16] www.ajprd.com/AJPRD Table 5:- % Disintegration of the tablet
DISINTEGRATION STUDY
Time
Initial weight
Final
weight % Disintegrated
2 Hrs 499 458 08.21
4 Hrs 501 425 15.16
6 Hrs 503 386 23.26
8 Hrs 500 321 35.80
10 Hrs 501 285 43.11
In Vitro Drug Release Studies
The rate of drug dissolution may be directly related to the efficacy of the tablet product, as well as the bioavailability differences between the formulations. This test of dissolution is most of the times useful to specific types of dosage forms such as; sustained release, time dependent, targeted etc. to know the approximate drug release behavior of dosage form in the GIT.
In vitro drug release study was carried out using USP dissolution apparatus I in 0.1N HCl for first 2Hrs and then buffer pH 6.8 for a period of remaining 22 Hrs. However drug is practically insoluble in 0.1N HCL so there were no release and release is checked in pH 6.8 buffer for 24 hr.
Table 6: Percent cumulative drug release of formulation F1 to F8
Time F1 F2 F3 F4 F5 F6 F7 F8
1 16.47±
0.906 16.53± 0.477 14.69 ± 0.607 15.01 ± 0.779 14.54 ± 0.442 12.05 ± 1.015 15.36 ± 0.947 15.51 ± 0.932
2 20.91 ± 0.892 21.97 ± 0.948 19.49 ± 0.835 19.73 ± 0.562 18.02 ± 0.957 16.53 ± 0.671 19.10 ± 0.872 19.36 ± 0.769
3 25.55 ±
0.965 25.56 ± 1.521 23.84 ± 0.502 23.63 ± 0.331 21.46 ± 0.608 20.91 ± 0.397 22.67 ± 0.674 23.78 ± 0.492
4 30.94 ±
0.968 32.56 ± 0.311 27.68 ± 1.631 28.49 ± 0.131 25.39 ± 0.154 24.14 ± 0.547 27.82 ± 1.315 27.87 ± 0.695
5 36.50 ±
0.841 38.78 ± 0.924 32.82 ± 0.751 33.21 ± 0.927 29.39 ± 0.599 28.62 ± 0.784 32.58 ± 0.756 31.37 ± 0.549
6 40.76
±0.915 42.79 ± 1.968 36.25 ± 0.725 37.64 ± 0.656 33.83 ± 0.562 32.50 ± 1.232 35.88 ± 1.110 35.75 ±0.574
7 45.53 ±
0.663 46.88 ± 0.389 40.76 ± 0.335 41.26 ± 1.999 37.50 ± 1.846 36.51 ± 0.973 40.13 ± 0.742 38.50 ± 0.812
8 50.25 ±
0.946 49.39 ± 0.271 44.70 ± 0.978 45.25 ± 0.208 41.19 ± 0.495 40.78 ± 701 43.65 ± 0.778 41.60 ± 0.674
9 52.78 ±
0.294 52.77 ± 0.479 48.38 ± 0.598 47.71 ± 0.584 44.32 ± 0.772 44.88 ± 0.571 46.31 ± 1.543 44.86 ± 0.318
10 56.05 ±
0.976 55.60 ± 0.662 50.25 ± 0.646 52.21 ± 0.715 49.81 ± 0.967 48.66 ± 0.721 50.05 ± 1.238 48.61 ±0.994
11 59.71 ±
0.627 59.71 ± 0.842 55.87 ± 0.699 57.00 ± 0.677 51.12 ± 0.733 53.58 ± 0.671 55.34 ± 0.671 52.95 ± 0.741
12 63.01 ± 0.947 61.67 ± 0.437 58.93 ± 0.674 57.92 ± 0.688 52.92 ± 0.977 57.23 ± 0.699 59.80 ± 0.794 54.67 ± 0.554
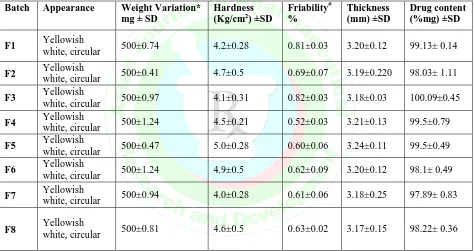
24 92.91 ± 0.991 92.91 ± 0.786 93.30 ± 0.594 98.12 ± 0.740 96.75 ± 0.457 98.70 ± 0.774 93.69 ± 0.795 95.17 ± 1.745
ISSN: 2320-4850 [17] www.ajprd.com/AJPRD Figure 5: Percent cumulative drug release of formulation F1 to F8
From the release pattern of formulations containing HPMC and Carnauba wax it could be concluded that, the combination of these polymers worked well. HPMC K 100M reported gelling agent as well as sustained / controlled release agent, for decreased initial burst release wax is used for avoiding the penetration of water and sodium alginate as disintegrating agent. The 23 factorial designed batches were formulated and in vitro drug release was studied. The formulation batches from F1 to F8 is evaluated for the in-vitro drug release and found that the batch F3-F8 gives optimum release and batch F7 is selected for optimization with lower polymer content.
Kinetics Of Drug Release
Under certain conditions it can be used as a surrogate for the assessment of bioequivalence. Several theories or a kinetic model describes drug dissolution from immediate and modified release dosage forms. There are several models to represent the drug dissolution profiles where ft
is a function of t (time) related to the amount of the drug dissolved from the pharmaceutical dosage system.The
quantitative interpretation of the values obtained in dissolution assay is facilitated by the usage of generic equation that mathematically translates the dissolution curve in function of some parameters related with the pharmaceutical dosage forms.[9,10]
In most cases the theoretical concept does not exist and some empirical equations have proved to be most accurate or appropriate. The kind of drug, its polymorphic form, crystallinity, particle size, solubility and amount in that pharmaceutical dosage form can influence the release kinetics.
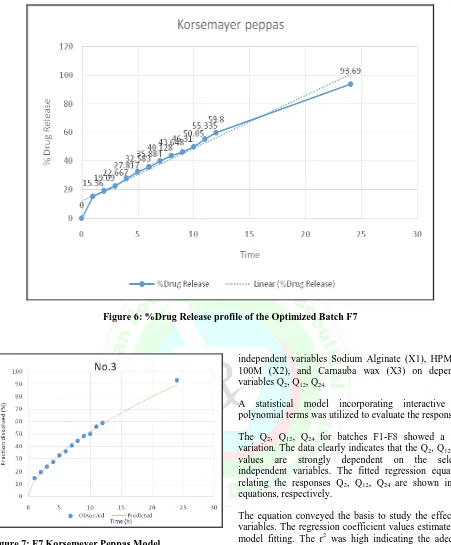
In the present study, the drug release was analyzed by DD Solver software to study the kinetics of drug release mechanism. The results showed that the factorial design batches followed Korsemeyer Peppas model. The R value of Korsemeyer Peppas was found close to one as shown in Table 7. The rate of drug release from the matrix tablet is rapid initially followed by progressively slow drug release through the matrix. The slow release of the drug from the matrix may be due to the carnauba wax which is coated over the granules. [10,11]
Table 7: Model fitting data of DCMT of Febuxostat
Batch code
R2
Zero First Korsemeyer
Peppas Higuchi Hixson
F1 0.7232 0.9168 0.9606 0.9372 0.9073
F2 0.9000 0.9333 0.9738 0.8681 0.9447
F3 0.6406 0.8986 0.9474 0.9547 0.8821
F4 0.6488 0.8986 0.9856 0.9429 0.8694
F5 0.5539 0.9393 0.9710 0.9429 0.9069
F6 0.7380 0.9963 0.9835 0.9446 0.9205
F7 0.8025 0.9134 0.9923 0.9127 0.9175
ISSN: 2320-4850 [18] www.ajprd.com/AJPRD
The % drug release of the optimized batch F7 follows the Korsemeyer Peppas kinetic model the graph as
shown below:
Figure 6: %Drug Release profile of the Optimized Batch F7
Figure 7: F7 Korsemeyer Peppas Model
Statistical Analysis By Design Expert Software
Experimental design can be defined as the strategy for setting up experiments in such a manner that the information required is obtained as efficiently and precisely as possible. The factorial design can serve as an essential tool to understand the complexity of mechanisms of pharmaceutical formulations. The polynomial equations are used to evaluate the statistical significance of the obtained responses. The 23 full factorial designs were selected to study the effect of
independent variables Sodium Alginate (X1), HPMC K 100M (X2), and Carnauba wax (X3) on dependent variables Q2, Q12, Q24.
A statistical model incorporating interactive and polynomial terms was utilized to evaluate the responses.
The Q2, Q12, Q24 for batches F1-F8 showed a wide
variation. The data clearly indicates that the Q2, Q12, Q24
values are strongly dependent on the selected independent variables. The fitted regression equations relating the responses Q2, Q12, Q24 are shown in the
equations, respectively.
The equation conveyed the basis to study the effects of variables. The regression coefficient values estimates the model fitting. The r2 was high indicating the adequate fitting of the linear model.
The polynomial equations can also be used to draw conclusions considering the magnitude of co-efficient and the mathematical sign it carries; i.e. positive or negative. The coefficient of variable X1, X2, X3 i.e. HMPC K100 M,Sodium alginate, and Carnauba wax in case of responses Q2, Q12 and Q24 indicates that as the HMPC
K100 M,Sodium alginate, and Carnauba wax concentration was increased, the Q2, Q12 and Q24 value
ISSN: 2320-4850 [19] www.ajprd.com/AJPRD Response Surface Plot
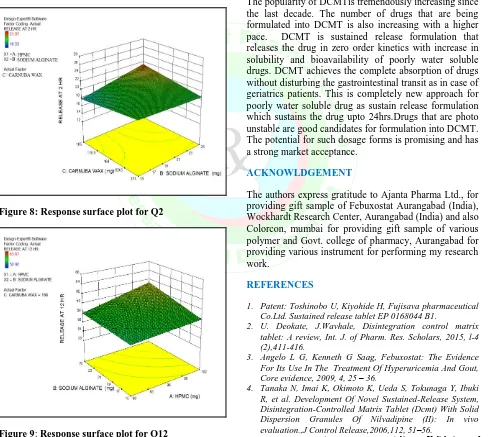
The linear model obtained from the regression analysis used to build a 3-D graphs in which the responses were represented by curvature surface as a function of independent variables.
The relationship between the response and independent variables can be directly visualized from the response surface plots. The response surface plot were generated using Design Expert 7.1.6 software presented in Fig.8, 9, 10 to observe the effects of independent variables on the response studied such as Q2, Q12, Q24.
Graphical presentation of the data helped to show the relationship between the response and the independent variables. The information given by graph was similar to that of mathematical equations obtained from statistical analysis. The response surface plots showed that various combinations of independent variables X1, X2 and X3
may satisfy any specific requirement (i.e. maximum drug release upto 24 Hrs and minimum burst release in 3 Hrs) while taking into consideration of various factors involved in dosage form[14,15]
Figure 8: Response surface plot for Q2
Figure 9: Response surface plot for Q12
Figure 10: Response surface plot for Q24
CONCLUSION
The popularity of DCMTis tremendously increasing since the last decade. The number of drugs that are being formulated into DCMT is also increasing with a higher pace. DCMT is sustained release formulation that releases the drug in zero order kinetics with increase in solubility and bioavailability of poorly water soluble drugs. DCMT achieves the complete absorption of drugs without disturbing the gastrointestinal transit as in case of geriatrics patients. This is completely new approach for poorly water soluble drug as sustain release formulation which sustains the drug upto 24hrs.Drugs that are photo unstable are good candidates for formulation into DCMT. The potential for such dosage forms is promising and has a strong market acceptance.
ACKNOWLDGEMENT
The authors express gratitude to Ajanta Pharma Ltd., for providing gift sample of Febuxostat Aurangabad (India), Wockhardt Research Center, Aurangabad (India) and also Colorcon, mumbai for providing gift sample of various polymer and Govt. college of pharmacy, Aurangabad for providing various instrument for performing my research work.
REFERENCES
1. Patent: Toshinobo U, Kiyohide H, Fujisava pharmaceutical
Co.Ltd. Sustained release tablet EP 0168044 B1.
2. U. Deokate, J.Wavhale, Disintegration control matrix
tablet: A review, Int. J. of Pharm. Res. Scholars, 2015, l-4 (2),411-416.
3. Angelo L G, Kenneth G Saag, Febuxostat: The Evidence
For Its Use In The Treatment Of Hyperuricemia And Gout, Core evidence, 2009, 4, 25 – 36.
4. Tanaka N, Imai K, Okimoto K, Ueda S, Tokunaga Y, Ibuki
R, et al. Development Of Novel Sustained-Release System, Disintegration-Controlled Matrix Tablet (Dcmt) With Solid Dispersion Granules Of Nilvadipine (II): In vivo evaluation.,J Control Release,2006,112, 51–56.
5. CH Harmonised Tripartite Guideline : Validation of
ISSN: 2320-4850 [20] www.ajprd.com/AJPRD
6. Silverstein R.M, Webster F.X, Spectroscopic Identification
of Organic Compound,VII edition, John Wiley & Sons,New
Jersy, 2005,76-81.
7. Skoog DA, Holler, F. J. and Timothy, A. N.,Principles of
Instrumental Analysis.,V Edi.,Saunders College Publishing.
Harcourt Brace College, Publishers.Sweden, 2005,74-95.
8. Ministry of Health andWelfare Ministerial Notification No.
104 1994,Japanese Pharmacopoeia, PMDA Publishers, Japan,2011,1–1654.
9. Dash S, Murthy PN, Nath L, Chowdhury P., Kinetic
modeling on drug release from controlled drug delivery
systems., Acta Pol Pharm,2010, 67(3), 217–22.
10.Kim H, Fassihi R. Application of binary polymer system in
drug release rate modulation. 2. Influence of formulation variables and hydrodynamic conditions on release kinetics. J Pharm Sci 1997;86:323
11.Bhargava. Oral sustained release dosage form: Opportunity
to prolong the release of drugs. Int J Adv Res Pharm Biosci 2013;3:7–14.
12.Tanaka N, Imai K, Okimoto K, Ueda S, Tokunaga Y, Ibuki
R, et al. Development of novel sustained-release system, disintegration-controlled matrix tablet (DCMT) with solid dispersion granules of nilvadipine (II): In vivo evaluation. J Control Release 2006;112:51–6
13.Rowe R, Sheskey P OS, editor. Handbook of Pharmaceutical
Excipients. Fifth Edit. Pharmaceutical Press; 2006
14.Arjun S, Ritika S, Faraz J. Sustained Release Drug Delivery
System : a Review. Int Res J Pharm 2012;3:21–4
15.Rathore AS, Jat RC, Sharma N, Tiwari R, Ram S, Of C, et
al. An Overview : Matrix Tablet As Controlled Drug Delivery System. Int J Res Dev Pharm Life Sci 2013;2:482– 92
16.Sciences H, Dash S, Murthy PN, Nath L, Chowdhury P.