Journal of Parkinsonism and Restless Legs Syndrome
Dove
press
O R i g i n a L R e S e a R c h
open access to scientific and medical research
Open access Full Text article
a pilot study to evaluate simulated driving
performance and cognitive function in healthy
subjects and patients with restless legs syndrome
Dan chen1 Paula Shaw2
Daniel M canafax1,3 James catesby Ware4
1XenoPort, inc., Santa clara, ca, USa; 2charles River northwest, Tacoma,
Wa, USa; 3Theravance inc., South San
Francisco, ca, USa; 4Division of Sleep
Medicine, eastern Virginia Medical School, norfolk, Va, USa
correspondence: Dan chen
XenoPort, inc., 3410 central expressway, Santa clara, ca 95015, USa
Tel +1 408 616 7200 Fax +1 408 616 7211 email [email protected]
Objective: Symptoms of restless legs syndrome (RLS) usually occur during the evening and night time, resulting in disrupted sleep and subsequent daytime fatigue. This study compared simulated driving performance, alertness, and cognitive function between healthy subjects and patients with a diagnosis of RLS.
Methods: Fifteen healthy subjects and 15 untreated RLS subjects were enrolled and com-pleted two driving tests. The first test occurred at 4 PM followed by the second test at 8 AM the next morning. Outcome measures included lane position variability (LPV), speed vari-ability, frequency of simulated crashes (off-road events or collision), and brake reaction time. Other assessments included visual analog scale (VAS) of alertness and the Brief Assessment of Cognition (BAC).
Results: Overall, RLS patients and healthy subjects performed similarly on driving assessments. Two subjects within each group experienced off-road events. RLS patients had less alertness on the VAS than healthy subjects before and after driving assessments. Both groups scored similarly on the cognitive function assessments.
Conclusion: Despite reported diminished alertness, RLS patients did not demonstrate impair-ment in driving or cognitive performance.
Keywords: restless legs syndrome, simulated driving performance, cognitive function
Introduction
Restless legs syndrome (RLS) is a neurological disorder characterized by an irresist-ible urge to move, usually accompanied by uncomfortable and/or painful sensations in the legs. Symptoms are exacerbated by inactivity and commonly occur during the evening and later at night. Consequently, people with RLS have reported delayed onset of sleep and disturbed sleep,1 leading to more pronounced daytime fatigue and sleepi-ness when compared to healthy adults.2,3 A potential consequence of daytime fatigue and sleepiness is impaired driving performance and RLS patients have been reported to be prone to sleepy driving.2 Counter to this, sleep complaints of RLS patients do not correlate with daytime sleepiness complaints. Despite disturbed sleep, RLS patients are reported to not have severe daytime sleepiness or abnormal Epworth Sleepiness Scale (ESS) scores.4,5 In fact, compared to sleep deprived control subjects, there is reported greater alertness in RLS patients.6 An additional potential consequence of daytime fatigue is cognitive deficit. Untreated RLS patients in three clinical studies assessing cognitive functioning demonstrated deficits in performance including short-term attention and verbal fluency.7–9 However, results from population studies have not
Research and Reviews in Parkinsonism downloaded from https://www.dovepress.com/ by 118.70.13.36 on 27-Aug-2020
For personal use only.
Number of times this article has been viewed
Dovepress
chen et al
been conclusive with some demonstrating certain deficits,10,11 with some demonstrating certain deficits and others showing a lack of cognitive dysfunction.12
There are various ways to assess driving performance, including on-road and simulated driving. Because they mitigate some of the expense and most of the risk, driving simulators are commonly utilized and have been shown to be comparable with on-road driving testing for assessing driv-ing performance.13 A key outcome measure used to assess simulated driving performance is lane position variability (LPV). The sensitivity and test-retest reliability of LPV has been demonstrated.14 Driving simulators have been used to evaluate the risk of driving in adults with daytime sleepiness and in patients with sleep disorders,15,16 as well as to assess the psychomotor effects of medications, such as sedatives/ hypnotics, antipsychotics, anticonvulsants, anxiolytics, and antidepressants.17–19
The primary objective of this study was to assess simu-lated driving performance of untreated RLS patients and healthy volunteer subjects with the hypothesis that subjects with RLS may demonstrate comparatively impaired driving performance. Secondary study objectives were to evaluate subjective alertness and cognitive function. This study was designed as a pilot study for clinical investigations assess-ing the effects of gabapentin enacarbil (GEn, Horizant®, XenoPort, Inc., Santa Clara, CA, USA), a treatment for moderate-to-severe primary RLS in adults,20,21 on simulated driving performance.
Methods
Study design
This single-center observational study was conducted between December 2006 and March 2007 in accordance with good clinical practice (GCP), all applicable regulatory requirements, and the guiding principles of the Declara-tion of Helsinki. The protocol and informed consent were reviewed and approved by Copernicus Group IRB (Cary, NC, USA). Written informed consent was obtained from each subject prior to the performance of any study-specific procedure. No investigational product or other test agent was administered.
Each subject completed two study visits on two consecu-tive days, a screening/baseline visit and an end-of-study visit. A simulated driving test was performed at each study visit. The first simulated test was conducted at 4 PM on Visit 1 (Day 1). The second simulated driving test was conducted at 8 AM on the following morning (Visit 2/Day 2). Subjects also completed the visual analog scale (VAS) of alertness, Brief
Assessment of Cognition assessment (BAC), and Pittsburgh Sleep Diary (PghSD) at both visits, and Epworth Sleepiness Scale (ESS) at the Day 1 visit.
Subjects were required to abstain from the consumption of alcohol, and all caffeine-containing foods and beverages from midnight prior to Visit 1 until 2 hours following the end of Visit 2.
Subjects
All patients were recruited through local advertising and healthy volunteers from the database at the study center. Eligible subjects included males or females aged $18 years who were licensed drivers at the time of study entry and driv-ing an average of three times/week for the past three years. Subjects with a body mass index (BMI) .34; a sleep disorder (eg, sleep apnea, narcolepsy, or primary insomnia); use of a sleeping/sedating medication or central nervous system (CNS) stimulants; or shift employment were excluded from participation in the study. At study entry, the RLS population was required to have a diagnosis of RLS based on the Inter-national RLS Study Group (IRLSSG) Diagnostic Criteria; a history of RLS symptoms for at least 15 nights in the prior month and for at least four of the previous seven consecutive evenings/nights; and must have received a score $15 on the IRLS rating scale. Subjects receiving RLS treatment were required to discontinue treatment at least two weeks prior to study entry. Any subjects who experienced driving simula-tor sickness such as nausea and were unable to complete the 5-minute practice drive at Visit 1 were discontinued and designated as a Screening Failure.
assessment of simulated
driving performance
The driving simulator used in this study was a fixed-platform PC-based system (STISIM Drive, Systems Technology Inc., Hawthorne, CA, USA). The simulator setup and the placement of controls were similar to those of an actual car, including an adjustable car seat, a seat belt, a steering wheel, and brake and acceleration pedals. The driving scenario image was projected onto a white wall. The projected field of view was 60° for the driver. The two-lane highway was 13 ft wide in each direction. The lane position was measured from the center line of the vehicle to the center line of the two-lane road.
Each test consisted of a 5-minute practice session to acclimatize the subject to the simulated driving system, fol-lowed by a 2-minute brake reaction test, and concluded with a 60-minute test drive. The brake reaction scenario assessed
Research and Reviews in Parkinsonism downloaded from https://www.dovepress.com/ by 118.70.13.36 on 27-Aug-2020
Dovepress Driving performance with restless legs syndrome
the time for the subject to move his or her foot from the accelerator to the brake pedal at a stop sign appearing at predetermined intervals. The 60-minute test drive consisted of a rural two-lane highway with several gradual curves, occasional hills, and approximately one oncoming vehicle every 10 minutes.
Lane position and speed were sampled once per second for the duration of the test and averaged over each of six 10-minute epochs. A simulated crash was defined as collision of the simulated vehicle with an oncoming car or an off-road event when the distance of the vehicle from the center line was more than 18 ft on either side of the road. After a simulated crash, the lane position was reset to middle of the lane and speed was reset to zero.
Outcome measures of the simulated driving assess-ments included average lane position variability or LPV (ft) measured as the standard deviation (SD) of lane position by 10-minute time block (or epoch) and overall; average speed variability (mph) by epoch and overall; number of simulated crashes during the 60-minute test; and average brake reaction time (seconds).
Visual analog scale of alertness
Alertness was assessed prior to and immediately after each simulated driving test using a visual analog scale (VAS), a 100-mm scale anchored by “extremely sleepy” and “extremely alert” on the left and right ends, respectively. Subjects placed a mark on the scale to indicate self-evaluated alertness. The alertness score was measured in millimeters from the left end to the mark with higher scores indicating more alertness.
epworth Sleepiness Scale
The ESS22 was completed by subjects at Visit 1/Day 1.
Pittsburgh Sleep Diary
The PghSD23 was completed by subjects based on their sleep the nights prior to Visit 1/Day 1 and Visit 2/Day 2. Responses from this diary were used to determine subjective latency to sleep onset, total sleep time, wake time after sleep onset, and sleep quality.
Brief assessment of cognition
Cognitive function was assessed prior to each simulated driving test using the BAC,24,25 designed to measure six cognitive domains: verbal memory, working memory, motor function, verbal fluency, reasoning and problem-solving, and processing speed. The assessment of overall cognitive
function was measured by the composite score derived from the six individual tests, with higher scores indicating better cognition.
Safety assessments
Safety assessments included the reported incidence and severity of adverse events (AEs) and serious adverse events (SAEs).
Sample size considerations
Sample size calculations were based upon a report compar-ing the drivcompar-ing simulation performance of subjects with sleep apnea to that of healthy control subjects.16 Selection of a sample size of 15 subjects with untreated RLS at study entry was based upon the LPV results from the Risser et al study16 with the following assumption: the SD of average LPV in untreated subjects with RLS was increased relative to healthy control subjects but less than that of subjects with sleep apnea (SD = 1.0). Accordingly, when the sample size was 15 subjects with RLS, a two-sided 90.0% confidence interval (CI) for a single mean would have extended approxi-mately 0.30 from the observed mean, assuming the SD was known to be 1.0 and the CI was based on the large-sample z statistic. Fifteen healthy control subjects were included in this study to facilitate comparison of the results for the group of subjects with RLS to those for healthy controls.
Data analysis
No statistical tests were performed except for analysis of the BAC results per the prospectively specified statistical analysis plan. The demographics (age, sex, race, and eth-nicity) and other subject characteristics applicable to both populations were summarized by subject population. These characteristics included weight, height, ESS score, total sleep time the night prior to the visit, wake time after sleep onset, and sleep quality. Descriptive statistics (sample size, mean, standard deviation, median, range, frequencies, and percentages) were used to summarize demographics and subject characteristics data. The group of subjects with RLS was further characterized by summarizing variables related to the presence and duration of RLS symptoms including RLS diagnostic criteria, previous RLS treatment, RLS symptom information, and IRLS rating. Descriptive statis-tics (n, mean, standard, deviation, median, range, and 95% confidence intervals of the mean) by subject population and, where applicable, by 10-minute epoch, were calculated for average lane position, LPV, average speed, speed variability, brake reaction time, total number of simulated crashes, and
Research and Reviews in Parkinsonism downloaded from https://www.dovepress.com/ by 118.70.13.36 on 27-Aug-2020
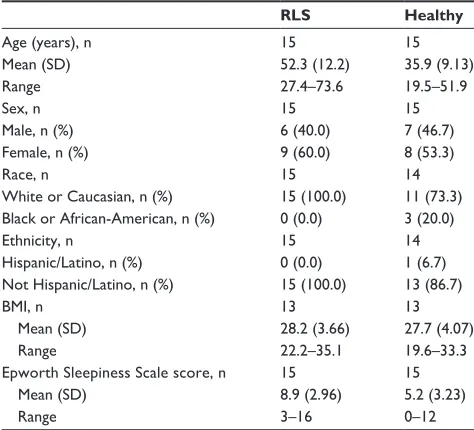
Table 1 Summary of demographic characteristics of the study population
RLS Healthy
age (years), n Mean (SD) Range
15 52.3 (12.2) 27.4–73.6
15 35.9 (9.13) 19.5–51.9 Sex, n
Male, n (%) Female, n (%)
15 6 (40.0) 9 (60.0)
15 7 (46.7) 8 (53.3) Race, n
White or caucasian, n (%) Black or african-american, n (%)
15 15 (100.0) 0 (0.0)
14 11 (73.3) 3 (20.0) ethnicity, n
hispanic/Latino, n (%) not hispanic/Latino, n (%)
15 0 (0.0) 15 (100.0)
14 1 (6.7) 13 (86.7) BMi, n
Mean (SD) Range
13 28.2 (3.66) 22.2–35.1
13 27.7 (4.07) 19.6–33.3 epworth Sleepiness Scale score, n
Mean (SD) Range
15 8.9 (2.96) 3–16
15 5.2 (3.23) 0–12
Abbreviations: BMi, body mass index; RLS, restless legs syndrome; SD, standard deviation.
Table 2 Mean lane position variability (ft) in the simulated driving tests on Day 1, 4 PM and Day 2, 8 aM
RLS, n = 15 Healthy, n = 15
Day 1, 4:00 PM
Mean (SD) 1.2 (0.31) 1.3 (0.58)
Median (range) 1.2 (0.7–2.0) 1.2 (0.6–3.1)
95% ci 1.0, 1.4 0.9, 1.6
Day 2, 8:00 aM
Mean (SD) 1.2 (0.28) 1.6 (1.07)
Median (range) 1.2 (0.9–1.8) 1.2 (0.6–5.2)
95% ci 1.1, 1.4 1.0, 2.2
Abbreviations: CI, confidence interval; RLS, restless legs syndrome; SD, standard
deviation.
Dovepress
chen et al
the alertness VAS score. The differences were considered when the 95% confidence intervals around the means of the two groups were not overlapping.
The scores of individual BAC subtests were standard-ized using the means and SD from the control population. The overall BAC composite score at each of the visits was then computed by taking the mean of the six standardized values. Repeated measures analysis of variance (ANOVA) with group and time as fixed effects was used to compare the BAC composite and individual scores between the two subject populations.
Results
Study population
Of the 47 subjects (19 healthy subjects and 28 subjects with RLS) screened, 30 were enrolled, equally distributed between the healthy volunteer group and the subject with RLS group, all of whom completed the study. Reasons for screening failure included having other co-morbid sleep disorders (4), withdrawal of consent (4), not meeting RLS severity entry criteria (3), unwilling to washout RLS medications (2), taking alcohol, caffeinated food/beverages or tobacco (1), unable to complete practice drive at screening (1), no valid driver’s license (1), and others (2). Demographic characteristics of the study population are summarized in Table 1. Both groups had a similar sex distribution. On average, subjects with RLS were 16 years older than the controls and had a higher mean ESS (±SD) score (8.9 ± 3.0 versus 5.2 ± 3.2).
The median duration of RLS treatment was 2.5 years and the mean number of days of reported RLS symptoms in the seven consecutive days prior to Day 1 was 5.2 days. Ten of the 15 subjects (66.7%) reported RLS symptoms prior to both visits. The majority (60.0%) of the subjects with RLS had no previous RLS treatment. The six subjects previously on RLS treatment who discontinued the treatment prior to study entry had been prescribed ropinirole (two subjects), pramipexole (two subjects), gabapentin, clonazepam, acetaminophen/diphenhydramine, aspirin, and carbidopa-levodopa (one subject each). The average IRLS Rating score was 23.1 ± 5.09 (out of a total score of 40, with 0 being no symptoms and 40 being very severe symptoms), consistent with moderate-to-severe RLS.
Lane position variability
Lane position variability is presented by group in Table 2. Median LPV was similar between both study groups. Mean LPV in the afternoon for subjects with RLS was similar to mean LPV on the following morning. Healthy subjects had a mean LPV of 1.3 ft in the afternoon and 1.6 ft in the morning.
Mean LPV for each individual is displayed in Figure 1. The majority of subjects in both groups had mean LPV ,1.4 ft on both simulated driving tests. Two subjects with RLS and three healthy subjects had mean LPV .1.4 ft on both tests. Two additional healthy subjects had mean LPV .1.4 ft only in the morning on the Day 2 testing. One healthy subject was identified as an outlier, with an LPV of 3.1 ft in the afternoon on Day 1 and an LPV of 5.2 ft in the morning on Day 2.
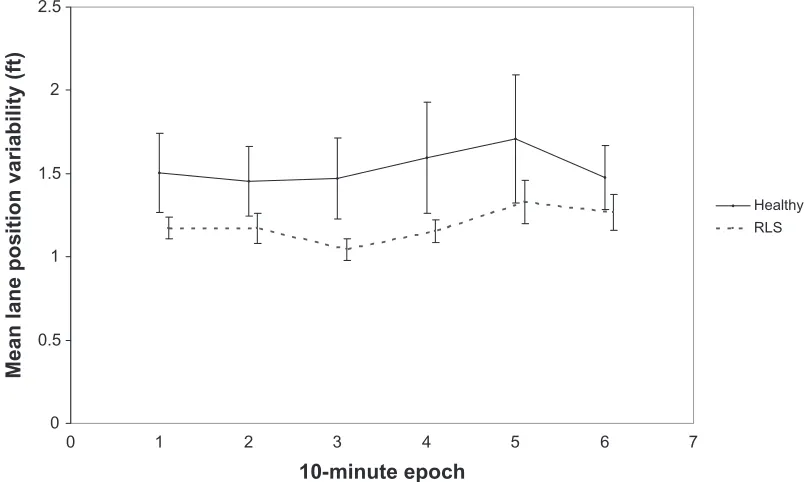
Mean LPV was similar between the two study groups for all six epochs on Day 1 (Figure 2). On Day 2, subjects with RLS recorded numerically less LPV for each epoch compared to healthy subjects, with mean differences ranging from 0.2 ft (Epoch 6) to 0.5 ft (Epoch 3; Figure 3). No obvious increase in LPV over time was observed in either group during either simulated driving test.
Research and Reviews in Parkinsonism downloaded from https://www.dovepress.com/ by 118.70.13.36 on 27-Aug-2020
0 0.5 1 1.5 2 2.5 3 3.5 4 4.5 5 5.5
Day 1, 4 PM Day 2, 8 AM Day 1, 4 PM Day 2, 8 AM
Healthy RLS
Mean lane position variability (ft
)
Figure 1 Mean LPV in individual subjects on Day 1, 4 PM and Day 2, 8 aM assessments.
Abbreviations: LPV, lane position variation; RLS, restless legs syndrome.
0 0.5 1 1.5 2
0 1 2 3 4 5 6 7
10-minute epoch
Mean lane position variability (ft)
Healthy RLS
Figure 2 average LPV by epoch on Day 1, 4 PM.
Note: The bars on the graph represent standard error.
Abbreviations: LPV, lane position variation; RLS, restless legs syndrome.
Dovepress Driving performance with restless legs syndrome
Exclusion of the single outlier in the analysis yielded mean LPV (SD) of 1.1 ft (0.30) on Day 1 and 1.3 ft (0.40) on Day 2 for healthy subjects, narrowing the overall LPV difference between the two study groups to ,0.1 ft and by epoch ,0.2 ft.
Speed variability
Mean speed variability, as illustrated in Table 2, was similar between the two assessments within each group and was slightly lower for the healthy subjects regardless of the time of assessment.
Research and Reviews in Parkinsonism downloaded from https://www.dovepress.com/ by 118.70.13.36 on 27-Aug-2020
Table 3 number of simulated crashes (off-road events)
RLS, n = 15 Healthy, n = 15
Day 1, 4:00 PM – Overall (0 to 60 minutes), n (%)
0 off-road events 15 (100.0) 13 (86.7)
1 off-road event 0 (0.0) 2 (13.3)
2 off-road events 0 (0.0) 0 (0.0)
3 off-road events 0 (0.0) 0 (0.0)
Day 2, 8:00 aM – Overall (0 to 60 minutes), n (%)
0 off-road events 13 (86.7) 15 (100.0)
1 off-road event 1 (6.7) 0 (0.0)
2 off-road events 0 (0.0) 0 (0.0)
3 off-road events 1 (6.7) 0 (0.0)
Abbreviation: RLS, restless legs syndrome.
Table 4 Brake reaction time results
RLS, n = 15 Healthy, n = 15
Day 1, 4:00 PM – break reaction time (seconds), n
15 14
Mean (SD) 0.47 (0.09) 0.46 (0.10)
Median (range) 0.45 (0.31–0.64) 0.48 (0.28–0.60)
95% ci 0.42, 0.52 0.40, 0.51
Day 2, 8:00 aM – break reaction time (seconds), n
15 15
Mean (SD) 0.48 (0.12) 0.49 (0.17)
Median (range) 0.47 (0.28–0.78) 0.50 (0.27–0.97)
95% ci 0.41, 0.54 0.40, 0.59
Abbreviations: CI, confidence interval; RLS, restless legs syndrome; SD, standard deviation.
0 0.5 1 1.5 2 2.5
0 1 2 3 4 5 6 7
10-minute epoch
Mean lane position variability (ft
)
Healthy RLS
Figure 3 Mean LPV by epoch on Day 2, 8 aM.
Note: The bars on the graph represent standard error.
Abbreviations: LPV, lane position variation; RLS, restless legs syndrome.
Dovepress
chen et al
number of simulated crashes
The number of simulated crashes, all off-road events, experi-enced during simulated driving testing is presented by group in Table 3. Two subjects within each group experienced one or more off-road events. No subjects with RLS experienced simulated crashes when tested on Day 1 in the afternoon, while two subjects experienced off-road events when tested on Day 2 the following morning. One subject had an off-road event and another had three off-road events, all occurring in Epoch 5 or 6. On Day 1, one healthy subject experienced an off-road event in Epoch 3 and another experienced an off-road event in Epoch 5. No healthy subject experienced off-road events during Day 2.
Brake reaction time
Mean brake reaction time was similar between the two study groups regardless of the time of assessment with differences #0.01 seconds (Table 4).
alertness
Results of alertness assessment by VAS prior to and follow-ing the simulated drivfollow-ing tests on both days are presented in Figure 4. Subjects with RLS reported lower mean VAS scores, indicating less alertness, compared to healthy subjects at all time points. The difference in the pre-drive VAS scores on Day 1 approached statistical significance with minimum overlapping of the 95% confidence intervals. Within both
Research and Reviews in Parkinsonism downloaded from https://www.dovepress.com/ by 118.70.13.36 on 27-Aug-2020
0 10 20 30 40 50 60 70 80 90 100
RLS Healthy RLS Healthy
Day 1, 4 PM Day 2, 8 AM
VAS scor
e
Pre-drive Post-drive
Figure 4 Mean (SD) scores of VaS alertness in RLS and healthy subjects prior to and after the simulated driving testing on Day 1 and Day 2.
Abbreviations: RLS, restless legs syndrome; SD, standard deviation; VaS, visual analog scale.
Dovepress Driving performance with restless legs syndrome
RLS and healthy subject populations, the mean post-drive VAS scores were lower compared to the mean pre-drive scores. When tested at 4 PM, subjects with RLS and healthy subjects reported similar mean decreases (∼24) in VAS scores post-drive compared to pre-drive. When tested at 8 AM, subjects with RLS reported a greater decrease (∼20) in post-drive VAS scores from pre-drive compared to healthy subjects (∼14).
cognition
There were no statistically significant differences between the two groups on the BAC composite score. As shown in Table 5, both subjects with RLS and healthy subjects per-formed similarly on Day 1 with subjects with RLS scoring slightly higher (54.8 versus 51.5); however, this difference was not statistically significant (P= 0.297). On Day 2, the mean composite scores were identical in both groups (55.9). While RLS subjects performed slightly better than normal subjects on Day 1 on 5 of the 6 individual measures (exclud-ing the Token Motor test), the difference disappeared as nor-mal subjects improved on the follow-up test on Day 2. RLS subjects performed slightly worse on the Token Motor test (which tests motor speed skills) compared to normal subjects at both days (Table 5). The differences between the two study groups on any of the six cognitive domains of the BAC were not statistically significant (all P-values .0.05).
Sleep assessment
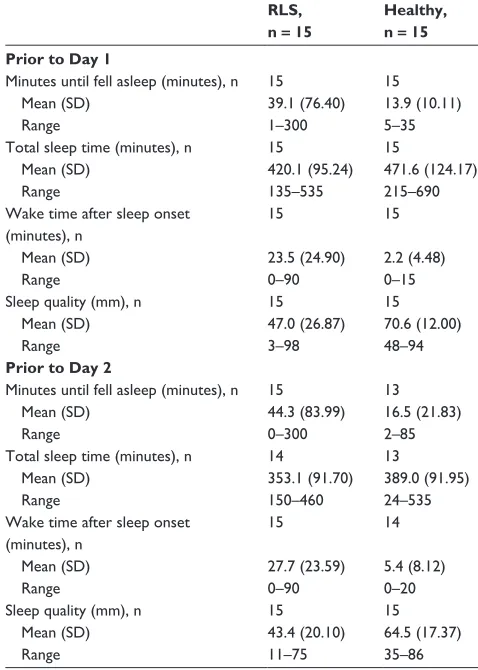
Results of PghSD recorded for the night prior to Day 1 and prior to Day 2 are presented in Table 6. On average, subjects with RLS reported a longer time to fall asleep compared to healthy subjects on the nights prior to Day 1 (39.1 minutes versus 13.9 minutes), and Day 2 (44.3 minutes versus 16.5 minutes). Subjects with RLS also reported a lower mean total sleep time compared to healthy subjects prior to Day 1 (420.1 minutes versus 471.6 minutes), and Day 2 (353.1 minutes versus 389.0 minutes). Further, subjects with RLS reported longer mean wake times after sleep onset compared to healthy subjects prior to Day 1 (23.5 minutes versus 2.2 minutes), and Day 2 (27.7 minutes versus 5.4 minutes). Consistent with these measures, subjects with RLS had a lower mean sleep quality score compared to healthy subjects prior to Day 1 (47.0 versus 70.6), and Day 2 (43.4 versus 64.5).
Safety results
Four subjects with RLS and two healthy subjects reported simi-lar driving-related AEs (Table 7). Headache (10%), dizziness (6.7%), nausea (6.7%), and shaky arms (3.3%) were reported as mild or moderate in intensity and resolved within one day.
Discussion
We hypothesized that patients with RLS had the potential for impaired driving performance because they have
insom-Research and Reviews in Parkinsonism downloaded from https://www.dovepress.com/ by 118.70.13.36 on 27-Aug-2020
Table 7 Summary of adverse events
Number (%) of subjects
RLS, n = 15 Healthy, n = 15
any event 4 (26.7) 2 (13.3)
headache 1 (6.7) 2 (13.3)
Dizziness 1 (6.7) 1 (6.7)
nausea 1 (6.7) 1 (6.7)
Shaky arms 1 (6.7) 0 (0.0)
Table 5 Mean Bac composite score and 6 subscale scores on Day 1 and Day 2
RLS n = 14
Normal n = 15
composite score Day 1, 4:00 PM
Mean (Se) 55 (2.2) 52 (2.1)
95% ci 50, 59 47, 56
Day 2, 8:00 aM
Mean (Se) 56 (2.3) 56 (2.1)
95% ci 51, 60 51, 60
Verbal memory Day 1, 4:00 PM
Mean (Se) 52 (2.3) 48 (2.3)
95% ci 47, 57 44, 53
Day 2, 8:00 aM
Mean (Se) 49 (2.1) 47 (2.01)
95% ci 44, 53 44, 52
Digit sequencing Day 1, 4:00 PM
Mean (Se) 50 (3.0) 47 (2.9)
95% ci 44, 56 42, 53
Day 2, 8:00 aM
Mean (Se) 49 (2.9) 49 (2.8)
95% ci 43, 55 43, 55
Token motor Day 1, 4:00 PM
Mean (Se) 50 (2.7) 54 (2.6)
95% ci 45, 56 49, 60
Day 2, 8:00 aM
Mean (Se) 54 (3.0) 57 (2.9)
95% ci 48, 60 51, 63
Verbal fluency
Day 1, 4:00 PM
Mean (Se) 60 (2.3) 54 (2.2)
95% ci 55, 65 49, 58
Day 2, 8:00 aM
Mean (Se) 60 (2.4) 55 (2.4)
95% ci 55, 65 50, 60
Symbol coding Day 1, 4:00 PM
Mean (Se) 55 (2.2) 52 (2.10)
95% ci 50, 59 48, 57
Day 2, 8:00 aM
Mean (Se) 57 (2.9) 60 (2.8)
95% ci 51, 63 54, 66
Tower of London Day 1, 4:00 PM
Mean (Se) 51 (2.68) 46 (2.6)
95% ci 46, 57 41, 51
Day 2, 8:00 aM
Mean (Se) 54 (1.7) 54.33 (1.65)
95% ci 51, 58 51, 58
Abbreviations: BAC, Brief Assessment of Cognition; CI, confidence interval; RLS,
restless legs syndrome; Se, standard error.
Table 6 Summary of Pittsburgh Sleep Diary results prior to Day 1 and Day 2
RLS, n = 15
Healthy, n = 15 Prior to Day 1
Minutes until fell asleep (minutes), n 15 15
Mean (SD) 39.1 (76.40) 13.9 (10.11)
Range 1–300 5–35
Total sleep time (minutes), n 15 15
Mean (SD) 420.1 (95.24) 471.6 (124.17)
Range 135–535 215–690
Wake time after sleep onset (minutes), n
15 15
Mean (SD) 23.5 (24.90) 2.2 (4.48)
Range 0–90 0–15
Sleep quality (mm), n 15 15
Mean (SD) 47.0 (26.87) 70.6 (12.00)
Range 3–98 48–94
Prior to Day 2
Minutes until fell asleep (minutes), n 15 13
Mean (SD) 44.3 (83.99) 16.5 (21.83)
Range 0–300 2–85
Total sleep time (minutes), n 14 13
Mean (SD) 353.1 (91.70) 389.0 (91.95)
Range 150–460 24–535
Wake time after sleep onset (minutes), n
15 14
Mean (SD) 27.7 (23.59) 5.4 (8.12)
Range 0–90 0–20
Sleep quality (mm), n 15 15
Mean (SD) 43.4 (20.10) 64.5 (17.37)
Range 11–75 35–86
Abbreviations: RLS, restless legs syndrome; SD, standard deviation.
Dovepress
chen et al
two groups in outcome measures of driving performance, including LPV, speed variability, and brake reaction time. In addition, there was no difference in the cognitive function between the two groups. This was true even though there were lower VAS alertness scores, disturbed sleep, and more sleepiness reported by the patients with RLS.
Within the group of subjects with RLS, there was no dif-ference in the mean LPV between the PM and the AM driving performances despite a slightly lower mean VAS alertness score in the morning (Day 2) compared to the afternoon on Day 1. A recent survey showed that when asked about the next-day impact of RLS, patients with RLS reported fatigue,
nia and sleep disturbance that produce daytime sleepiness. In the present study we found untreated RLS patients and healthy subjects had similar simulated driving performance both in the morning and afternoon. The study results did not demonstrate a clinically meaningful difference between the
Research and Reviews in Parkinsonism downloaded from https://www.dovepress.com/ by 118.70.13.36 on 27-Aug-2020
Dovepress Driving performance with restless legs syndrome
This study had some limitations. First, no objective sleep assessments, eg, polysomnography, were performed at base-line. Thus, PLMS and severity of disturbed sleep in the RLS group are unknown along with pressure to sleep (sleepiness) as would be measured by multiple sleep latency testing (MSLT). In this study, the self-reported sleep disturbance based on item 4 of the IRLS ranged from mild (2 subjects) to moderate (8) to severe (5), and no subjects reported none or very severe disturbance. The mean wake time after sleep onset (WASO) reported by the RLS subjects placed them in the category of mild-to-moderate sleep disturbance.29 Possibly, the perception of poor sleep in the RLS group contributed to the reports of decreased alertness and increased sleepiness in comparison to their healthy counterparts. For the control group, in addition to relying on medical history records, inclusion of objective assessments would have helped to exclude any healthy control subject with habitual disturbed sleep undiagnosed at screen-ing. Second, the lack of electromyography (EMG) and elec-troencephalography (EEG) during the driving assessment as objective measurements created a gap in potential correlation between simulated driving performance with RLS symptoms, sleepiness, and daytime alertness.
In this study, we report that patients with restless legs syndrome have simulated driving performance and cognitive function similar to healthy subjects.
Conclusion
Results of this pilot study comparing currently untreated patients with RLS to healthy subjects demonstrated that RLS-related sleep disturbance and decreased daytime alert-ness were not significantly associated with impairment in simulated driving performance or cognitive function.
Acknowledgments
The authors thank Richard Keefe, PhD (NeuroCog Trials, Inc.), for assistance in BAC data analysis and interpretation. This study was funded by XenoPort, Inc.
Institution where the work was performed: Study XP088 (RXP111496) was conducted at the Northwest Kinetics, Charles River Clinical Services NW, 3615 Pacific Avenue, Tacoma, Washington 98418, USA. The investigator was Paula Shaw, MD, and the administration of the study was the responsibility of the sponsor, XenoPort, Inc.
Disclosure
Dr Chen is currently an employee of XenoPort, Inc.; Dr Shaw has no financial connection to XenoPort, Inc.; Dr Canafax is a former employee of XenoPort, Inc.; Dr Ware is a consultant to XenoPort, Inc.
lack of energy, sleepiness, and cognitive deficit, such as dif-ficulty concentrating, feeling forgetful, and less alert.26 Thus, the lack of effect of RLS on the AM simulated driving as measured by mean LPV was not expected. Additionally, no worsening of mean LPVs by epoch or after a 40-minute drive was observed in subjects with RLS, a phenomenon that was typically seen in sleep-deprived and obstructive sleep apnea (OSA) patients.15,16,27
The overall incidence of off-road events was 13% for both groups with two subjects with RLS having a total of four off-road events and two healthy subjects having two off-road events. In contrast, the incidence of off-road events reported by OSA patients who used an identical simulator setup and driving scenario was 73% (Risser, personal communication, June 2008).16 Unlike the OSA patients, the driving perfor-mance in the RLS patients in this study did not appear to be affected by their sleep disturbance and daytime sleepiness.
A recent study by Gieteling et al reported that subjects with periodic limb movement disorder (PLMD) performed worse than the controls in a simulated driving assessment as measured by change in median LPV and the slope of median LPV versus time, but better than the subjects with OSA.28 The study further showed that the simulated driving performance correlated with the ESS but not with the subjective sleepiness level reported prior to each test nor with the objective measure of sleep time. The severity of daytime sleepiness as measured by ESS (median score of 9) in subjects with RLS in the current study was identical to that of the PLMD patients in Gieteling’s study. Subjects with RLS, therefore, were expected to show some degree of simulated driving impairment similar to subjects with PLMD. The subjects with PLMD in Gieteling’s study did not have daytime complaints of RLS although they were required to have insomnia or excessive daytime sleepiness. It is unclear whether the RLS symptoms that may have been experienced by the patients while driving in the current study played any role in their driving performance.
Gamaldo et al reported prolonged sleep latency in the morning and in the evening in subjects with RLS as assessed by a modified Maintenance of Wakefulness Test when compared to controls that were age-, sex-, and total sleep time-matched and sleep-restricted.6 Subjects with RLS could better sustain alertness than sleep-restricted controls although how this could occur in RLS patients is not under-stood. Interestingly, the heightened alertness in RLS patients has been reported by Gamaldo et al and may compensate for fatigue and contribute to normal simulated driving performance. Possibly a form of hypervigilance improved RLS patients’ performance during the simulated driving test and contributed to their reported sleep problems.
Research and Reviews in Parkinsonism downloaded from https://www.dovepress.com/ by 118.70.13.36 on 27-Aug-2020
Journal of Parkinsonism & Restless Legs Syndrome
Publish your work in this journal
Submit your manuscript here: http://www.dovepress.com/journal-of-parkinsonism--restless-legs-syndrome-journal
Journal of Parkinsonism and Restless Legs Syndrome is an online, open access, peer-reviewed journal. The journal publishes review articles, historical reviews, original research articles, case reports, letters to the editor, clinical teaching cases, neuroradiology highlights, neuropathol-ogy highlights, neuropsychiatry highlights, autobiographies, conference
proceedings, abstracts and book reviews. The manuscript management system is completely online and includes a very quick and fair peer-review system, which is all easy to use. Visit http://www.dovepress.com/ testimonials.php to read real quotes from published authors.
Dovepress
Dove
press
chen et al
References
1. Hornyak M, Feige B, Voderholzer U, Philipsen A, Riemann D. Polysomnography findings in patients with restless legs syndrome and in healthy controls: a comparative observational study. Sleep. 2007;30(7):861–865.
2. Phillips B, Hening W, Britz P, Mannino D. Prevalence and correlates of restless legs syndrome: results from the 2005 National Sleep Foundation Poll. Chest. 2006;129(1):76–80.
3. Ulfberg J, Bjorvatn B, Leissner L, et al; Nordic RLS Study Group. Comorbidity in restless legs syndrome among a sample of Swedish adults. Sleep Med. 2007;8(7–8):768–772.
4. Cuellar NG, Strumpf NE, Ratcliffe SJ. Symptoms of restless legs syndrome in older adults: outcomes on sleep quality, sleepiness, fatigue, depression, and quality of life. J Am Geriatr Soc. 2007;55(9): 1387–1392.
5. Saletu B, Anderer P, Saletu M, Hauer C, Lindeck-Pozza L, Saletu-Zyhlarz G. EEG mapping, psychometric, and polysomnographic studies in restless legs syndrome (RLS) and periodic limb movement disorder (PLMD) patients as compared with normal controls. Sleep Med. 2002;3 Suppl:S35–S42.
6. Gamaldo C, Benbrook AR, Allen RP, Oguntimein O, Earley CJ. Evaluating daytime alertness in individuals with Restless Legs Syn-drome (RLS) compared to sleep restricted controls. Sleep Med. 2009; 10(1):134–138.
7. Pearson VE, Allen RP, Dean T, Gamaldo CE, Lesage SR, Earley CJ. Cognitive deficits associated with restless legs syndrome (RLS). Sleep Med. 2006;7(1):25–30.
8. Fulda S, Beitinger ME, Reppermund S, Winkelmann J, Wetter TC. Short-term attention and verbal fluency is decreased in restless legs syndrome patients. Mov Disord. 2010;25(15):2641–2648.
9. Saletu B, Anderer P, Saletu M, Hauer C, Lindeck-Pozza L, Saletu-Zyhlarz G. EEG mapping, psychometric, and polysomnographic studies in restless legs syndrome (RLS) and periodic limb movement disorder (PLMD) patients as compared with normal controls. Sleep Med. 2002;3 Suppl:S35–S42.
10. Celle S, Roche F, Kerleroux J, et al. Prevalence and clinical correlates of restless legs syndrome in an elderly French population: the synapse study. J Gerontol A Biol Sci Med Sci. 2010;65(2):167–173.
11. Fulda S, Szesny N, Ising M, et al. Further evidence for executive dys-function in subjects with RLS from a non-clinical sample. Sleep Med. 2011;12(10):1003–1007.
12. Driver-Dunckley E, Connor D, Hentz J, et al. No evidence for cog-nitive dysfunction or depression in patients with mild restless legs syndrome. Mov Disord. 2009;24(12):1840–1842.
13. Shechtman O, Classen S, Awadzi K, Mann W. Comparison of driving errors between on-the-road and simulated driving assessment: a valida-tion study. Traffic Inj Prev. 2009;10(4):379–385.
14. Marcotte TD, Roberts E, Rosenthal TJ, Heaton RK, Bentley H, Grant I. Test-retest reliability of standard deviation of lane position as assessed on a PC based driving simulator. Presented at: 2nd International Driv-ing Symposium on Human Factors in Driver Assessment, TrainDriv-ing and Vehicle Design; July 21–25, 2003; Park City, Utah.
15. May JF, Ware JC, Vorona RD. The relationship of driving simula-tor performance to multiple sleep latency test results. Sleep. 2005; 28(Suppl):A345. Abstract.
16. Risser MR, Ware JC, Freeman FG. Driving simulation with EEG monitoring in normal and obstructive sleep apnea patients. Sleep. 2000;23(3):393–398.
17. Brunnauer A, Laux G, Zwick S. Driving simulator performance and psychomotor functions of schizophrenic patients treated with antipsychotics. Eur Arch Psychiatry Clin Neurosci. 2009;259(8): 483–489.
18. Kaussner Y, Kenntner-Mabiala R, Hoffmann S, Klatt J, Tracik F, Krüger HP. Effects of oxcarbazepine and carbamazepine on driv-ing ability: a double-blind, randomized crossover trial with healthy volunteers. Psychopharmacology (Berl). 2010;210(1):53–63. 19. Takahashi M, Iwamoto K, Kawamura Y, et al. The effects of acute
treat-ment with tandospirone, diazepam, and placebo on driving performance and cognitive function in healthy volunteers. Hum Psychopharmacol. 2010;25(3):260–267.
20. Kushida CA, Becker PM, Ellenbogen AL, Canafax DM, Barrett RW; XP052 Study Group. Randomized, double-blind, placebo-controlled study of XP13512/GSK1838262 in patients with RLS. Neurology. 2009;72(5):439–446.
21. Lee DO, Ziman RB, Perkins AT, Poceta JS, Walters AS, Barrett RW; XP053 Study Group. A randomized, double-blind, placebo-controlled study to assess the efficacy and tolerability of gabapentin enacarbil in subjects with restless legs syndrome. J Clin Sleep Med. 2011;7(3): 282–292.
22. Johns MW. A new method for measuring daytime sleepiness: the Epworth sleepiness scale. Sleep. 1991;14(6):540–545.
23. Monk TH, Reynolds CF, Kupfer DJ, et al. The Pittsburgh Sleep Diary.
J Sleep Res. 1994;3:111–120.
24. Keefe RS, Goldberg TE, Harvey PD, Gold JM, Poe MP, Coughenour L. The Brief Assessment of Cognition in Schizophrenia: reliability, sensi-tivity, and comparison with a standard neurocognitive battery. Schizophr Res. 2004;68(2–3):283–297.
25. Keefe RS, Poe M, Walker TM, Harvey PD. The relationship of the Brief Assessment of Cognition in Schizophrenia (BACS) to functional capacity and real-world functional outcome. J Clin Exp Neuropsychol. 2006;28(2):260–269.
26. Lasch KE, Abraham L, Patrick J, Piault EC, Tully SE, Treglia M. Development of a next day functioning measure to assess the impact of sleep disturbance due to restless legs syndrome: the restless legs syndrome-next day impact questionnaire. Sleep Med. 2011;12(8): 754–761.
27. Ware JC, Risser MR, Manser T, Karlson KH. Medical resident driving simulator performance following a night on call. Behav Sleep Med. 2006;4(1):1–12.
28. Gieteling EW, Bakker MS, Hoekema A, Maurits NM, Brouwer WH, van der Hoeven JH. Impaired driving simulation in patients with Peri-odic Limb Movement Disorder and patients with Obstructive Sleep Apnea Syndrome. Sleep Med. 2012;13(5):517–523.
29. Bogan RK, Ellenbogen A, Becker PM, et al. Gabapentin enacarbil in subjects with moderate to severe primary restless legs syndrome with and without severe sleep disturbance an integrated analysis of subjec-tive and novel sleep endpoints from two studies. J Parkinsonism and Restless Legs Syndrome. 2013;3:31–40.
Research and Reviews in Parkinsonism downloaded from https://www.dovepress.com/ by 118.70.13.36 on 27-Aug-2020