Investigate The Relationship Between Brand
Equity, Brand Loyalty And Customer Satisfaction
Farbod Souri
Abstract: The purpose of this study, conducted an empirical study in the field of marketing in order to investigate the relationship between brand equity, brand loyalty and customer satisfaction in Refah stores in which Nam and colleagues model (2011) have been used. In this model, the relationship between brand equity and brand loyalty and customer satisfaction is evaluated. To review research a sample of 384 customers was selected as a stepwise clustering. Data gathered by standard questionnaire with 23 questions that its validity and reliability confirmed and was distributed among the statistical population. Data analysis was performed using descriptive statistics and inferential statistics. At the level of Descriptive statistics, indices such as frequency and frequency percentage were used and in inferential statistics, correlation methods, structural equation modeling, path analysis has been done using the spss and lisrel software. The results of the analysis showing the existence of a significant and positive relationship of brand equity on customer satisfaction and loyalty. In general, the ability of Refah store to increase customer satisfaction and brand loyalty of customers to Refah brand being associated with the brand equity (05/0> p).
Keywords: brand equity, brand loyalty, customer satisfaction
————————————————————
Introduction
In today's marketing world brand equity concept is fascinating and appealing. Brand share can be successfully developed through better management of customer relationship and honoring him and pay attention to his needs. This is obvious that determine brand loyalty and its relationship to behavior and consumer satisfaction in the various markets and products is different. But loyalty Create significant advantages such as increased sales, forming a barrier against competitors, increase the company's ability to respond to the threat of competitors, and make customers less likely to respond to the actions of their competitors (Sven Kuenzel and Ewa Krolikowska, 2008). Almost any business can not survive without the loyal customers and one of the most stable ways to achieve this important , is to strengthen the organization's brand,in this study we want to investigate the relationship between brand equity, brand loyalty and customer satisfaction of Refah stores.
1-Research statement
Today, many organizations have come to believe that one of the most valuable assets is its brand, products and services. Many researchers also mentioned that creating a powerful brand is one of the key factors for access to competitive advantage and long-term survival in the market (Santos et al., 2013). A strong brand creates value for both the customer and the organization. On the one hand brands provides brief and useful tools to simplify the process of selecting and purchasing their product or service to the customer and make the data and information processing simpler and faster and thereby create value for customers. On the other hand, production and product design processes may simply be copied, but the image and the role that remained in the minds of individuals and organizations based on several years of marketing and brand experience, cannot be replaced and copy easily (Keller, 2008). A brand is a part of a trademark that is able to say, but a brand can not be spoke and identifying only by those goods that have exclusive rights or copyright.Therefore, all copyrights, reproduction and print subject to the rules of a trademark spoken about the quality of goods, so the buyer will be legal on this basis (Ambler et al., 2002). They can ensure that under this name they
always consume the same commodity with previous product quality, so the market division by name and type of the goods order will be easier for the seller. A brand increased innovation and provide required drive to search for new features to producers and will cause variation in product and greater choice for consumers and by creating competition between trademarks will create a kind of names war. Aaker (2004) knows brand as a symbol, associated with a large number of assets and mental liabilities and aims to identify and differentiate product (Keeler, 1998). Kapferer (1997) states: Brand summarize a word or a symbol, ideas and sentence and a long list of attributes, values and ethical principles of a product or service. A brand, is the abstract of the identity, authenticity, specificity, and the difference ,it can be said that brand equity cannot be identified without knowing and the rigorous testing their resources because the value of the brand is rooted in two sources:A) a consumer level of experience with the product. B) the brand image (Buderr, 2008). It seems that brand management in one or two past decades was a relatively simple task. But in today's world, brand management, in addition to its importance in terms of the shares, profitability and value of capital, it may be very complex that one of the reasons is the dynamic nature of today's global market. As a result, companies can determine higher price for their products on the basis of a powerful brand, create better business leverage, increase their margins and profits and reduce their vulnerability in the face of competitors (Aaker & Joachimsthaler, 2000). Based on these considerations, the necessity of study determining the relationship between brand equity, brand loyalty and customer satisfaction of products in Refah store. The question that arises here is there a relationship between brand equity, brand loyalty and customer satisfaction?
2- literature and research background
2-1 definition of brand equity
et al., 2001) According to Kotler and Armstrong definition , brand equity is a positive attitude that the customer's shows to goods and services (Mark Byrne et al., 2005). According to Bern Mark definition (2005) brand equity perceived from the perspective of the consumer or brand equity based on customer occurs when the consumer is familiar with the brand and has unique, strong and favorable reminder of brand in his mind. In all definitions for the brand and brand equity something is common is that all believe that ,commodity that have a name , create added value that it hasn’t this without a name. So we can say the most comprehensive definition of brand equity is provided by Aker as follows: Set of the brand assets and liabilities and responsibilities associated with the brand that increase the value made by product or service for the company and its customers or reduces it (Papua et al., 2005). He also believes that the value of a the brand depends on the number of customers who purchased that brand ,continuously (Yassin et al., 2007)
2-2 brand loyalty
When a customer continued to his purchases of a trademark, loyalty to the brand and the origin of the brand is an important variable that can affect the brand equity. Marketing managers in the international arena are aware of the importance of this issue and identified resources of brand and trademark (Bahrami, 2012). The large number of customers loyal to a brand are the company's assets and considered as a brand equity main index. And also the sensitivity of loyal customers to change prices as compared to non-loyal customers are less. While most researchers in the field of loyalty, focus on repetition of consuming goods purchases (Miller et al., 2006: 442). Two groups of theoretical scale for brand loyalty are measured: attitudinal and behavioral measures. Focus of the attitudinal scales is on planned commitment. Some of the attitudinal scales of brand loyalty point to the word of mouth or additional purchase. For example, behavioral scales of brand loyalty, including participation in the wallet, the percentage of brand purchase in the product category for handling consumer goods and again repurchase behavior (Kersman et al., 2006; 960). Brand loyalty means repeating the purchase that the reason for this behavior is mental processes. In other words, repeating purchase is not merely a voluntary reaction, but it is the result of mental, emotional and norm. Many researchers believe that behavioral loyalty alone cannot explain the actual reasons of purchase and therefore attitudinal dimensions should be considered (Baloglu, 2002; 49).
2-4 Brand satisfaction and loyalty
Dick and Basu expressed that loyalty mustn’t be seen just as repeated repurchase behavior, but in the study about the loyalty ,other outcomes must be considered such as: willingness to repurchase, willingness to loyalty, willingness to expand relations and pay more for a product or service (Fullerton , 2003). In the relationship marketing, researchers considered customer loyalty as an important variable , while many times they have considered Advocacy as the form of vague loyalty -Because its measurement isn’t easy and objective like the evaluation of customer retention, advocacy or Word of Mouth - but it has a rich style of research in the field of marketing. Researchers also find
that creation of reference customer -those who tend to desirable brands recommend to others – have very important consequences on the experience gained from their use.
2-5 Customer Satisfaction
Customer satisfaction leads to competitive advantages and finally customer loyalty and repeat purchase. Benefits of customer satisfaction include increased revenue, reduce transaction costs and reduce the price elasticity in loyal buyers (Jeffrey, 2009). Three main factors that involved in the Customer satisfaction is the use of the product, its appearance and quality of services. Product application and its appearance directly effects on product satisfaction and dissatisfaction. And also enjoy the product as an intermediary between the benefit and the appearance with satisfaction or dissatisfaction of the product. Service quality positively influences on the customer satisfaction and perceived value and perceived value positively affects on customer satisfaction and intent after purchase and also satisfaction positively influences on intent after purchase. So service quality has an indirect positive impact on the intent after purchase through customer satisfaction or its perceived value (Yu et al., 2009). The difference between expectations and perceptions of service quality is low, consumers will show more loyalty in post-purchase behavior and if the difference between expectations and perceptions of service quality is higher, consumers will be Further unsatisfied and tends to other brands (Lai and Babyn, 2009).
2.6 section 4: research background
customer in the market and industrial organizations. A weakness in this study was to evaluate the brand equity from the customer perspective, opinion and perception of managers were investigated Which cannot represent a real understanding of customers. The researchers stated that internal brand equity including the brand loyalty of staff and inter - role and extra-role behaviors associated with the brand. The other results of this study is confirmation of the positive effect of brand knowledge, brand involvement and brand oriented on brand equity within the organization. Chen & Myagmarsuren (2012) in their study , investigate the relationship between brand equity, relationship quality, value and customer loyalty in the Telecommunications service industry. In the study that was carried out on a sample of 236 persons from customers ,showed that the brand and corporate image significantly affect the quality of the relationship and also affects the quality of the relationship between the value of the relationship. It was also found that customer loyalty will not be directly affected by the quality of the relationship and mental image dimension But This effects are mediated through value the quality. Finally, it was shown that the quality of the relationship and the relationship value between brand equity and customer loyalty have mediating role in this industry.
3-research model
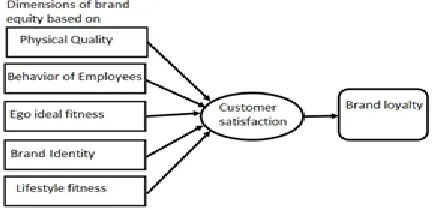
In order to achieve the goal of research that was investigation of the brand equity impact on customer satisfaction and customer loyalty,Janjiou et al. model which presented in 2011 was used. This model consists of three variables that include brand equity, customer satisfaction and brand loyalty . Each of these variables can be calculated by a number of determined and measurable indicators. These indicators, in turn, investigating the' customers attitude toward brand equity and brand loyalty, by the questions that asked From them. Customer satisfaction is as A principle essential for long-term success of the business. Although much research has been done on the subject, but studies only have measured the impact of satisfaction on behavioral and attitudinal loyalty. Nam and colleagues (2011) examined the Effect of consent as A special mediator on the relationship between the brand equity and brand loyalty, but in their model dimensions such as brand awareness that is the main variables affecting the brand equity in different models, including Aaker (1991) and Kympakon and Tucker (2010) are not mentioned, this study researchers want to add this important dimension to the Nam at al. model and examine this aspect. The relationship in this model shows that the brand equity and brand loyalty are related both directly and indirectly.
Figure 1: The relationship between brand equity and brand loyalty. Nam and colleagues (2011)
4- Hypothesis or research questions
4-1 The main hypothesis
- Brand equity has a significant impact on customer satisfaction.
- Brand equity has a significant impact on brand loyalty. - Customer satisfaction has a significant impact on brand
loyalty.
4-2 subsidiary hypothesis
- physical quality has a significant impact on customer satisfaction.
- employee behavior has a significant impact on customer satisfaction.
- Self-concept ideal has a significant impact on customer satisfaction.
- brand identity has a significant impact on customer satisfaction.
- lifestyle fit has a significant impact on customer satisfaction.
5- Methods
Considering that the aim of this research is "to investigate the relationship between brand equity, brand loyalty and customer satisfaction", it is practical In terms of purpose and it is descriptive and correlational in terms of data collection. Also, according to that method of structural equation modeling will be used to test the hypothesis, this study is correlational matrix analysis or covariance among the correlational research. Also the data analysis in This research was performed using descriptive and inferential statistics. Through descriptive statistics indicators such as frequency and frequency percentage and in the level of inferential statistics correlation (correlation coefficient covariance matrix) method, structural equation modeling, path analysis was used. For This purpose, the software spss and lisrel were used.
5-1 statistical community and sample
In this study statistical community is Refah chain store customers in Tehran. As well as access to all the population is impossible, cluster sampling is used, first 5 regions of Tehran city and one Refah store was selected and then questionnaires was distributed among 384 accessible customers of the Refah chain store that the number of samples was determined through an Unlimited Cochrane formula.
5-2 questionnaire
Table 1: Aspects of research
b. General questions: these questions are added to the questionnaire by the researcher. In, general questions general demographic information about the respondents is collected .This section consists of 4 questions.
6-analysis of data
6-1 describing demographic characteristics of the sample
In terms of gender, the results show that most of respondents are men and the number of women respondents are smaller than men. So that in this study, 41.9 percent of the respondents were women and 1.58 percent were men. In terms of age, the results show that most respondents between 40 and 60 years of age, so that in this study, 13.3 percent of respondents under 20 years, 34.9 percent was 20 to 40, 3/39 percent 40 to 60 years and 12.5% more than 60 years old. In terms of education, studies show that the majority of respondents have an education level experts. So that in this study, 3.20 percent of respondents are diploma or under diploma, 5.24percent of associate's, 8.37% bachelor's and 4.17% were MS and higher.
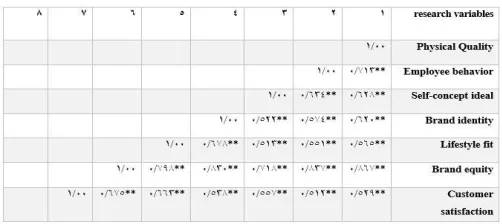
6-2 The correlation coefficient between the research variables
The following table shows the matrix of Pearson correlation coefficients between variables. It should be noted here usually the result of such a test in which the relationship between the two variables are examined, If the correlation coefficient between two variables obtained less than 25/0, the relationship between the two variables is weak and If the value of this ratio in the range of 6/0 - 25/0 this relationship is Average and if this value is more than 6/0 it means that there is a strong relationship between the two variables.
Table 2: correlation matrix between the research variables
According to the results of the Pearson correlation coefficient, it can be said that there is a significant relationship percent between all the variables.
6.3 structural equations modeling
To investigate the causal relations between the variables consistently Various efforts have been done in recent decades. One of the methods to do confirmatory factor analysis, is structural equation or the multivariate analysis with latent variables. Structural equation modeling is a very general and powerful analysis technique from multivariate regression family, and More specifically it is extended general linear model which allows researchers to examine a set of regression equations simultaneously. Structural equation modeling is a comprehensive statistical approach to test hypotheses about the relationship between the observed variables and latent variables, which sometimes called covariance structure analysis, causal modeling and sometimes also called LISREL.
Figure 2structural equation modeling of the research conceptual model (standard estimate)
Figure 3: structural equation modeling of the conceptual model (coefficients significance)
7- The results of hypotheses
In order to analyze research data , different analyzes were used. In the first stage data normality were tested using the Kolmogorov - Smirnov, and the results show the normality of the data.
7-1 test results of the main assumptions
7-1-1 first hypothesis test result: brand equity has a significant impact on customer satisfaction.
A) Using Pearson test, the correlation coefficient between these two variables is the 0.675, which represents the impact of brand equity on Refah stores customer satisfaction.
B) Based on structural equation and considering the path coefficient 0.75 and t-statistic 11.42, it can be said that: Brand equity at confidence level 99 percent has a positive and significant impact on customer satisfaction, so the first main hypothesis of the study is significant and confirmed. The results of these studies are consistent with Boyle and Martinez (2013); Konecnik & Gartner(2007).
7-1-2 second hypothesis test result: brand equity has a significant impact on brand loyalty.
A) Using Pearson test,the correlation coefficient between these two variables is the 0.613, which represents the impact of brand equity on Refah stores customers brand loyalty.
B) Considering the path coefficient 0.37 and t-statistic 5.00,it can be said that: Brand equity at confidence level 99 percent has a positive and significant impact on brand loyalty, so the second main hypothesis of the study is significant and confirmed. The results of these studies is consistent with Boyle and Martinez (2013); - Kayaman & Arasli 2007.
7-1-3 Third hypothesis test results: customer satisfaction has a significant impact on brand loyalty. A) Using Pearson test,the correlation coefficient between these two variables is the 0.617, which represents the impact of customer satisfaction on Refah stores customers brand loyalty.
B) Considering the path coefficient 0.46 and t-statistic 6.04,it can be said that: customer satisfaction at confidence level 99 percent has a positive and significant impact on brand loyalty, so the third main hypothesis of the study is significant and confirmed. The results of this study are consistent with Boyle and Martinez (2013); - Kayaman & Arasli. Also Multiple coefficient of determination (R 2) is equal to 0.35. This factor investigates the ability to predict the dependent variable by the independent variable.According to this, the variables brad equity and customer satisfaction altogether have been able to predict 35 percent of brand loyalty.
7-2 Subsidiary hypothesis test results
7.2.1- first hypothesis test result: physical quality has a significant impact on customer satisfaction.
A) Using Pearson test,the correlation coefficient between these two variables is the 0.529, which represents the positive impact of physical quality of Refah stores on customer satisfaction.
B) considering the path coefficient 0.21 and t-statistic 3.83,it can be said that: physical quality at confidence level 99 percent has a positive and significant impact on customer satisfaction, so the first main hypothesis of the study is significant and confirmed. The results of these studies is consistent with Ikinchi 2001,Madanque 2004,and Nim et al.2011.
7-2-2 Second hypothesis test result: employee behavior has a significant impact on customer satisfaction. A) Using Pearson test,the correlation coefficient between these two variables is the 0.512, which represents the direct and positive impact of employee behavior of Refah stores on customer satisfaction.
B) Considering the path coefficient 0.63 and t-statistic 8.36,it can be said that: employee behavior at confidence level 99 percent has a positive and significant impact on customer satisfaction, so the second sub hypothesis of the study is significant and confirmed. The results of these studies are consistent with Sirzhy (2000), Beck (2005),and Nim et al.2011.
7-2-3 Third hypothesis test result: Self-concept ideal has a significant impact on customer satisfaction. A) Using Pearson test,the correlation coefficient between these two variables is the 0.557, which represents the direct and positive impact between Self-concept ideal and customer satisfaction.
B) Considering the path coefficient 0.26 and t-statistic 3.60,it can be said that: Self-concept ideal at confidence level 99 percent has a positive and significant impact on customer satisfaction, so the third subsidiary hypothesis of the study is significant and confirmed. The results of these studies are consistent with Mill and Ashferth,and Nim et al.2011.
7-2-4 Fourth hypothesis test result: brand identity has a significant impact on customer satisfaction.
A) Using Pearson test,the correlation coefficient between these two variables is the 0.538, which represents the direct and positive impact between brand identity and customer satisfaction.
7-2-5 Fifth hypothesis test result: lifestyle fit has a significant impact on customer satisfaction.
A) Using Pearson test,the correlation coefficient between these two variables is the 0.663, which represents the direct and positive impact between lifestyle fit and customer satisfaction.
B) Considering the path coefficient 0.43and t-statistic 6.63,it can be said that: lifestyle fit at confidence level 99 percent has a positive and significant impact on customer satisfaction, so the fourth subsidiary hypothesis of the study is significant and confirmed. The results of these studies are consistent with Dell Rio et al.and Johnson et al (2001); Vazgouz (2002) and Nim et al. (2011). Also Multiple coefficient of determination (R 2) is equal to 0.66. This factor investigates the ability to predict the dependent variable by the independent variable. According to this, the variable physical quality,employee behavior,Self-concept ideal,brand identity and lifestyle fit altogether have been able to predict 66 percent of customer satisfaction.
8- Discussion of results
The present study, which was conducted in Tehran Refah stores reflects the impact of brand equity on customer satisfaction and loyalty. In general, it was found that customer satisfaction and loyalty of the Refah chain store is being affected by brand equity. In this study it was shown that the physical quality, employee behavior, brand awareness, self-concept ideal fit , lifestyle and brand identity are the key factors determining the brand equity from the customer's perspective in Refah stores, That the first three variables measured the functional aspects and three second variables measured the symbolic equity of the brand. Based on the findings, people want to use the famous brands of services, not only because of the functional values, but also because of their symbolic values , And satisfaction of the hotel's brand dependent on both functional (décor attraction, competence of staff) and symbolic (the fun, excitement, etc.)dimensions; While in most cases of satisfaction only functional aspects are considered; Based on research findings, we can conclude that each 5 dimension assumed for the brand equity from a consumer perspective had a significant and positive impact on customer satisfaction and brand loyalty, and on the other hand,influence on the satisfaction of the relationship between the brand equity and brand loyalty and also it was shown that Among dimensions of the brand equity, the behavior of store employees has largest path coefficient value and its effect on the customer satisfaction and brand loyalty of Refah store is greater. When Refah stores customers understand that the stores in which they are shopping, has a famous brand ,they will be more loyal. If the store brand equity for customers more, they are so motivated to repurchase their needed products again from Refah store and therefore they are less willing to go to the competitor and similar store. Brand equity is one of the most sensitive and the most key elements of the store. In fact, trade names are so important in consumer purchase decisions that will be considered as the underlying asset of the store. Right investment, increase the value. Strong brand, at least telling to the consumers what they can expect from the products and services. Brands differ in terms of strength and value in the market. On one side
there are brands that customers are not familiar with it at all and on the other side there are brands that customers know them, but the store can create awareness with more advertising.Then there are brands that have a high degree of acceptance and this high degree is determined when the customer haven’t any resistance to buying from the store.
9- research proposals
- Considering the key role of the brand equity of Refah stores on customer satisfaction, it is suggested that in the composition of investment ,a unique position considered to promote and increase brand awareness. - Increase employees' knowledge to track and resolve
customer problems and also continue research to determine their perceived quality in the course of reduce company perceived quality distance and perceived quality of the Refah store services.
- Stores to increase brand equity and its trademark, may first need to make customers loyal. Since most of the store's customers are seeking higher profits from their purchase more discount can be a appropriate way for making loyal customers to the brand.
- Refah store employee training to provide services in accordance with the functional properties described in brand identity
- Unification of workers clothing taking into account the characteristics of the brand identity
- Employee training to explain the short and comprehensive characteristics of customer service - It is recommended to hire employees who have high
emotional and social intelligence, and educational psychology specialists can be hired to select the proper people.
- Managers must customize their services to more adaptation with ideal self-concept of store customers. For example, store layout can be changed according to customer demand to be closer to their ideal self-concept. This factor leads to more satisfaction and a memorable buying experience from the store.
- managers to understand the needs and interests of customers and develop appropriate services to increase the brand equity must be studying the lifestyle of actual and potential customers continuously and equipped their stores according to their customers' specific lifestyle and also must apply special facilities; because customers differ according to the store level.
Refrence
[1]. Aaker, D.A. (1991), Managing brand equity: Capitalizing on the Value of a Brand Name, The Free Press, New York, NY.
[2]. Aaker, David A., & Joachimsthaler, Erich. (2000). Brand Leadership: The Next Level of the Brand Revolution: Free Press
.
[4]. Baloglu, S, (2002) "Dimensions of customer loyalty: separating friends from well wishers", Cornell Hotel & Restaurant Administration Quarterly, Vol.43, pp.47-59
[5]. Baumgarth, Carsten, & Schmidt, Marco. (2010). How strong is the business-to-business brand in the workforce? An empirically-tested model of internal brand equity in a business-to-business setting. Industrial Marketing Management, 39(3), 1250-1260
.
[6]. Boder, Angel, (2008), “Brand Engagement and Brand Experience At BBVA, TheTransformation of a 150 Years Old Company”, Corporate Reputation Review, Vol.11, Number 4, S.371-381.
[7]. Bornmark, H. Goransson, A. Svensson, C. (2005). "A study to indiciate the importance of brand awareness in brand choice- A cultural perspective". Kristianstand university.
[8]. Chen, Ching-Fu and Myagmarsuren, Odonchimeg(2012). “Brand equity, relationship quality, relationship value, and customer loyalty: Evidence from the telecommunications services”, Total Quality Management and Business Excellence, 22(9), 957-97.
[9]. Faircloth, j. Capella, L. Alford, B. (2001). "The effect ofbrand attitude and brand image on brand equity". Journal of Marketing theory & Practice 9(3). 61-75.
[10]. Fullerton, G. (2003). When does commitment lead to loyalty?. Journal ofService Research, 5(4), 333-344.
[11]. Hartman,K .Spiro.R .(2005).”Recapturing store image in consumer-Based store equity: A construct conceptualization.Journal of Business Research 58.1112-1120
[12]. Janghyeon Nam, Yuksel Ekinci, Georgina Whyatt (2011). BRAND EQUITY, BRAND LOYALTY AND CONSUMER SATISFACTION. Annals of Tourism Research, Vol. 38, No. 3, pp. 1009–1030, 2011.
[13]. Jeffrey E. LewinT(2009).Business customers' satisfaction: hat happens when suppliers downsize?- industrial marketing management.
[14]. Keller K.L. (2008) Strategic Brand Management - Building, Measuring and Managing Brand Equity, Upper Saddle River, NJ: Prentice Hall
[15]. Keller, Kevin L. (1998), "Strategic Brand Management: Building, Measuring and Managing Brand Equity", Prentice Hall, Upper Saddle River, NJ.
[16]. Kimpakorn, Narumon, & Tocquer, Gerard. (2009). Employees' commitment to brands in the service
sector: Luxury hotel chains in Thailand. Journal of Brand Management, 16(8), 532-544
.
[17]. King, Ceridwyn, & Grace, Debra. (2010). Building and measuring employee-based brand equity. European Journal of Marketing, 44(7/8), 938-971
.
[18]. Kressmann, Frank M. Joseph Sirgy, AndersanHermann, Frank Huber, Stephanie Huber, Dong-Jin Lee, (2006) “Direct and indirect effects of self-image congruence on brand loyalty”, Journal of Business Research, Vol.59, pp.955-964
[19]. Lai,F. Griffin, M. Babin,B .(2009).”How quality,value,image and satisfaction create loyalty at a Chinese telecom”.Journal of business research 62.980-985.
[20]. Mahdi Bahrami, Mazaher Ghorbani, Mohammad Arabzad(2012)” Information Technology (IT) as An Improvement Tool For Customer Rlationship Management (CRM)”
[21]. Meller J.J., Hansan T., (2006) "An Empirical examination of brand loyalty" Journal of Product & Brand Management, Vol.15, No.7, pp.442-449
.
[22]. Pappu, R., Quester, P.G., Cooksey, R.W. (2005). Consumer-based brand equity: improving the measurement, empirical evidence. The Journal of Product and Brand Management, 14(3): 143–54.
[23]. Punjaisri, Khanyapuss, Wilson, Alan, & Evanschitzky, Heiner. (2009). Exploring the Influences of Internal Branding on Employees' Brand Promise Delivery: Implications for Strengthening Customer-Brand Relationships. Journal ofRelationship Marketing, 7(4), 407-424
.
[24]. Santos-Vijande, María Leticia, del Río-Lanza, Ana Belén, Suárez-Álvarez, Leticia, & Díaz-Martín, Ana María. (2013). The brand management system and service firm competitiveness. Journal of Business Research, 66(2). 148-157.
[25]. Sven Kuenzel and Ewa Krolikowska.(2008). Psychological bonds and their impact on behavioral loyalty in auditor-clientrelationships.
[26]. Yasin. M. N & M. N. Noor & O. Mohamad2007): Does image of country origin matter to brand equity. J of product and brand management 16.1-