1a
volavy@fme.vutbr.cz
Prediction of air temperature in the aircraft cabin under different
operational conditions
J. Volavý1a, J. Fišer1 and I. Nöske2
1Faculty of Mechanical Engineering, Brno University of Technology, Technicka 2, 61669 Brno, Czech Republic 2
Frauhofer Institute for Building Physics, Fraunhofer str. 10, 83626 Valley, Germany
Abstract. This paper deals with the prediction of the air temperature in the aircraft cabin by means of Computational Fluid Dynamics. The simulations are performed on the CFD model which is based on geometry and cabin interior arrangement of the Flight Test Facility (FTF) located at Fraunhofer IBP, Germany. The experimental test flights under three different cabin temperatures were done in FTF and the various data were gathered during these flights. Air temperature in the cabin was measured on probes located near feet, torso and head of each passenger and also surface temperature and air temperature distributed from inlets were measured. The data were firstly analysed in order to obtain boundary conditions for cabin surfaces and inlets. Then the results of air temperature from the simulations were compared with measured data. The suitability and accuracy of the CFD approach for temperature prediction is discussed.
1 Introduction
Nowadays computer aid modelling plays an important role in the research and development. Main advantage of the computer modelling is the fact that the investigation of the system can be performed without real physical representation of the system. For this fact computational simulations allows investigating of the behaviour of these systems under different operational conditions and the various parametric studies can be done in order to observe the effect of system modifications. On the other hand the quality of results of computer modelling is strongly dependant on accuracy and limits of used method and mathematical models that describes the system. Therefore the prediction from simulations must be validated with results from experiments to see that the selected models and methods are suitable for given problem [1]. In this work we focused on the prediction of the air temperature in the aircraft cabin by means of Computational Fluid Dynamics (CFD) [2]. This kind of simulations is useful for design of air conditioning systems and air temperature field is one of most important parameter which has impact on the passenger’s thermal comfort.
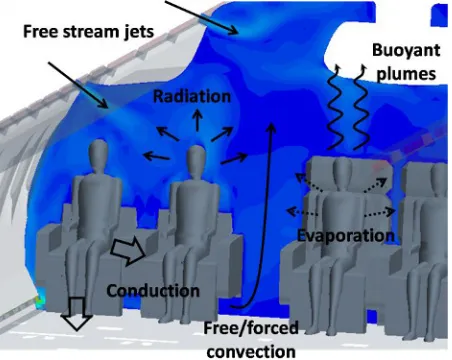
Cabin flows are complex in nature due to the diversity of physical phenomena involved [3], as illustrated in Figure 1. There are free stream jets or wall-bounded jets that form at the inlets of the air into the cabin. Complexity is increased by the presence of people acting as a source of heat and humidity. All three mechanism of heat transfer are involved. Conduction, convection and
radiation must be correctly interpreted in the model in order to obtain the accurate prediction of the heat flux balance on the passenger’s body surface. The flow around passengers is a combination of forced and free convection where each passenger generates a buoyant plume. The radiation plays also an important role because the passengers are enclosed in the relatively small space with different surface temperature than the surface of human body. For simulation purposes, a careful selection of models and assumptions is therefore fundamental to achieve a practical solution with reasonable accuracy and suitable computational time of simulation solution.
Fig. 1. Overview of physical phenomena in aircraft cabin
This is an Open Access article distributed under the terms of the Creative Commons Attribution License 2 0 , which . permits unrestricted use, distributi
2 Test cabin
The Flight Test Facility is located at the Fraunhofer Institute for Building Physics. It consists of a large low-pressure chamber containing the front section of an aircraft (Airbus A310, approx. 15.5 m long). The experimental test flights were done in this facility with different temperature conditions. The environment in the cabin was consequently simulated by means of CFD. During the test flights the data were collected for later comparison and validation of the CFD simulations. The layout of the cabin is depicted in the figure 2. In the cabin there are two first class seats. These seats are located in front of the cabin. Behind them are four rows of business class seats with two aisles between them. Seats 6F (near window) and 6G (aisle) and also 7F (window) and 7G (aisle) are highlighted in the figure. The probes placed near these seats are used later in this work for comparison of simulations and experiments.
Fig. 2. Layout of the Flying Test Facility
Figure 3 shows the original test cabin. During test flights the seats were occupied by 20 subjects and by 7 dummies. The dummies produced the equivalent heat to a passenger (approximately 75W). There are 27 manikins in total included in the simulations and only one type of geometry is used for representation of real people and dummies.
Fig. 3. The interior of Flight Test Facility
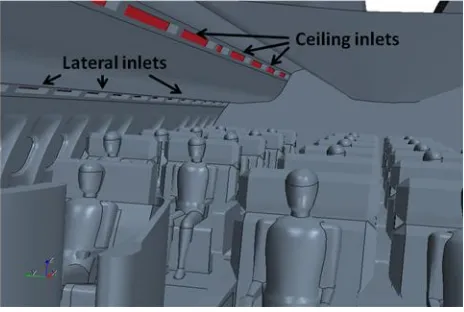
There are two main air sources in the cabin – the ceiling and lateral inlets. The ceiling inlets are located over the hatracks. The lateral inlets are above the windows. The detailed view on inlets location is given in figure 4.
The outlets of the air are situated along the cabin in the bottom part of lining panel near the cabin floor. The temperature of the outlet air was measured and this value was used as one parameter for validation of the accuracy of the temperature prediction.
Fig. 4. Location of ceiling and lateral inlets in the model
Some seats were equipped with personalised ventilation systems. The detailed description of those systems is beyond the scope of this article, only the ventilation system of the business class seats with personal ventilation (7F/7G) is introduced here, they are referred to as PV seats in the following.
Fig. 5. Personalized ventilation system of business class seat
equipped with a seat heating and ventilation system which is integrated in the backrest and seat cushion.
2.1 Computational mesh
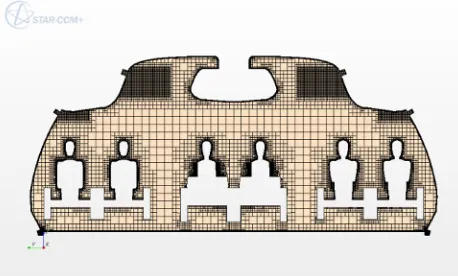
The computational mesh for the CFD simulations was created in the program StarCCM+. The cut-cell approach was used for generation of the mesh. The mesh consists mostly of hexahedral cells. Polyhedral cells or wedges are only near the walls and manikins. The total number of cells is approximately 12.5 millions. The maximum size of the interior cells is 0.1 m. A much finer surface mesh and volume mesh is required to capture small geometric features like inlets as their correct captured shape and further refinement is necessary for prediction of correct discharge flow from them. Consequently the amount of volume cells spent for the inlet & outlet refinement volumes can match or even exceed the cell count of the main cabin. Figure 6 gives an impression of the extent of the inlet & outlet refinement as well as clear picture of the volume mesh.
Fig. 6. Cross-section of the computational mesh
The fine near wall resolution is crucial for accurate prediction of the heat transfer from the cabin walls and virtual manikins. The correct representation of the heat flux from surfaces plays a significant role in the prediction of the temperature distribution in the cabin. Therefore the prismatic layer is present at the walls. The thickness of this layer is 1.5 cm. The detail of the computational mesh near the virtual manikin is displayed in the figure 7.
3 Operational and boundary conditions
The test flights were carried out under different temperature conditions. In this paper they are referredas low, middle and high based on the desired cabin air temperature (19.5; 23.5 and 27.5 °C). The desired temperature was obtained by various settings of the temperature of air coming from ceiling and lateral inlets.
Fig. 7. Detail of mesh near the virtual manikins
The simulations were performed as steady case that the small oscillation of inlet air temperature was not considered and therefore the temperature was averaged over the time in the processing of test data to the boundary data. The air temperature at inlets varies along the length of cabin as well. Because of this fact the inlets (both lateral and ceiling) were divided into four parts on each side. The averaged temperatures (both in time and space) of the air coming from the ceiling and lateral inlets used in the simulations are enumerated in table 1. The inlet velocity at ceiling inlets was set to 0.3 m/s and to 0.9 m/s at lateral inlets.
Table 1. Average temperature of the inlet air in °C
Low Middle High
Ceiling inlets 20.1 28.2 38.1
Lateral inlets 15.1 17.9 21.4
The temperature of the wall surface was measured during experiments. Again, this temperature showed a small variance in time and the averaged value was prescribed at the wall surface. These values are shown in the table 2 for all operational conditions.
Table 2. Average temperature of the surfaces in °C
Low Middle High
Walls 11.4 15.6 18.1
Floor 16.9 17.4 21.3
Ceiling 20.3 23.8 28.5
4 CFD methodology and Results
78 500 Pa. The results of the simulations are presented in the following part. Only selected important results are analysed within this paper.
4.1 Low temperature conditions
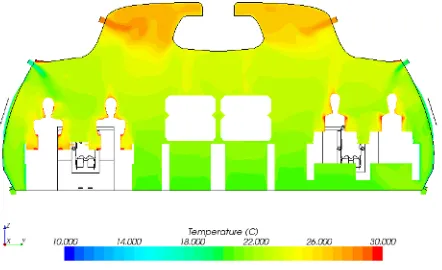
The temperature distribution over the cross-section plane through the PV seats (on the left) is shown in figure 8 for low temperature conditions. The different behaviour of the air coming from the lateral inlets on the different sides of the cabin is worth mentioning. On the right side, the air from inlet is colder then the surrounding air and falls down attached to the side wall. On the left side the situation is completely different. The buoyant plume forming around passenger is enhanced with the seat heating on the PV seat. This plume lifts up the air coming from lateral inlet and the air jet remains attached to the hatrack. The absence of the temperature stratification in the cabin can be also observed in the figure.
Fig. 8. Temperature distribution for low cabin Temperature conditions
The temperature in the plane parallel to the floor in the height of the passenger’s heads is shown in figure 9. The temperature distribution is almost uniform in this plane.
Fig. 9. Temperature distribution in the head level for low cabin temperature conditions
4.2 Middle temperature conditions
The temperature distribution over the cross-section plane through the PV seats is shown in the figure 10 for the
middle temperature conditions. The various physical phenomena which were mentioned in the introduction can be easily distinguished in this figure. The air jets from the inlet can be identified. It can be seen that the air from the lateral inlets is directly supplied to the passengers. Also the buoyant plumes are forming around the passengers. The temperature stratification is also noticeable. It can be noticed that due the buoyant effect the hot air coming from the ceiling inlets remains in the gap between hatracks and does not directly reach the passengers.
Fig. 10. Temperature distribution for middle cabin temperature conditions
The temperature in the plane parallel to the floor in the height of the passenger’s heads is depicted in figure 11. The temperature distribution is almost uniform in the central part of the cabin. Temperature is lower only in the near wall region because of heat losses caused by colder walls.
Fig. 11. Temperature distribution in the head level for middle cabin temperature conditions
4.3 High temperature conditions
lateral inlets causes that the air falls down sooner and does not reach the passenger sitting near the aisle.
Fig. 12. Temperature distribution in the head level for high cabin temperature conditions
The temperature in the plane parallel to the floor in the height of the passenger’s heads is shown in figure 13. The temperature distribution is almost uniform in this plane.
4.4 Comparison with experiment
The temperature distribution plots in several planes were introduced in the previous subsections. The comparison of the results of simulations and experimental data is presented in this subsection.
Fig. 13. Temperature distribution in the head level for high cabin temperature conditions
Temperature of the air at the outlets was one of the main parameters for validation of the CFD results. The absolute error in prediction of the outlet air is depicted in figure 14. The outlets were divided into four parts on both sides (from 1 – back of the cabin to 4 - front). In almost all cases the outlet temperature is predicted with reasonable accuracy. Only for the left outlet at front (Outlet_left_4) the difference between experiment and simulations is higher under cold condition. Because of the small differences of simulation and experimental data of the outlet air it can be concluded that the heat transfer in the cabin is predicted correctly.
0,00 1,00 2,00 3,00
A
b
so
lu
te
e
rr
o
r
[C]
location
Low Middle High
Fig. 14. Absolute error of outlet air temperature prediction
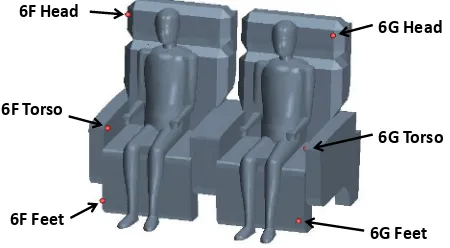
In the figure 15 are depicted the locations of the probes in which the temperature was measured near passengers sitting on the seats 6F (window) and 6G (aisle). The temperature from the simulations was sampled in the same locations. The temperature was measured near all seats in similar location, results are presented only for seats 6F/6G and PV seats 7F/7G. The seats 6F/6G were chosen for comparison because these seats were not equipped by personalised ventilation system, therefore temperature is affected only by overall cabin environmental conditions and does not depend on the various settings of the elements of personalised ventilation system. The choice of PV seats 7F/7G for comparison was made for completely opposite reason. The personalised ventilation system of these seats consists of many elements (outlets of air in the armrest, front air nozzle, air outlet in backrest of front seat, seat heating/ventilation) and the capability of CFD for simulation of such system was investigated.
6F Head
6F Torso
6F Feet
6G Head
6G Torso
6G Feet
Fig. 15. Location of the temperature probes
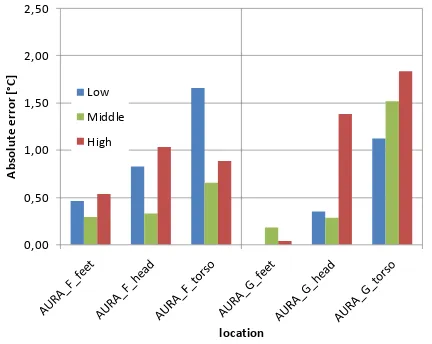
In the figure 16 is shown the absolute error in the prediction of the temperature on the probes near seats 6F/6G. In case of low and middle temperature operational conditions there is good agreement of experiment and simulation. For the high temperature conditions the difference on probes near the aisle seat are about 2°C.
0,00 0,50 1,00 1,50 2,00 2,50
6F_feet 6F_head 6F_torso 6G_feet 6G_head 6G_torso
A b so lu te e rr o r [° C] location Low Middle High
Fig. 16. Absolute error in temperature prediction of probes near seats 6F and 6G
The difference between the experiment and simulation results of probes near PV seats is shown in the figure 17. The difference is in almost all cases lower than 1.5°C and does not exceed 2 °C. Based on these facts it could be stated that CFD method is capable of accurate simulation personalised ventilation system with many elements. 0,00 0,50 1,00 1,50 2,00 2,50 A b so lu te e rr o r [° C] location Low Middle High
Fig. 17. Absolute error in temperature prediction of probes near PV seats 7F and 7G
The average absolute error in temperature prediction for different operational conditions is presented in table 3. The values are obtained by averaging the absolute errors over all seat probes. The accuracy of the CFD simulations is very good for low and middle temperature operational conditions. Even for high temperature conditions it could be said that the CFD simulation is sufficiently precise.
Table 3. Average absolute error in °C for various operational conditions
Low Middle High
Average abs.
error 0.87 0.90 1.53
5 Conclusions
The temperature of the air in the experimental aircraft cabin Flight Test Facility was measured during test flight. Then the cabin environment was simulated by means of CFD. The main goal of these simulations was to determine if the CFD is capable of accurate prediction of air temperature and its distribution in the cabin.
Before the simulations it was necessary to process all experimental results. Some of these results were used as boundary conditions (inlet air temperature, surface temperature), other were used later for validation of CFD analysis (outlet air temperature, seat probes temperature). The instability of some data in time occurred during preparation of the data for CFD simulation. Because of the nature of simulations which were performed as a steady case, it was necessary to average the data over specified interval.
Taking into account uncertainty of measurement of temperatures which were used as data for boundary conditions (surface temperatures, temperatures of supply air) and differences in waste heat production of real human body and used manikins, we can conclude that temperature of air was predicted with sufficient accuracy and the results from CFD are valid.
The influence of the sitting persons on the seat temperature probes must be considered also in judging the accuracy of the CFD simulation. There were identified cases when some part of the body was near or touching the temperature probe and therefore this value can significantly influence the accuracy of CFD simulations.
Acknowledgement
Authors gratefully acknowledge the support of European Commission in the frame of project 7th Seventh Framework Programme iSPACE 234340 (innovative Systems for Personalised Aircraft Cabin Environment). The support from the projects FSI-S-11-6 and CZ.1.07/2.3.00/30.0005 is acknowledged as well.
References
1. P. J. Roache, Verification and Validation in Computational Science and Engineering, Hermosa publishing, Albuquerque, USA, ISBN 0-913478-08-3 (1998)
2. H. K.Versteeg and W. Malawasekera, Computational Fluid Mechanics: The Finite Volume Method, Pearson Education Limited, London, UK, ISBN 978-0-13-127498-3 (2007)