Flow control in axial fan inlet guide vanes by synthetic jets
V. Cyrus1,a, Z. Trávníček2, P. Wurst1DQG J. Kordík2
1AHT Energetika s.r.o., 190 11 Prague 9 – Běchovice, Podnikatelská 550, Czech Republic 2Institute of Thermomechanics AS CR, v.v.i., 182 00 Prague 8, Dolejškova 5, Czech Republic
Abstract.Tested high pressure axial flow fan with hub/tip ratio of 0.70 and external diameter of 600 mm consisted of inlet guide vanes (IGV), rotor and stator blade rows. Fan peripheral velocity was 47 m/s. Air volume flow rate was changed by turning of rear part of the inlet guide vanes. At turning of 20 deg the flow was separated on the IGV profiles. The synthetic jets were introduced through radial holes in machine casing in the location before flow separation origin. Synthetic jet actuator was designed with the use of a speaker by UT AVCR. Its membrane had diameter of 63 mm. Excitation frequency was chosen in the range of 500 Hz – 700 Hz. Synthetic jets favourably influenced separated flow on the vane profiles in the distance of (5 – 12) mm from the casing surface. The reduction of flow separation area caused in the region near the casing the decrease of the profile loss coefficient approximately by 20%.
1 Introduction
There are many applications of the active flow control, aiming to the delay/advance of transition, suppression/enhancement of turbulence, prevention/provocation of flow separation, and augmentation of heat transfer local/mean rate. The control can focus on the drag reduction, lift enhancement, mixing augmentation and flow-induced noise suppression. All these aims concern to both in wall-bounded and free-shear flows. There are many ways of fluid flow control relevant to these aims. A very promising strategy consists in an implementation of flow oscillation.
A synthetic jet (SJ) (or zero-net-mass-flux jet) is a fluid flow generated by pushing and pulling of the fluid from a cavity through an orifice or a nozzle. The sealed cavity is typically bounded at one end by a rigid wall with an emitting orifice (or nozzle) and at the other end by an actuating surface. The SJ is generated (synthesized) from the individual vortical structures, which are created at each “fluid puff” emitted from the orifice. The flow in the orifice reverses its sign after each stroke, and the time-mean mass flux in the nozzle is zero –therefore, the other commonly used term for SJ is the zero-net-mass-flux jet. Despite various flow control methods based on introducing flow and pressure oscillation were investigated in the past, the phenomenon of SJ became mainly popular owing to an outstanding and highly cited
a cyrus.aht@iol.cz
publications introducing the term “synthetic jet”: James et al. [1], Smith and Glezer [2].
Possibilities of SJs for an active flow control in turbomachinery were investigated, and a few relating publications focusing on low and high speed axial compressors have recently appeared, e.g. Kefalakis and Papailliou [3], Zheng et al. [4]. The actuation can efficiently enhance momentum transport in the unstable boundary layer. Various locations of the actuation were investigated – note a very effective incorporation of the actuators into the blades with the flush-mounted operating orifices, Culley et al., [5]. However, the penalty of this variant is an essential complication of the construction. Obviously, more feasible is to design actuation from channel sidewalls, as was investigated with the two-dimensional blade cascades, e.g. by Matějka et al. [6] and, more recently, by Zander et al. [7]. This experimental investigation focused on a large scale, highly loaded compressor cascade, equipped with 30 SJ actuators (!) mounted to the sidewalls and on the blade suction side surface. They concluded a total pressure loss reductions of nearly 10% resulting from the SJ actuation. Zheng et al. [4] investigated flow control of annular compressor cascade in a low-speed annular cascade wind tunnel. Their actuation was located from the casing between guide vanes and compressor stator vanes.
According the previous experience, flow separation of the highly loaded axial fan occurs on inlet guide vanes (IGVs) at stagger angle values higher than 10o and on
rotor and stator blades at off-design working conditions –
see Cyrus [14] and Cyrus et al. [15]. Our investigations, described in this paper, were concentrated on flow separation behaviour on axial flow fan inlet guide vanes.
Fig. 1. Laboratory SJ actuator. The unsteady separation flow is predetermined by
geometry and the boundary conditions. Following these facts, flow separation can be controlled at its origin. Therefore, a very interesting location of the control SJs seems to be a vicinity of the IGV. It can be supposed that the unstable/separated flow in bladed channels can be favorably influenced there. To the best of our knowledge, introducing of flow oscillation at the guide vanes, with the aim to enhance the machine efficiency and working range, was not analyzed in available literature until now.
2. Experimental setup
2.1 Axial flow fan stage with IGV
Axial flow stage (rotor and stator blade rows) with inlet guide vanes (figure 2) was used for tests of active flow control. The stage blading, denoted by the abbreviation of AV6, was designed and experimentally verified by AHT Energetika – Cyrus et al. [15]. The outer and inner diameters of stage were constant. The hub/tip ratio is 0.7 and external diameter is 600 mm. The stage cascades have extremely high aerodynamic loading. The profiles of rotor and stator airfoils are NACA 65 – series. Design flow coefficient is φ = 0.60.
The inlet guide vanes (IGV) are formed from 17 uncambered C4 airfoils with chord length of 90 mm. The IGV stagger angle variation was carried out by means of the movement of rear part of vane profile (figure 2). It enables the volume flow rate change [14]. Tests were performed at revolutions: n = 1500 1/min.
At the entrance of the test rig there is an inlet measuring nozzle to indicate the mass flow rate. At the outlet there is a radial diffuser whose moveable rear wall makes it possible to change the aerodynamic resistance of the test rig. The rig is driven by a DC motor with swinging stator to measure torque by weighing[16].
2.2 Synthetic jet actuators and experimental methods
Following the previous experience with SJ actuators (Trávníček et al. [8–12]), the full scale axial fan was equipped by electrodynamically driven SJ actuators, located at the IGVs. Namely three SJ actuators were built in the fan casing near the IGVs at the expected separation points.
To develop efficient geometry and choose appropriate driven parameters, a laboratory SJ actuator was developed. Figure 1 shows the schematic view of this laboratory SJ actuator. The working fluid is air. The chamber with two emitting orifices is made out of Perspex. The orifices inlets from the cavity are carefully rounded to prevent flow separation during extrusion stroke of the actuation there. The actuator is driven
electrodynamically by a diaphragm from the loudspeaker Monacor SP-45/4. The diameters of the diaphragm and emitting orifices are DD = 62.8 mm and D = 3.5 mm,
respectively. In the present study, the input electrical power of the sinusoidal current was kept constant 15.0 W, at each of the tested frequencies in the range of 60 Hz to 1400Hz. Besides, an actuation at 20 W was tested out of the ordinary tests.
Hot-wire anemometry is used for velocity measurement in air using a DANTEC anemometer (MiniCTA 55T30) in the constant temperature anemometry (CTA) mode with a single-sensor wire probe (55P16). The sampling frequency is 20 kHz and the number of samples is 65533. For the present experiments, the anemometer is calibrated in the velocity range from 9.4 m/s to 120.1 m/s. The linearization error of the calibration (using a three-degree polynomial) is within 1.2%.
The phase averaging of the velocity during one cycle is carried out using the velocity decomposition u=U +UP+u’, where U is the time-mean velocity, UP is the periodic phase-locked component, and u’ is the fluctuating component. Taking into account the alternating velocity character near the actuator orifice, positive (extrusion) and negative (suction) flow orientations (indistinguishable by the single-wire probe) are obtained by appropriately inverting the velocity sign during the suction stroke. Data processing is done in MATLAB.
Some auxiliary measurements of the time mean velocity have been made using a Pitot tube of 2 mm in diameter.
3. Results
3.1 Laboratory SJ actuator
positive, and where the periodic velocity component is not dominant [2, 10 and 11].
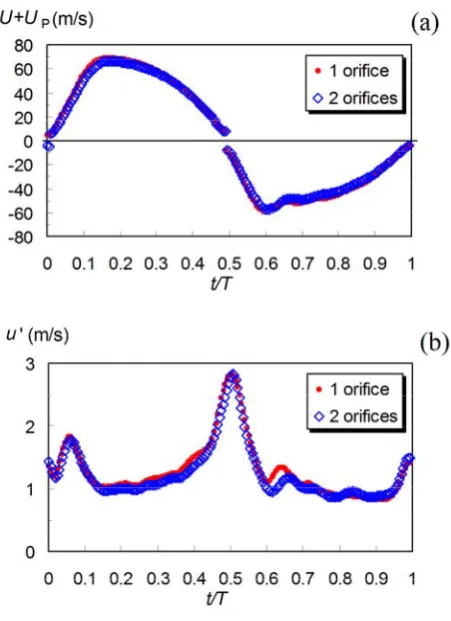
Figure 3 shows the time-mean velocity, which is measured in the range of the actuating frequency from 60 Hz to 1400 Hz. To complete information about the actuator behavior, two measurements are presented, namely measurements with the two actuating orifices and with one of them (in the latter variant, the other orifice was blocked by the metal adhesive tape). Figure 3 shows that the maxima of the velocity are found at 600 Hz for both variants, which are approximately 32 m/s and 38 m/s, respectively. These maxima are relevant to the first resonance of the actuator resulting from the mechanical energy transformation – namely the kinetic energy of the fluid column and the potential energy of the diaphragm are mutually transformed [8]. Finally, the frequency (600 – 700) Hz was chosen as the operating frequency range.
Fig. 2. Test rig, location of SJ actuators
.
The CTA measurements of the orifice velocity on the SJ axis was performed at the chosen operating frequency 600 Hz. Figure 4 shows the phase averaged velocity during the time period T, (T = 1/f): the periodic phase-locked component and the fluctuating component are shown in figure 4 (a and b), respectively.
The time-mean orifice velocity U0, relevant to the
extrusion stroke is defined by integrating the velocity cycle [2, 10, 11]:
0 0
( )
, (1) 0=
∫
ET
U f u t dt
where u0(t) is the instantaneous orifice velocity on the
axis and TE is the duration of the extrusion stroke, which
can be considered TE = T/2 under the present harmonic
Fig. 3. Frequency characteristics of the laboratory SJ actuator.
The results from figure 4 were used and the time-mean orifice velocity U0 was evaluated as 26.0 m/s and
21.6 m/s for the two-orifices and one-orifice variants, respectively. Moreover, an increase of the power from 15 W to 20 W was tested for the two-orifices variant, and an increase of U0 from 21.6 m/s to 22.7 m/s was found
(not plotted here).
Important parameters of the SJ [2, 10 and 11] are the characteristic length scale of SJ – the “extrusion stroke length” L0 = U0T, and the Reynolds number,
ReSJ=U0D/ν . These parameters were evaluated from the
velocity cycle, presented in figure 4. Table 1 summarizes these parameters.
Moreover, Table 1 shows an important parameter of the flow control: the dimensionless frequency (or Strouhal number), defined as F* = fL/Uinlet , where L is
the characteristic length scale of the IGV, namely its movable rear part and Uinlet is the velocity at the inlet of
the axial fan. Considering the design nominal values L = 58 mm and Uinlet = 25 m/s, we can evaluate F* = 1.4, as is
shown in Table 1. Note that this value matches the recommended value by Braunscheidel et al. [13].
Table 1. Parameters of control SJ.
f (Hz) 600
U0 (m/s) 21.6
ReSJ 4800
L0/D 2.36
F* (Hz) 1.4
3.2 Axial flow fan equipped by SJ actuators
Following the results with the laboratory SJ actuator, three full scale (two-orifices) SJ actuators were designed, manufactured and installed on the axial flow fan casing near the IGVs, at the expected separation point (figure 2).
Fig.4. Centreline velocity during one cycle of the laboratory SJ; (a) phase averaged velocity, (b) RMS velocity fluctuation.
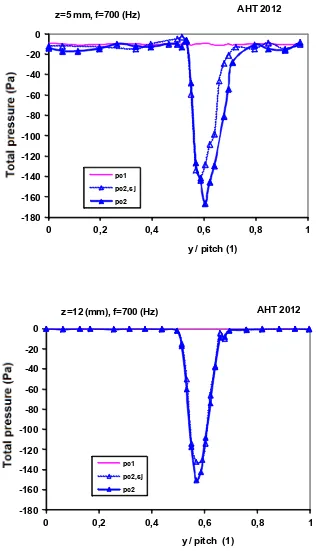
The flow parameters were measured in planes before and behind the IGV by means of 5-hole conical pressure probes with sensor diameter of 2.5 mm at four distances from casing – z = 5, 12, 20 and 30 mm. Measurements were carried out within one IGV pitch at 16 circumferential points at fan working point characterized by flow coefficient value = 0,42. The position of rear part of IGV with stagger angle of 20o is drawn in figure
2. There was no clearance between the casing and inlet guide vane.
SJ actuator (figures 1 and 2) had originally two orifices. During preliminary tests it was found that the most pronounced effect of pulsating flow on separated flow is only with the use of one hole ( notation “a” in figure 2 ) . This is close to the flow separation point. The method for determination of fan working point is described in works [14–15]. Turbulence intensity of fan inlet flow at midspan was determined by hot-wire probe – Tu = ( 1.2 - 1.5) %.
Figure 5 shows the circumferential distributions of total pressures in the IGV inlet and outlet planes: pc1 and
pc2 for two positions from casing – z = 5 and 12 mm. One
4. Conclusion
The flow control in inlet guide vanes of axial flow fan was investigated. The flow was separated on the IGV profiles at stagger angle of 20 degrees. Synthetic jet was introduced in radial hole in turbomachine casing at the location of flow separation beginning. Synthetic jet actuator was designed with the use of speaker designed by UT AVCR. Membrane diameter was 63 mm.
The extent of flow separation was decreased in the area near the casing if the SJ were applied. This favourable effect decreases with the distance from the casing wall. At the distance of 20 mm the effect was not observed.
The reduction of flow separation area caused the decrease of the IGV profile loss coefficient by 20% at the location of 5 mm from the wall.
It is convenient to continue in the research of synthetic jet actuators with higher outlet velocities in order to obtain more significant decrease of flow separation areas on axial flow fan vane profiles.
Acknowledgments
We gratefully acknowledge the support of the Grant Agency AS CR (Project No. IAA 200760801).
References
1. R.D. James, J.W. Jacobs, A. Glezer, Phys. Fluids 8,
(9) 2484–2495 (1996).
2. B.L. Smith, A. Glezer, Phys. Fluids 10, 2281–2297 (1998).
3. M. Kefalakis, K.D. Papailliou, ASME Turbo Expo, Power for Land, Sea and Air, Barcelona, Spain GT2006-90113 (2006).
4. X. Zheng, S. Zhou, Y. Lu , A. Hou, Q. Li, Trans. ASME, J. Turbomachinery 130, 1 – 021018-7 (2008).
5. D.E.Culley, M.M. Bright, P.S. Prahst, A.J. Strazisar, Trans. ASME J. Turbomach. 126, 24–34 (2004). 6. M. Matějka, P. Šafařík, L. Popelka, J. Nožička,
ASME Turbo Expo, GT2008-51109 (2008).
7. V. Zander, M. Hecklau, W. Nitsche, A. Huppertz, M. Swoboda, 9th European Conference on Turbomachinery, Fluid Mechanics and Thermodynamics, Istanbul, March 21-25, 81–93 (2011).
8. Z. Trávníček, A.I. Fedorchenko, A.-B. Wang, Sensors and Actuators A-Physical 120, 232-240 (2005).
9. Z. Trávníček, V. Tesař, A.-B. Wang, Sensors and Actuators A-Physical 125, 50–58 (2005).
10. Z. Trávníček, T. Vít, V. Tesař, Phys. Fluids 18, 081701-1–081701-4 (2006).
11. Z. Trávníček, V. Tesař, J. Kordík, Journal of Visualization 11, 221–229 (2008).
12. Z. Trávníček, L. Němcová, J. Kordík, V. Tesař, V. Kopecký, Int. J. Heat Mass Transfer 55, 1279– 1290 (2012).
13. E.P. Braunscheidel, D.E. Culley, K.B.M.Q. Zaman, Report NASA/TM-2008-215145, AIAA-2008-0602 (2008).
14. V. Cyrus, ASME Turbo Expo, Power for Land, Sea and Air, ASME Paper No. 98-GT-151, Stockholm, June 2–5 (1998).
15. V. Cyrus, J. Polanský, P. Wurst, 7th European
Conference on Turbomachinery Fluid Mechanics and Thermodynamics, Athens, March 5-9, 369–380 (2007).
16. V. Cyrus, 3th European Conference on
-180 -160 -140 -120 -100 -80 -60 -40 -20 0
0 0,2 0,4 0,6 0,8 1
T o ta l p re ss u re (P a)
y / pitch (1)
pc1 pc2,sj pc2
z=5 mm, f=700 (Hz) AHT 2012
-180 -160 -140 -120 -100 -80 -60 -40 -20 0
0 0,2 0,4 0,6 0,8 1
T o ta l p re ss u re ( P a )
y / pitch (1)
pc1
pc2,sj pc2
AHT 2012 z=12 (mm), f=700 (Hz)