International Journal of Innovation and Applied StudieSN 2028-9324 VX No. X Month 20XX, pp. XXX-X© 2
Corresponding Author E-mail:monimani52@gmail.com 767 | Page
International journal of Advanced Biological and Biomedical Research Volume 1, Issue 7, 2013: 767-776
COMPRESSION OF BREAST CANCER IMAGES BY PRINCIPAL COMPONENT ANALYSIS
Monika Saraswat 1, A. K. Wadhwani 2 and Manish Dubey 3
1
Electrical, RGPV/MITS, Gwalior, M.P, India, 2Electrical, RGPV/MITS, Gwalior, M.P, India, 3Electrical, RGPV/MITS, Gwalior, M.P, India
ABSTRACT
The aim of this work, Early detection of the breast cancer and reduce the mortality rate. Breast cancer is the second most lethal cancer for women in the world today. Image compression is fundamental to the efficient and cost-effective use of digital medical imaging technology and applications. The conventional method for measuring quality and noise from the image by SNR and PSNR. Compressed the noise ratio from the cancer image and decomposed the PSNR value. The effective method Principal component analysis currently provides the most promising approach to high-quality image compression. Compressed the noise and improve the quality in the breast cancer image by PCA method.
Key Words: SNR, MSE, PSNR, Mammograms, PCA.
INTRODUCTION
ISSN: 2028-9324 Vol. X No. X, Month 20XX
768 | Page [4].
DATA ACQUISITION
Images of Mammogram are available in the Department of Electrical Engineering, MITS Gwalior. These images are available with the same specification (3000x4500 pixels with 16-bit pixel depth).
PRINCIPAL COMPONENT ANALYSES
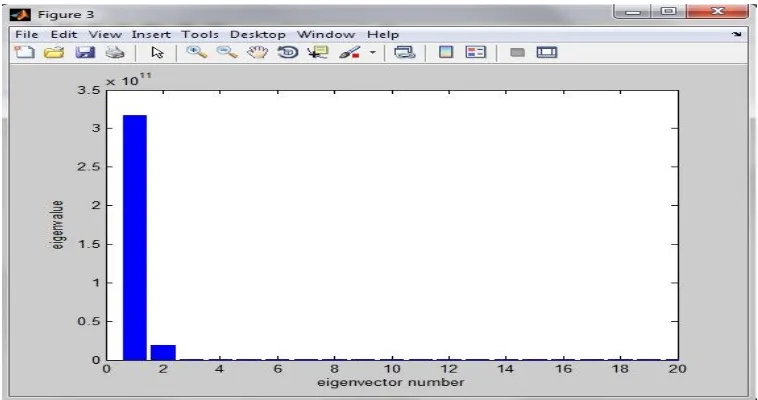
The principle of dimensionality reduction with PCA is the representation of the dataset ‘X’ in terms of eigenvectors ei ∈ RN
of its covariance matrix. The eigenvectors oriented in the direction with the maximum variance of X in RN carry the most relevant information of X. These eigenvectors are called principal components [8]. Assume that n images in a set are originally represented in matrix form as Ui∈
Rr ×c, i = 1,...,n, where r and c are, repetitively, the number of rows and columns of the matrix. In
vectorized representation (matrix-to-vector alignment) each Ui is a N = r × c- dimensional vector ai
computed by sequentially concatenating all of the lines of the matrix Ui. To compute the Principal Components the covariance matrix of U is formed and Eigen values, with the corresponding eigenvectors, are evaluated. The Eigen vectors forms a set of linearly independent vectors, i.e., the base {φ} n i=1 which consist of a new axis system [10].
PCA FOR IMAGE COMPRESSION
Using PCA for image compression also known as the Hotelling, or Karhunen and Leove(KL), transform. We have 10 images, each with N2 pixels, we can form N2 vectors, each with 10 dimensions. Each vector consists of all the intensity values from the same pixel from each picture [7]. This is different from the previous example because before we had a vector for image, and each item in that vector was a different pixel, whereas now we have a vector for each pixel, and each item in the vector is from a different image [11]. Now we perform the PCA on this set of data. We will get 10 eigenvectors because each vector is 10-dimensional. To compress the data, we can then choose to transform the data only using, say 5 of the eigenvectors. This gives us a final data set with only 5 dimensions, which has saved us ¼ of the space. However, when the original data is reproduced, the images have lost some of the information [6]. This compression technique is said to be lossy because the decompressed image is not exactly the same as the original, generally worse [9].
ERROR METRICS
ISSN: XXXX-XXXX Vol. X No. X, Month 20XX
MEAN SQUARE ERROR (MSE)
Mean square error is a criterion for an estimator the choice is the one that minimizes the sum of squared errors due to bias and due to variance. The average of the square of the difference between the desired response and the actual system output. In a loss function, MSE is called squared error loss. It can be estimated in one of many ways to quantify the difference between values implied by an estimate and the true quality being certificated. MSE is a risk function corresponding to the expected value of squared error. The MSE is the second moment of error and thus incorporates both the variance of the estimate and its bias.
MSE= (1/ (M×N)) × ((k(x, y))-(XX(x, y))) ^2 (1)
Where m and n is the image size and k(x, y) is the input image and XX(x, y) is the retrieved image.
PEAK SIGNAL-TO-NOISE RATIO (PSNR)
The PSNR is most commonly used as a measure of quality of reconstruction of lossy compression codecs (e.g., for image compression). The signal in this case is the original data, and the noise is the error introduced by compression. When comparing compression codecs it is used as an approximation to human perception of reconstruction quality, therefore in some cases one reconstruction may appear to be closer to the original than another, even though it has a lower PSNR (a higher PSNR would normally indicate that the reconstruction is of higher quality). One has to be extremely careful with the range of validity of this metric; it is only conclusively valid when it is used to compare results from the same codec (or codec type) and same content [12]. It is the ratio between the maximum possible power of a signal and the power of the corrupting noise, mathematically given in equation 2. Because many signals have a very wide dynamic range, PSNR is usually expressed in terms of the logarithmic decibel scale. The PSNR is most commonly used as a measure of quality of reconstruction in image compression etc. It is most easily defined via the mean squared error (MSE) which for two m×n monochrome images I and K where one of the images is considered noisy.
PSNR=10×log10 ((MAXi^2)/MSE) (2)
Here, MAXi is the maximum possible pixel value of the image. When the pixels are represented using 8 bits per sample, this is 255. For colour images with three RGB values per pixel, the definition of PSNR is the same except the MSE is the sum over all squared value differences divided by image size and by three. Typical values for the PSNR in Lossy image and video compression are between 30 and 50 dB, where higher is better. PSNR is computed by measuring the pixel difference between the original image and compressed image. Values for PSNR range between infinity for identical images, to 0 for images that have no commonality. PSNR decreases as the compression ratio increases for an image.
SIGNAL- TO –NOISE RATIO
Signal-to-noise ratio is defined as the power ratio between a signal (meaningful information) and the background noise (unwanted signal).
ISSN: 2028-9324 Vol. X No. X, Month 20XX
770 | Page points in a system, and within the same system bandwidth. If the signal and the noise are measured across the same impedance, then the SNR can be obtained by calculating the square of the amplitude ratio.
RESULTS AND DISCUSSIONS
ISSN: XXXX-XXXX Vol. X No. X, Month 20XX
Table 1. Calculation of CR, PSNR, MSE, and SNR on the Digitized Mammogram Image
CONCLUSIONS
This paper improves the quality of Breast cancer image by using Principal component analysis method. The image is clearly visible and also the proposed method is compared with other existing methods in terms of their image parameter SNR (signal-to-noise ratio) MSE (Mean Square Error) & PSNR (Peak Signal to Noise Ratio) of each image, but machine vision cannot adapt itself to the color changes. By the use of PCA method improves the quality and compressed the noise ratio in the image. The Cancer Image becomes high enhanced and we easily detect abnormalities in the images. This will help doctor to take or analyze the abnormal signs in the image and they take quickly action, patient have and according to which he/she can take necessary and appropriate treatment steps.
Medica l Images CR (%) RETA INED ENERG Y PSNR value of Decompresse d Image
SNR PSNR
value by PCA method MSE Image 1 69.604 1
99.999 150.3133 15.737
7 70.218 5 0.00618 3 Image 2 52.772 1 99.999 7
96.7563 20.109
8 62.661 2 0.00231 5 Image 3 60.667 1 99.999 2
102.1213 18.645
6 60.119 7 0.06325 7 Image 4 37.412 2 99.999 2
113.3879 16.318
8 80.622 8 5.63E-04 Image 5 58.700 8 99.998 9
101.6903 17.712
9 74.666 1 0.00222 1 Image 6 63.354 8 99.999 3
114.1775 22.044
1 54.670 9 0.22181 4 Image 7 61.909 9 99.998 4
106.943 19.898
3 67.831 1 0.01071 4 Image 8 120.45 61 99.999 6
120.4561 21.288
1 95.697 7 1.75E-05 Image 9 81.792 1
99.999 101.8405 16.801
1
ISSN: 2028-9324 Vol. X No. X, Month 20XX
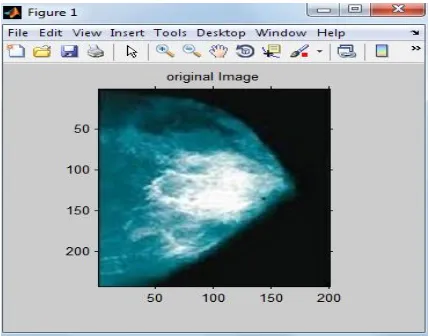
772 | Page Figure 1 Original Mammogram
ISSN: XXXX-XXXX Vol. X No. X, Month 20XX
Figure 3 Salt & Pepper Noise
ISSN: 2028-9324 Vol. X No. X, Month 20XX
774 | Page Figure 5 Plot Intensities of Image
ISSN: XXXX-XXXX Vol. X No. X, Month 20XX
Figure 7 Segmented Abnormal Part in Image
ACKNOWLEDGEMENT
Authors are thankful to UGC NEW DEHI for providing financial assistance to this research paper under UGC major research project. Research grant sanctioned from UGC vide F-NO.37-505/2009(SR).dated 21.12.2009.
REFERENCES
[1]. Youhei Terai, Tomio Goto “Color Image Enhancement ” Proceedings of IEEE, pp-392-393, Iligan City, 2009.
[2]. Zhengya Xu, Hong Ren, Xinghuo “Color Image Enhancement by Virtual Histogram Approach” IEEEjournal consumer electronics, vol.-56, NO. 2, may 2010, pp.204-208. Subramanya A, “Image Compression Technique,” Potentials IEEE, Vol. 20, Issue 1, pp 19-23, Feb2011.
[3]. David Jeff Jackson & Sidney Joel Hannah, “ Comparative Analysis of image Compression Techniques,” System Theory 1993, Proceedings SSST ’93, 25th Southeastern Symposium,pp 513-517, 7 –9 March 1993.
[4]. Hong Zhang, Xiaofei Zhang & Shun Cao, “ Analysis & Evaluation of Some Image Compression Techniques,” High Performance Computing in AsiaPacific Region, 2000 Proceedings, 4th Int. Conference, vol. 2, pp 799-803,14-17 May, 2000.
ISSN: 2028-9324 Vol. X No. X, Month 20XX
776 | Page SAR Image”
International Journal of Computer Science & Technology, Vol.2, Issue.1, PP-72-74, 2011,
[7]. C. Boncelet, “Image noise models,” in Handbook of Image and Video Processing, A. C. Bovik, Ed.New York: Academic, 2000.
[8]. S. Mallat, "A Wavelet Tour of Signal Processing", 2nd ed. San Diego, CA: Academic, 1999.
[9]. J. K. Romberg, H. Choi, R. G. Baraniuk, “Bayesian tree-structured image modeling using waveletdomainhidden Markov models,” IEEETrans. Image Process., Vol. 10, No. 7, pp. 1056–1068, Jul.2001.
[10]. K. John Peter , Dr K.Senthamarai Kannan , Dr S. Arumugan , G.Nagarajan, “Two-stage image denoising by Principal Component Analysis with Self Similarity pixel Strategy”, International Journal of Computer Science and Network Security, VOL.11 No.5, May 2011, 296-301.
[11]. Ayan Chakrabarti and Keigo Hirakawa, “Effective separation of sparse and non-sparse image feature for denoising”, ICASSP 2008, 857-860.