70 Int. J. Adv. Biol. Biom. Res, 2015; 3 (1), 70-74
*Corresponding Author: Zohreh Nabipour, Ph.D student, Agriculture Faculty, Islamic Azad University of Karaj, Karaj, Iran (zohreh_baniabbass@yahoo.com)
A R T I C L E I N F O A B S T R A C T
Article history: Received: 09 Dec, 2014 Revised: 28 Jan, 2015 Accepted: 26 Feb, 2015 ePublished: 30 Mar, 2015
Key words:
Agroclimate Corn
Deviation from Optimum Percentage (DOP)
Kermanshah
1.INTRODUCTION
Growing-season climate conditions (e.g., rainfall and temperature) affect the growth and yield of corn (Zeamays L.) and cause yield variations. Understanding the climate effect has been a continuous endeavor toward improving farming technology and management strategy to reduce the negative impacts of climate and to increase corn yield (Smith 1903, 1914; Davis and Pallesen 1940; Runge 1968; Allmaras et al. 1964; Voss et al. 1970). The early studies of Smith (1903, 1914) used short-term records (,10 yr) of corn yield and climate and showed that corn yield in some areas of Illinois was
particularly sensitive to rainfall shortly before anthesis and the maximum temperature during anthesis. A study
by Coelho and Dale (1980), using 1972–74 data from
West Lafayette, Indiana, found that corn growth and yield were favored by warmer temperatures from emergence to silking, a result somewhat different from that of Smith. Although depicting some climate influences on corn
yield, these studies are primarily ‘‘case studies,’’ and their
results are difficult to use to gain a comprehensive understanding of climate effects on corn yield because of the short-term records for different years and localities. Additional studies using long-term data of climate and corn yield from a location or a region are needed to IJABBR- 2014- eISSN: 2322-4827
International Journal of Advanced Biological and Biomedical Research
Journal homepage: www.ijabbr.com
Original Article
Climate Effects on Corn Yield in Kermanshah Provinceby
Zohreh Nabipour*1, Farzad Paknejad2
1Ph.D Student, Agriculture Faculty, Islamic Azad University of Karaj, Karaj, Iran 2Asistant Professor, Agriculture Faculty, Islamic Azad University of Karaj, Karaj, Iran
Objective: Understanding climate effects on crop yield has been a continuous endeavor
aiming at improving farming technology and management strategy, minimizing negative
climate effects, and maximizing positive climate effects on yield. Methods: In order to
evaluate agroclimate of Corn cultivation throughout the selected substations at Kermanshah province in this current investigation, the statistics data related to daily temperatures within a 10- year statistical period were employed. Deviation from Optimum Percentage (DOP) technique, Growing Degree Day (Active Day Temperature), and thermal gradient methods have been adapted for computation and agroclimatic
analysis. Results: The results of this study indicate that the optimal date for cultivation
establish such an understanding. Corn yield is affected by weather and climate, whereas corn yield potential is, to a high degree, determined by corn genetics and nutrient availability during growth. Introduction of genetically improved varieties and effective fertilizers since the late 1940s has boosted corn yield, which has increased significantly after 1960 (Huff and Neill 1982; Offutt et al. 1985). The increased corn yield potential also raised issues of whether the advance in technology has lessened or strengthened the sensitivity of yield variation to climate conditions. Garcia etal. (1987) examined these issues by contrasting the yield variations between two
periods, 1931–60 and 1961–82, with very different
farming technologies. They found that ‘‘when (corn) yield
behavior is adjusted for the impact of weather, variances (of yield) were more likely to be equal between the two
periods’’. The similar yield variance in the two periods of
very different technology led them to conclude that the growing-season climate condition remained the primary factor affecting corn yield. This conclusion also was reached in a study by Hollinger and Hoeft (1986), who showed that the effect of nitrogen fertilizers relied heavily on weather conditions; hot and dry conditions could reverse the effect of fertilizer on corn growth and, thus, could amplify the adverse effect of weather and climate on yield. These results demonstrate persistent climate effects on corn growth and yield. Climate effects on corn yield and the yield differences caused by
different within-season distributions of rainfall,
temperature, and daily temperature range are examined in this study for central Missouri using unique corn yield and climate data from 1895 to 1998 (104 yr). The yield dataset also includes records of seed variety (genetics), fertilizer usage, and irrigation, allowing us to disclose climate effects on corn yield after assessing and removing technology influences. The aim of this study detect the effect of Climate Effects on Corn Yield in Kermanshah Provinceby.
Fig 1:
The studied region2. MATERIALS AND METHODS
2.1.Data gathering
2.1.1. Thermal (temperature) Gradient Method
In order to examine the studied region in terms of temperature regarding deviation from optimum conditions with several heights or temporal optimums
based on height; it necessitates using thermal gradient for temperature in points at the height level where there is no substation for measurement. Linear regression method was adapted for acquiring these temperatures. The variance coefficients for temperature together with
the height were computed for months of a year and total year by means of linear regression method. The following formula has been used for calculation of line equation:
)
(
y
ax
b
In this equation,
y
denotes the expected value(dependent variable);
x
is the paramount variable basedon which the prediction is done (independent variable);
a
is a constant coefficient which called intercept; andb
expresses slope or temperature gradient, whichrepresents temperature loss along with height. The
following formulas are used to calculate
a
andb
:(Eq. 1)
)
(
)
(
)
(
)
(
)
(
2 2X
N
XY
X
y
a
X
X
(Eq. 2))
(
)
)(
(
)
(
2 2X
X
N
Y
X
XY
N
b
In order to derive the given results and computation ofabove equations, firstly, elements correlation table is made up for the selected substations within the studied time intervals and it will be mentioned as monthly and annual correlation elements for the selected substations.
2.2. Deviation from Optimum Percentage (DOP)
There are 4 phenological stages in production of Corn crop and each of these stages has an optimum or optimal temperature that Corn has the maximum growth at this optimum temperature. With identifying and determining these optimums for any phenological stage and mean daily temperature derived from minimum and maximum
daily detections, the spatial optimum can be
this technique, initially optimums or optimal temperatures are determined and then by taking mean daily statistical data into consideration, values of deviation from optimum conditions were calculated for total year and then at next step difference among the given mean values was calculated from optimum limits consequently the rate of deviation from optimum conditions might be derived for the above locations and their results could be given in some tables.
2.3. Temperature coefficient method or sum of active days (temperature)
With respect to the importance, which is considered for
temperature cumulative units (degree/day) in
identifying and topology of the susceptible regions for Corn cultivation and determination of cultivation and harvest dates of this crop based on the given thresholds, Growing Degree Days (GDD) techniques were employed. The above data were processed and analyzed by means of functions of Excel software. In this study, active day
temperature method was utilized to estimate
temperature units among the prevalent methods. There are two major techniques for summation of temperature including Sum of active or effective day temperature methods where sum of active day temperature technique has been employed in this investigation.
I) Sum of active day temperature
Phenology or knowledge of phenomena is one of
scientific topics in ecology in which plant’s life cycle is
explored from time of starting germination to permanent hibernation. With respect to climatic changes, especially weather temperature and soil moisture in several years dates of start and end of any period may vary. All values of daily temperatures (without subtraction from base temperatures) are added together and during active
germination days to summate temperature. The
calculation formulas are as follows:
(Eq. 3)
Tt
TMax
TMin
if
TMax
TMin
2
2
Where Tmin and Tmax denote respectively the minimum
and maximum daily temperatures and Tt is biological
temperature in this formula. In method of active day temperature, which has also been employed in this study, sum of daily temperature was used with positive values but this is only for those days in which mean temperature is at biological threshold or higher than biologic zero point. All values higher than 5C° temperature will be computed while all temperatures below 5C° will be excluded.
3. RESULTS
3.1.Thermal (temperature) gradient
In order to examine rate of deviation from optimum conditions in several heights or temporal optimum situation based on height, firstly temperature variations with height has been calculated for months of a year and total year by means of linear regression technique. To achieve the results and calculation of the above formulas, initially table of correlation elements was drawn for the selected substations and in all studied time intervals where the summary of their results are mentioned in Table (1) as monthly and annual correlation elements for the selected substations.
Table 1.
Annual correlation in selected substations from Kermanshah province during phenological periods for
Corn (temperature gradient)
Period
Coefficients
Germination Rosette Flowering Maturation
B 0.06 0.006 0.01 0.005
A 4.54 28.56 10.5 0.34
R 0.88 0.82 0.97 0.95
Cornplant has respectively four phenological phases that
are important in terms of agroclimatic aspect, which have been studied. In Corn plant, these stages Germination, The arrival Silken fibers, Milky stages, Catching up, any phase includes an optimum or optimal temperature where the maximum growth of Corn occurs at this optimal temperature. In order to conduct phenological analysis on Corn, the mid- maturated varieties of Corn with more frequency in this region have been considered as base with respect to the conducted surveys. Table (2) indicates the rate of deviation from optimum conditions at any phenological stage based on mean daily temperature throughout the selected substations. Given those derived results for Corn plant, flowering and total maturation phases in Kermanshah substation has the less deviation from optimum conditions than in other substations. After Kermanshah, Eslamabadwest and
Ravansar substations has lower deviation while
Kangavar substations have more deviation from
Table 2.
Identifying deviation from optimum conditions in Corn at phenological phases with selected substations
Growth phases Substation
Germination The arrival Silken fibers Milky stages Catching up Sum of deviations Optimum Deviated
from conditions
Optimum Deviated from conditions
Optimum Deviated from conditions
Optimu m
Deviated from conditions
Kermanshah 13.5 -4.55 25 10.30 23 -7.65 26.5 -9.31 31.81
Eslamabadwest 13.5 -4.86 25 10.43 23 -7.88 26.5 -9.54 32.71
Ravansar 13.5 -5.71 25 11.30 23 -7.76 26.5 -10.13 34.9
Kangavar 13.5 -6.32 25 12.68 23 -7.77 26.5 -10.87 37.64
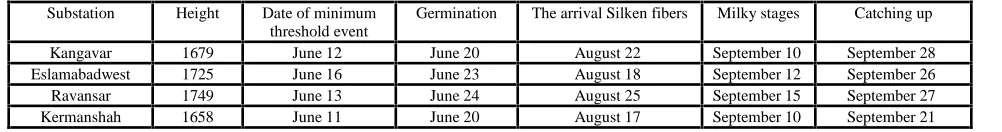
Temporal optimum based on active degree day technique Active degree day method is one of the other agro climatic techniques to determine temporal optimums based on date of the latest event of minimum thresholds at phenological stage (Corn) so this method has been employed in this survey. Sum of daily temperatures was used with positive values but this is only for those days in which temperature is higher than mean biological limited degree or zero point of this activity. Active temperature coefficients are used as base point for calculation in this
study based on plant’s (Corn) minimum thresholds at
each of phenological stages and the other base is zero point (0C°). Given these plant species are extremely dependent on temperature so phenology of plant species (Corn) has been adapted from statistical data of daily
temperature as minimum and maximum detections for this purpose. Date of completion for each of phenological stages has been computed with identifying thresholds at
plant’s (Corn) phenological phases and with daily
temperatures accurately. Date of minimum threshold of biological event has been considered greater than 5 for activation of plant (Corn) in all substations. To acquire completion date for plant (Corn) cultivation phenological stage, it necessitates using 83/5, 153, 234, and 2108 (BTU) thermal unit higher than zero degree (0C°) Germination, The arrival Silken fibers, Milky stages,
Catching up in this plant. Completion dates for plant’s
(Corn) phenological stages in the selected substations are shown in Table (3).
Table 3.
Date of completion for Cornplant at phenological stages
CONCLUSION
Corn is considered as a strategic crop for human and animal nutrition and has high importance in a broad compatibility with temperate and tropical climate zones,. Also, corn has an importance in the diet of humans and animals. Due to the high output power and high consumption indifferent countries and survey and finding ways has been priority to increase the quality and quantity of corn agriculture research consequently,
efforts to produce more and moreeconomical product is
recommended. Population growth in the world,
especially in developing countries is increasing day by day. The expansion of arable and was small due to lack of economic competitiveness infertile land and agricultural systems. In addition to the events such as drought, disease, pests, floods, reducing soil fertility and erosion of existing urban expansion in arable land,
environmental pollution reduce production. Given the importance of access to methods for increasing crop yield is of particular importance. Besides increasing the yield per unit area as the most important way to save human kind from hunger and poverty are largely dependent on correct selection and creation of high yielding varieties
with high potential and quality characteristics,
agronomic operations to use optimum fertilizer etc. The results of this study indicate that the optimal date for cultivation of Corn in high and cold- weather lands (Kermanshah and Eslamabad West) is the of June. Temperature gradient analysis and DOP technique in various heights at the studied region may show that there is one month postponement in deviation from the optimum conditions for optimal cultivation per 100m increase in height of given region. This point is important in terms of date of cultivation and production of commercial product. According to the acquired farming calendar, of June is the most appropriate time for cultivation in this area and thus date of harvest will be the end of September.
Substation Height Date of minimum threshold event
Germination The arrival Silken fibers Milky stages Catching up
REFERENCES
Allmaras, R. R., W. C. Burrwows, and W. E. Larson, 1964: Early growth of corn affected by soil temperature. Soil
Sci. Soc. Amer. J., 28, 271–275.
Davis, F. E., and J. E. Pallesen, 1940: Effect of the amount and distribution of rainfall and evaporation during the growing season on yields of corn and spring wheat. J.
Agric. Res., 60, 1–23.
Coelho, D. T., and R. F. Dale, 1980: An energy crop-growth variable and temperature function for predicting corn growth and development: Planting to silking. Agron. J.,
72, 503–510.
Huff, F. A., and J. C. Neill, 1982: Effects of natural climatic fluctuations on the temporal and spatial variation in crop
yields. J. Appl. Meteor., 21, 540–550.
Offutt, S. E., P. Garcia, and M. Pinar, 1985: Potential benefits to agriculture of augmenting precipitation. J.
Wea. Mod., 17, 23–29.
Runge, E. C., 1968: Effect of rainfall and temperature interaction during the growing season on corn yield.
Agron. J., 60, 503– 507.
Smith, J. W., 1903: Relation of precipitation to yield of
corn. USDA Yearbook 1903, USDA, 215–224., 1914: The
effect of weather upon the yield of corn. Mon. Wea. Rev.,
42, 78–87.
Voss, R. E., J. J. Hanway, and W. A. Fuller, 1970: Influence of soil management and climatic factors on the yield response by corn to N, P, and K fertilizer. Agron. J., 62,