Application of several data-driven techniques to predict a standardized
precipitation index
BAHRAM CHOUBIN
Faculty of Natural Resources, Sari University of Agriculture Sciences and Natural Resources, Sari, Iran Corresponding author; email: [email protected]
ARASH MALEKIAN
Faculty of Natural Resources, University of Tehran, Karaj, Iran
MOHAMMAD GOLSHAN
Faculty of Natural Resources, Sari University of Agriculture Sciences and Natural Resources, Sari, Iran
Received: March 25, 2015; accepted: February 22, 2016
RESUMEN
La modelación y predicción del clima son importantes para la gestión de recursos hidráulicos, especialmente en regiones áridas y semiáridas que con frecuencia sufren escasez de agua. La cuenca de Maharlu-Bakhtegan es una región árida y semiárida de 31 000 km2 localizada al suroeste de Irán, de modo que la precipitación y escasez de agua en esta zona son muy problemáticas. Este estudio presenta una aproximación a la modela-ción del índice de sequía con base en índices climáticos de larga duramodela-ción y el uso del sistema adaptativo de inferencia neurodifusa (ANFIS, por sus siglas en inglés), el árbol de decisión M5P y el modelo perceptrón multicapa (MLP, por sus siglas en inglés). Primero se determinó la mayoría de las señales climáticas a partir de 25 señales climáticas utilizando análisis factorial, y posteriormente se predijo un índice estandarizado de precipitación mediante las técnicas ANFIS, MLP y M5P con anticipación de uno a 12 meses. La evaluación de la aptitud del modelo mediante parámetros de error y diagramas de Taylor demostró que el desempeño del MLP es mejor que el de los otros dos modelos. Los resultados también mostraron que la exactitud de la predicción aumentó de manera considerable cuando se utilizaron índices climáticos del mes previo (t – 1) (RMSE = 0.802, ME = –0.002 y PBIAS = –0.47).
ABSTRACT
Climate modeling and prediction is important in water resources management, especially in arid and semi-arid regions that frequently suffer further from water shortages. The Maharlu-Bakhtegan basin, with an area of 31 000 km2 is a semi-arid and arid region located in southwestern Iran. Therefore, precipitation and water shortage in this area have many problems. This study presents a drought index modeling approach based on large-scale climate indices by using the adaptive neuro-fuzzy inference system (ANFIS), the M5P model tree and the multilayer perceptron (MLP). First, most of the climate signals were determined from 25 climate signals using factor analysis, and subsequently, the standardized precipitation index (SPI) was predicted one to 12 months in advance with ANFIS, the M5P model tree and MLP. The evaluation of the models performance by error parameters and Taylor diagrams demonstrated that performance of the MLP is better than the other models. The results also revealed that the accuracy of prediction increased considerably by using climate indices of the previous month (t – 1) (RMSE = 0.802, ME = –0.002 and PBIAS = –0.47).
Keywords: Standardized precipitation index (SPI), climate signals, multi-layer perceptron (MLP), adaptive neuro-fuzzy inference system (ANFIS), M5P model tree, Taylor diagrams.
© 2016 Universidad Nacional Autónoma de México, Centro de Ciencias de la Atmósfera.
1. Introduction
Drought is a climate feature that occurs occasionally. This phenomenon, which affects more people than any other hazard, is considered by many to be the most complex but least understood of all the natural vulnerabilities (Mishra and Desai, 2005). In Iran, arid climate extends to an area of 573 884 km2 (35.54% of
the territory). The Maharlu-Bakhtegan basin is located in this area; therefore, precipitation and water shortage in this region are very problematic. Meteorological drought occurs when the precipitation average is less than the precipitation average during the long-term period. In Iran, we are confronting challenges in many areas that have arid and semi-arid climates and suffer drought events, so it is necessary to pay more attention to precipitation. Pre-knowledge of the possible amount of precipitation is important in plan-ning water recourses, management of agriculture and droughts, etc. Previous studies show that large-scale climate modes (e.g., North Atlantic Oscillation [NAO],
South Oscillation Index [SOI]) have an influence on
climate and precipitation in different parts of the world (Nazemosadat and Cordey, 2000; Karabörk et al., 2005; Gaughan and Waylen, 2012; Berg et al., 2013; Choubin et al., 2014b).
In this study, we used large-scale climate indi-ces for predicting the standard precipitation index (SPI). Among the several proposed drought moni-toring indices, SPI has widespread application for describing and comparing droughts among different time periods and regions with different climatic conditions (Cancelliere et al., 2007). SPI prediction is a critical issue that has attracted much attention in recent decades all over the world in order to carry out hydrological modeling in arid and semi-arid regions (Rezaeian-Zadeh et al., 2012). Today, more non-lin-ear models are applied to prediction. In previous studies, Dahamsheh and Aksoy (2009), Azadi and Sepaskhah (2012), and Rezaeian-Zadeh et al. (2012)
used artificial neural networks (ANNs), and El-Shafie
et al. (2011), Sanikhani and Kisi (2012), Jeong et
al. (2012), and Choubin et al. (2014a) successfully applied the adaptive neuro-fuzzy inference system (ANFIS) to predict precipitation. In eastern Australia, Deo and Sahin (2015) investigated the application of the ANN model for the prediction of monthly SPIs using hydrometeorological parameters and climate indices. The results showed that the ANN model is a useful data-driven tool for forecasting monthly SPIs.
In the Awash River Basin (Ethiopia), Belayneh et al.
(2014) forecasted the long term SPI drought using wavelet neural networks. The forecasted results indicated that the coupled wavelet neural network (WA-ANN) models were better than all the other models in this study for forecasting SPI 12 and SPI 24 values. Ruigar and Golian (2016) predicted the precipitation in the Golestan dam watershed using climate indices: their results indicated that the MLP model is capable of accurately predicting monthly maximum precipitation.
In this study we compared the performances of three modeling techniques for predicting drought in a 43-yr period (1967-2009) in the Maharlu-Bakhtegan basin of Iran. We used the M5P model tree in addition to ANFIS and the multilayer perceptron (MLP) net-work to predict the SPI using large-scale climate in-dices as input data, over lead times of 1 to 12 months.
2. Methodology
2.1 Study area
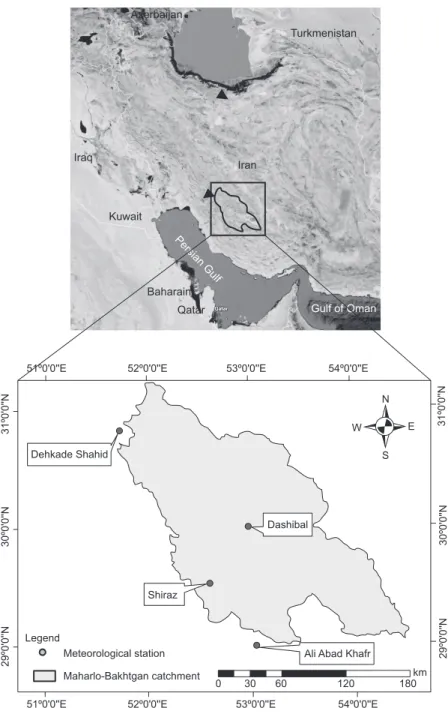
The Maharlu-Bakhtegan basin spreads over 31 000 km2. This area located in southwestern Iran
(29º 00′ to 31º 14′ N, 51º 42′ to 54º 31′ W), with annual
precipitation of 270 mm, is one of the most important agricultural centers of Iran (Fig. 1). In this paper, precipitation data were collected from the Iranian Water Resource Management Company (TAMAB) for four meteorological stations: Shiraz synoptic sta-tion, Dashtbal, Ali Abad Khatr and Dehkade Shahid. First, station data were analyzed and missing data were reconstructed by using the correlation method; then homogeneity and independence of data were evaluated using the run-test method. Homogeneity and dependence were accepted at a high level. We used Thiessen polygons between stations to calculate the average of watershed precipitation.
2.2 Standard precipitation index
calculated for any time scale; yearly, seasonally, monthly or for various months. In this study, a month-ly SPI was obtained based on the average rainfall over the basin for a 43-yr period (1967-2009).
2.3 Large-scale climate indices
Climate signals are oceanic and atmospheric patterns that affect the Earth’s climate in different regions. In this study, the 25 indices were obtained from the National Oceanic and Atmospheric Administration
(NOAA) site (http://www.esrl.noaa.gov/psd/data/ climateindices/list/). Then, factor analysis was used to choose the most effective climate index by reduc-ing the complexity of input variables when there are large volumes of information, thus allowing a better interpretation of variables.
2.4 MLP network
ANNs are simplified versions of a human brain and con -sist of input, hidden and output layers (Gunaydin, 2009).
Turkmenistan
Iran Azerbaijan
Persian Gulf
Baharain
Qatar Gulf of Oman
Kuwait Iraq
Dashibal
Shiraz
0 30 60 120
N
S
W E
180km Legend
Meteorological station Maharlo-Bakhtgan catchment Dehkade Shahid
51º0'0''E 52º0'0''E 53º0'0''E 54º0'0''E
51º0'0''E
31º0'0''N
30º0'0''N
29º0'0''N
31º0'0''
N
30º0'0''N
29º0'0''N
52º0'0''E 53º0'0''E 54º0'0''E
Ali Abad Khafr
MLP is the most common neural network model (Zurada, 1992; Hagan et al., 1996).
In this paper, we used the Levenberg-Marquardt (LM) training algorithm to obtain the weight of the MLP network. LM can be thought as a combination of steepest descent and the Newton method. The MLP network consists of an input layer of source neurons, at least one middle or hidden layer of computation-al neurons, and an output layer of computationcomputation-al
neurons. The output of an artificial neuron can be
expressed as follows:
n w n x + ... 3 w 3 x + 2 w 2 x + 1 w 1 x i w i x =
Output
∑
n =i=1 (1)
where n is the total number of inputs, x1,x2,…,xn are the inputs, w1,w2,…,wn are corresponding weights for the inputs.
In this study, the optimum number of hidden neurons and transfer functions was obtained by ex-periments or by trial and error. Logsig and Purelin transfer functions were used in the hidden and output layers, respectively.
2.5 M5P model tree
Model trees were developed by Quinlan (1992). M5P is a tree-based model used for prediction. Instead of discrete class labels, it uses linear functions at the leaves. M5P is based on the assumption that the functional dependency is not constant in the whole domain, but can be considered on smaller sub do-mains (Dimitri and Xue, 2005).
2.6 ANFIS model
ANFIS is a kind of neural network based on the Sugeno fuzzy inference system (Takagi and Su-geno, 1985), and was first introduced by Jang (1993). This system uses either back propagation or a combination of least squares estimation and back propagation for estimating the membership functions’ parameters.
Since the number of inputs in our study was great-er than six, we cannot use grid partition because the number of fuzzy rules would be too large
(Farokh-nia et al., 2011). So substractive fuzzy clustering
algorithms were used to estabilish rules based on the relationship between input and output variables (Jang and Sun, 1995). Subtractive fuzzy clustering
was introduced by Chiu (1994). In this study, the hy-brid optimization method, which is a combination of least-squares and back propagation gradient descent method was used as an optimization method; also, Gaussian and linear membership functions were selected as optimum for input and output data, re-spectively; and the number of membership functions was determined through trial and error by varying the
range of influence from 0.5 to 1.5.
In the present paper, we used Matlab R2010b for simulating the ANFIS and MLP models, and the Weka package for the M5P model tree. The input data were divided into two parts: training and testing data in an 85 and 15% combination, respectively.
2.7 Data normalization and evaluation criteria
Climate data in a semi-arid region are sparse and irregular in distribution; the best way to improve the robustness of climate information would be data normalization. The best range for data normalization is 0.05-0.95 (Hsu et al., 1955), as follows:
=
xnorm 0.05 + 0.95 xxmaxr − x − xminmin (2)
where, xnorm and xr are the normalized and the original inputs, and xmin and xmax are the minimum and maxi-mum input ranges, respectively.
Some of the common parameters, including root mean square error (RMSE), mean error (ME) and percent bias (PBIAS) were used to check the per-formance of the applied models. These indices are valuable because they disclose errors in the units (or squared units) of the constituent of interest, which aids in the analysis of results (Moriasi et al., 2007). The PBIAS measures the average tendency of the simulated data to be larger or smaller than their ob-served counterparts; the optimal value is 0.0. Positive values indicate a model bias toward underestimation, whereas negative values indicate a bias toward over-estimation (Gupta et al., 1999). These parameters were calculated as follows:
2
(Oi – Pi)
1
RMSE =
∑
N N i
=1
(3)
∑
Ni=1
N =
ME
(Oi – Pi)
=
PBIAS
∑
N
i=1
(Oi – Pi)*(100)
∑
ni=1
(Oi)
(5)
where N is the number of data points considered, and Oi and Pi are the observed and predicted values, respectively.
3. Results
Factor analysis showed that the Kaiser-Meyer-Olkin (KMO) statistic equals to 0.69, so the input variables are suitable for factor analysis (Shrestha and Kazama, 2007). Eight components had eigenvalues greater than 1 and contained 81% of the total variance. Thus, eight climate signals (AMO, AMM, BEST, NINO3.4, NINO4, NTA, SOI, TNA) were selected as most ef-fective after a Varimax rotation with factor loadings of 0.904, 0.826, 0.952, 0.918, 0.855, 0.908, –0.849, and 0.927, respectively.
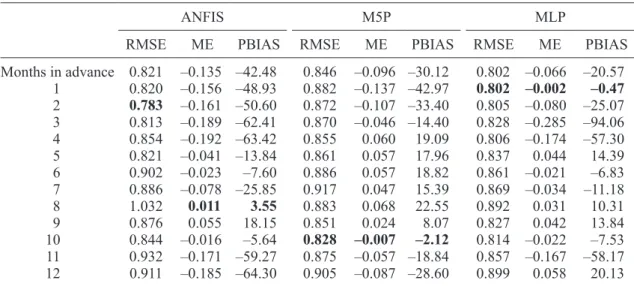
Table I shows the performance of the ANFIS, M5P and MLP models in predicting SPI time series 12 months in advance. Regarding data testing, the best performance of ANFIS was found for eight-months in advance prediction, with RMSE, ME and PBIAS values of 1.032, 0.011, and 3.55, respectively (Table I). For the M5P model tree, the minimum values of RMSE, ME and PBIAS are related to 10-months in advance predictions (RMSE = 0.828, ME = –0.007, and PBIAS
= –2.12). For MLP, the best performance of prediction was obtained one step ahead compared to other models (RMSE = 0.802, ME = –0.002, and PBIAS = –0.47) (Table I). PBIAS indicated that predictions are mostly overestimated (about 85, 54 and 70% for ANFIS, M5P model tree and MLP, respectively).
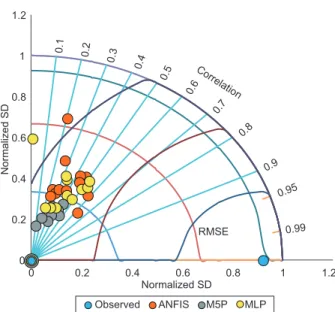
In this paper, we used a Taylor (2001) diagram (Fig. 2) to evaluate the accuracy of ANFIS, MLP, and the M5P model tree. This diagram provides a visual framework for comparing different model results to a reference model or, mainly, to obser-vations. The Taylor diagram is drawn by standard deviation (STD), centered root mean square error (RMSE) and correlation (COR) between different models and observations. Statistics of STD, RMSE and COR were computed for ANFIS, the M5P model tree and MLP from one to 12 months in advance (Fig. 2). The position of each model in the plot shows how closely the simulated SPI pattern matches with observations. From Fig. 2 it can be seen that predictions of ANFIS and MLP are in agreement with observations, unlike the M5P model tree. Although predictions in ANFIS and MLP are quite similar, some step predictions in MLP are closer to observations (e.g., one-month-in-advance predictions). Standard deviation of prediction data indicated that none of the models was able to predict
fluctuations in observation data. Figure 3 compares
the observed and predicted SPI for the testing set in a one-month lag time.
Table I. Performance of models in predicting SPI (from one to 12 months in advance).
ANFIS M5P MLP
RMSE ME PBIAS RMSE ME PBIAS RMSE ME PBIAS
Months in advance 0.821 –0.135 –42.48 0.846 –0.096 –30.12 0.802 –0.066 –20.57
1 0.820 –0.156 –48.93 0.882 –0.137 –42.97 0.802 –0.002 –0.47
2 0.783 –0.161 –50.60 0.872 –0.107 –33.40 0.805 –0.080 –25.07
3 0.813 –0.189 –62.41 0.870 –0.046 –14.40 0.828 –0.285 –94.06
4 0.854 –0.192 –63.42 0.855 0.060 19.09 0.806 –0.174 –57.30
5 0.821 –0.041 –13.84 0.861 0.057 17.96 0.837 0.044 14.39
6 0.902 –0.023 –7.60 0.886 0.057 18.82 0.861 –0.021 –6.83
7 0.886 –0.078 –25.85 0.917 0.047 15.39 0.869 –0.034 –11.18
8 1.032 0.011 3.55 0.883 0.068 22.55 0.892 0.031 10.31
9 0.876 0.055 18.15 0.851 0.024 8.07 0.827 0.042 13.84
10 0.844 –0.016 –5.64 0.828 –0.007 –2.12 0.814 –0.022 –7.53
11 0.932 –0.171 –59.27 0.875 –0.057 –18.84 0.857 –0.167 –58.17
4. Discussion
In this study we used climate indices to predict SPI. Factor analysis was used to determine the most im-portant of large-scale climate signals. Sea surface
temperature (SST) on the Pacific Ocean and ENSO
(including the BEST, NINO3.4, and NINO4 sig-nals), the southern oscillation index (SOI) and SST on the Atlantic Ocean (including the AMO, AMM, NTA, and TNA signals) were selected as the most important signals. In previous studies, Nazemosadat and Cordey (2000), Mariotti et al. (2002) and Pon-gracz and Bartholy (2006) showed the direct effect of ENSO on precipitation. Karabörk et al. (2005) indicated an inverse relationship between SOI and precipitation.
The ANFIS model was found to have the best performance for the eight-month in advance
pre-dictions, whereas the M5P model performed better for 10-month in advance predictions and the MLP network for one-month in advance. Error parameters (Table I) indicated that the MLP network performance was a little better than the other two models, while Dastorani et al. (2010) showed that the potential of ANNs with the ANFIS model is almost the same in predicting dry land precipitation. The Leven-berg-Marquardt training algorithm (used in the MLP network) is more powerful and faster than the stan-dard back-propagation algorithm (used in ANFIS) (Abyaneh et al., 2011). This may be the reason for
the better efficiency of the MLP model compared to
ANFIS. Also, we used the Taylor diagram (Fig. 2) to investigate the accuracy of the models. It is clear that MLP has a better aptitude in comparison with the M5P model tree and ANFIS.
5. Conclusion
Modeling is important in hydrology. This study investigated the prediction of SPI by using several models based on large-scale climate indices. Results showed that the performance of MLP was better than the M5P model tree and ANFIS (Table I). The best performance of the MLP model for SPI prediction was achieved with eight inputs, two hidden and one output neuron (MLP [8, 2, 1]) for a one-month-in-advance prediction. Also, the Taylor diagram (a very useful tool that compares the performance of different
models) indicated that MLP is more efficient than the
M5P and ANFIS models. There are many parameters for the determination of models’ performances, but hydrologists need a tool that can compare different models. The Taylor diagram would be helpful for this purpose. We hope modelers further use this tool in natural sciences and hydrology modeling.
0.1 0.2
0.3 0.4
0.5
0.6 0.7
0.8
0.9
0.95
0.99
RMSE
0 0.2 0.4 0.6 0.8 1 1.2
Correlatio n
0 0.2 0.4 0.6 0.8 1 1.2
Normalized SD
Observed ANFIS M5P MLP Normalized SD
Fig. 2. Comparisons of observed and predicted SPIs by MLP, ANFIS and the M5P model with a one-month delay.
Fig. 3. Comparisons of observed and predicted SPIs for watershed in a one-month lag-time.
–3 –2 –1 0 1 2 3
2003 2004 2004 2004 2005 2005 2006 2006 2006 2007 2007 2008 2008 2009 2009 2009
SPI
Year
References
Ayaneh H. Z., A. Moghadam Nia, M. B. Varkeshi, S.
Ma-rofi and O. Kisi, 2011. Performance evaluation of ANN
and ANFIS models for estimating garlic crop evapo-transpiration. J. Irrig. Drain. E.-ASCE 137, 280-286. Azadi S. and A. R. Sepaskhah, 2012. Annual precipitation
forecast for west, southwest, and south provinces of
Iran using artificial neural networks. Theor. Appl. Climatol. 109, 175-189.
Belayneh A., J. Adamowski, B. Khalil and B. Ozga-Ziel-inski, 2014. Long-term SPI drought forecasting in the Awash River Basin in Ethiopia using wavelet neural network and wavelet support vector regression models. J. Hidrol. 508, 418-429.
Berg N., A. Hall, S. B. Capps and M. Hughes, 2013. El Niño-Southern Oscillation impacts on winter winds over Southern California. Clim. Dyn., doi:10.1007/ s00382-012-1461-6.
Cancelliere A., G. D. Mauro, B. Bonaccorso and G. Rossi, 2007. Drought forecasting using the Stan-dardized Precipitation Index. Water Resour. Manag.
21, 801-819.
Chiu S. L., 1994. Fuzzy model identification based on
cluster estimation. J. Intell. Fuzzy Syst. 2, 267-278. Choubin B., S. Khalighi-Sigaroodi, A. Malekian, S.
Ahmad and P. Attarod, 2014a. Drought forecasting in a semi-arid watershed using climate signals: a neu-ro-fuzzy modeling approach. J. Mt. Sci. 11, 1593-1605, doi:10.1007/s11629-014-3020-6.
Choubin B., S. Khalighi-Sigaroodi, A. Malekian and Ö.
Kişi, 2014b. Multiple linear regression, multi-layer
perceptron network and adaptive neuro-fuzzy infer-ence system for the prediction of precipitation based on large-scale climate signals. Hydrol. Sci. J., doi:10. 1080/02626667.2014.966721.
Dahamsheh A. and H. Aksoy, 2009. Artificial neural
network models for forecasting intermittent month-ly precipitation in arid regions. Meteorol. Appl. 16, 325-337.
Dastorani M. T., A. Moghadamnia, J. Piri and M. Ri-co-Ramirez, 2010. Application of ANN and ANFIS
models for reconstructing missing flow data. Environ. Monit. Assess. 166, 421-434.
Deo R. C. and M. Sahin, 2015. Application of the artifi -cial neural network model for predication of monthly standardized precipitation and evapotranspiration index using hydro meteorological parameters and climate index in eastern Australia. Atmos. Res. 161, 65-81.
Dimitri S. P. and Y. Xue, 2005. M5 model trees and neural
networks: Application to flood forecasting in the upper
reach of the Hui River in China. J. Hydrol. Eng. 9, 491-501.
El-Shafie A., O. Jaafer and A. Seyed, 2011. Adaptive neuro-fuzzy inference system based model for rainfall forecasting in Klang River, Malaysia. Int. J. Phys. Sci.
6, 2875-2888.
Farokhnia A., S. Morid and H. R. Byun, 2011. Application of global SST and SLP data for drought forecasting on Tehran plain using data mining and ANFIS techniques. Theor. Appl. Climatol. 104, 71-81.
Gaughan A. E. and P. R. Waylen, 2012. Spatial and temporal precipitation variability in the Okavang-oe-Kwandoe-Zambezi catchment, southern Africa. J. Arid Environ. 82, 19-30.
Gunaydin O., 2009. Estimation of soil compaction
param-eters by using statistical analyses and artificial neural
networks. Environ. Geol. 57, 203-215.
Gupta H.V., S. Sorooshina and P. O. Yapo, 1999. Status of Automatic Calibration for Hydrologic Models Com-parison with Multilevel Export Calibration. J. Hydrol. Eng. 4, 135-143.
Guttman N. B., 1999. Accepting the standardized precip-itation index: A calculation algorithm. J. Amer. Water Resour. Assoc. 35, 311-322.
Hagan M. T., H. B. Demuth and M. H. Beale, 1996. Neural network design, PWS Publishing Company, Boston, 802 pp.
Hsu K. L., H. V. Gupta and S. Sorooshian, 1955. Artificial
neural network modeling of rainfall-runoff process. Water Resour. Res. 31, 2517-2530.
Jang J. S. R., 1993. ANFIS: adaptive-network-based fuzzy inference system. IEEE T. Syst. Man. Cyb. 23, 665-685. Jang J. S. R. and C. T. Sun, 1995. Neuro-fuzzy modeling
and control. Proc. IEEE. 83, 378-406.
Jeong C. H., Ju-Y. Shin, T. Kim and J. H. Heo, 2012. Monthly Precipitation Forecasting with a Neu-ro-Fuzzy Model. Water Resour. Manag. 26, 4467-4483.
Karabörk M. C., E. Kahya and M. Karaca, 2005. The
influences of the Southern and North Atlantic Oscilla -tions on climatic surface variables in Turkey. Hydrol. Process. 19, 1185-1211.
Mariotti A., N. Zeng and K. M. Lau, 2002. Euro-Med-iterranean rainfall and ENSO-a seasonally varying relationship. S. Afr. J. Sci. 82,196-198.
scales. Eighth Conference on Applied Climatology, Anaheim, California, January.
Mishra A. K. and V. R. Desai, 2005. Drought forecasting using stochastic models. Stoch. Env. Res. Risk A. 19, 326-339. Moriasi D. N., J. G. Arnold, M. W. van Liwe, R. L. Bigner,
R. D. Harmel and T. L. Veith, 2007. Model evaluation
guidelines for systematic quantification of accuracy in
watershed simulations. T. ASABE 50, 885-900. Nazemosadat M. J. and I. Cordey, 2000. On the
relation-ship between ENSO and autumn rainfall in Iran. Int. J. Climatol. 20, 47-61.
Pongracz R. and J. Bartholy, 2006. Regional Effects of ENSO in Central/Eastern Europe. Adv. Geosci. 6, 133-137.
Quinlan J. R., 1992. Learning with continuous classes. Proceedings of the Australian Joint Conference on
Artificial Intelligence. World Scientific, Singapore,
pp. 343-348.
Rezaeian-Zadeh M., H. Tabari and H. Abghari, 2012. Pre-diction of monthly discharge volume by different
arti-ficial neural network algorithms in semi-arid regions.
Arab J. Geosci., doi:10.1007/s12517-011-0517-y.
Ruigar H. and S. Golian, 2016. Prediction of precipitation in Golestan dam watershed using climate signals. Theor. Appl. Climatol. 123, 671-682.
Sanikhani H. and O. Kisi 2012. River flow estimation
and forecasting by using two different adaptive neuro-fuzzy approaches. Water Resour. Manag. 26, 1715-1729.
Shrestha S. and F. Kazama, 2007. Assessment of surface water quality using multivariate statistical techniques: a case study of the Fuji river basin, Japan. Environ. Model. Software 22, 464-475.
Takagi T. and M. Sugeno, 1985. Fuzzy identification of
systems and its applications to modeling and control. IEEE T. Syst. Man. Cyb. 15, 116-132
Taylor K. E., 2001. Summarizing multiple aspects of model performance in a single diagram. J. Geophys. Res. 106, 7183-7192 (also see the PCMDI Report 55, available at: http://wwwpcmdi.llnl.gov/publications/ ab55.html).