Consumer segmentation in multi-attribute product evaluation by means
of non-negatively constrained
CLV3W
Véronique Cariou
a,⇑, Tom F. Wilderjans
b,c aStatSC, ONIRIS, INRA, 44322 Nantes, France b
Methodology and Statistics Research Unit, Institute of Psychology, Faculty of Social and Behavioral Sciences, Leiden University, Pieter de la Court Building, Wassenaarseweg 52, 2333 AK Leiden, The Netherlands
c
Research Group of Quantitative Psychology and Individual Differences, Faculty of Psychology and Educational Sciences, KU Leuven, Tiensestraat 102, Box 3713, 3000 Leuven, Belgium
a r t i c l e i n f o
Article history:
Received 16 October 2016
Received in revised form 14 January 2017 Accepted 18 January 2017
Available online 20 January 2017
Keywords:
Consumer segmentation Three-way structure Clustering of variables CLV
CLV3W
Clusterwise Parafac
Latent variables Acceptance patterns Non-negativity
a b s t r a c t
In consumer studies, segmentation has been widely applied to identify consumer subsets on the basis of their preference for a set of products. From the last decade onwards, a more comprehensive evaluation of product performance has led to take into account various information such as consumer emotion assess-ment or hedonic measures on several aspects, like taste, visual and flavor. This multi-attribute evaluation of products naturally yields a three-way (products by consumers by attributes) data structure. In order to identify segments of consumers on the basis of such three-way data, the Three-Way Cluster analysis around Latent Variables (CLV3W) approach (Wilderjans & Cariou, 2016) is considered. This method groups the consumers into clusters and estimates for each cluster an associated latent product variable and attribute weights, along with a set of consumer loadings, which may be used for the purpose of cluster-specific product characterization. As consumers who rate the products along the attributes in an opposite way (i.e., raters’ disagreement) should not be in the same cluster, in this paper, we propose to add a non-negativity constraint on the consumer loadings and to integrate this constraint within the versatileCLV3Wapproach. This non-negatively constrained criterion implies that the latent variable for each cluster is determined such that consumers within each cluster are as much related – in terms of a positive covariance – as possible with this latent product component. This approach is applied to a con-sumer emotion ratings dataset related to coffee aromas.
Ó2017 Elsevier Ltd. All rights reserved.
1. Introduction
A common way to evaluate the performance of products con-sists of capturing consumer preferences in terms of their overall liking ratings for a given set of products. As consumers differ in products’ liking, consumer segmentation, which is a key procedure to exhibit consumer subsets who rate products similarly, is often used to better understand the diversity of preferences across con-sumers (Onwezen et al., 2012; Vigneau, Qannari, Punter, & Knoops, 2001). In a second step, the obtained consumer segments can be used to study the relationships between acceptability and sensory data by means of an external preference mapping at an aggregated level rather than at the level of individuals (Carbonell, Izquierdo, & Carbonell, 2007; Cariou, Verdun, & Qannari, 2014; Santa Cruz, Martínez, & Hough, 2002; Vigneau & Qannari, 2002). In addition, these consumer subsets can further be characterized in terms of
consumer features, like demographics (Helgesen, Solheim, & Næs, 1997; Sveinsdóttir et al., 2009).
To identify consumer segments, a number of cluster analysis techniques have been proposed and widely applied (Næs, Brockhoff, & Tomic, 2010). In the context of preference data, often crisp clustering methods, such as k-means or (Ward’s) hierarchical clustering (and cutting the obtained dendrogram at a certain num-ber of clusters), are applied to mean-centered data (McEwan, 1996; Qannari, Vigneau, Luscan, Lefebvre, & Vey, 1997). These techniques provide non-overlapping clusters in which each consumer is assigned to a single group only. Alternatively, some authors advo-cated the use of fuzzy cluster analysis techniques (Berget, Mevik, & Næs, 2008; Johansen, Hersleth, & Næs, 2010; Westad, Hersleth, & Lea, 2004) as these methods enjoy nice properties such as fuzzy membership and flexibility. In the same vein, a latent class approach (De Soete & Winsberg, 1993) based on mixture distribu-tions and fuzzy class memberships has been proposed for con-sumer segmentation (Onwezen et al., 2012; Séménou, Courcoux, Cardinal, Nicod, & Ouisse, 2007).
http://dx.doi.org/10.1016/j.foodqual.2017.01.006
0950-3293/Ó2017 Elsevier Ltd. All rights reserved.
⇑Corresponding author.
E-mail address:[email protected](V. Cariou).
Contents lists available atScienceDirect
Food Quality and Preference
As in preference data, rows mostly refer to products and col-umns to consumers, some authors have proposed a clustering of variables approach to perform consumer segmentation. In the statistics community, a well-known clustering of variables algo-rithm is the Varclus SAS/STAT procedure (Sarle, 1990). Alterna-tively,Vigneau and Qannari (2003)proposed a Clustering around Latent Variables (CLV) approach and applied it in sensory analysis (Vigneau & Qannari, 2002; Vigneau et al., 2001).
Traditionally, consumer segmentation was performed based on one attribute, like overall product liking, only (i.e., based on two-way product by consumer data). Nevertheless, in some situations, consumers may rate the same set of products according to different attributes, resulting in three-way product by consumer by attri-bute data (Nunes, Pinheiro, & Bastos, 2011). For example,Santa Cruz et al. (2002)reported a study in which consumers were asked to rate the different samples according to both overall and detailed acceptance (e.g., appearance, manual texture and flavor). Further, in order to perform ‘‘measuring beyond liking”, Meiselman (2013)stressed the potential use within consumer studies of vari-ous kinds of measures for product evaluation, like satisfaction, per-ceived benefits, perper-ceived quality and perper-ceived wellness. Finally, more recently, a growing interest is observed in measuring con-sumer emotions associated with products (Cardello & Jaeger, 2016; King, Meiselman, & Carr, 2010).
To perform consumer segmentation based on three-way data, several approaches have been proposed:
Consumers are clustered (Fig. 1) based on the data of a single attribute (e.g., a general acceptance measure), and, in a second step, the obtained clusters are characterized on the basis of the other attributes (Onwezen et al., 2012; Santa Cruz et al., 2002). A disadvantage of this method is that the resulting par-tition only depends on the chosen attribute in the first step of the procedure.
Clustering consumers based on the unfolded, according to the attribute mode, three-way array (Fig. 1). Problematic with this approach is that, as is true for the approach discussed above, the three-way structure in the data is ignored, which may obfuscate information relevant for the clustering of consumers. A cluster analysis is performed on the data for each attribute separately, and the various consumer partitions are compared to each other. For example, using emotion associations for two meal types, Piqueras-Fiszman and Jaeger (2016)found a strong similarity between the consumer partitions for both meal types. In the same vein, Gordon and Vichi (1998) and Vichi (1999)proposed a consensus approach in which an opti-mal partition is sought among a set of dendrograms or parti-tions. The main weakness of this procedure is that all detailed information on products and attributes gets lost when deter-mining the consensus, which may result in the grouping of con-sumers who disagree in the product evaluation for some of the attributes.
Recently, Wilderjans and Cariou (2016)developed theCLV3W approach1and applied it in the context of a conventional sensory procedure. This resulted in a clustering of the sensory attributes, a sensory latent variable and product scores per cluster, together with a weighting scheme indicating the agreement of each assessor with the panel. Note that CLV3W groups sensory descriptors together according to their covariance, either positive or negative, with the latent component of each cluster. In a consumer evaluation context, however, in which consumers are clustered instead of attributes, it
does not makes sense to group together consumers that have nega-tively correlated multi-attribute product evaluations (i.e., consumers with a reversed product ordering). Indeed, consumer clusters need to consist of consumers that have similar product evaluation patterns. The goal of this paper therefore pertains to tailoringCLV3Wtowards a consumer segmentation context. To this end, theCLV3Wapproach is extended by imposing an additional non-negativity constraint on the vector of consumer loadings. As such, a clustering of the con-sumers into a small number of mutually exclusive groups is obtained, simultaneously, with (non-negative) consumer loadings, a latent product variable and associated attribute weights for each cluster. Note that a single latent variable is derived for each con-sumer cluster as determining a one-component model is more suited to identify consumer acceptance patterns that are characteristic for each cluster than a multidimensional model. The main advantage ofCLV3Wover other proposed methods for consumer segmentation based on way data is that this method fully takes the three-way structure of the data into account when clustering the consumers.
The rest of the paper is organized as follows. In Section2, we give an outline of the CLV3Wmethod, herewith explaining how the additional non-negativity constraint complies with the con-sumer segmentation requirements. In Section 3,CLV3W is illus-trated with a case study involving consumer emotions measured on a set of coffee aromas. Finally, some concluding remarks are presented.
2.CLV3W-NN: constrainedCLV3Wfor three-way consumer segmentation
2.1. Structure of the data
Suppose that the ratings ofIproducts with respect toK attri-butes were recorded forJconsumers, resulting in anIJKdata arrayX(Fig. 1). Each lateral slicejðj¼1;. . .;JÞofX(Kiers, 2000), which is a matrixXj (IK), pertains to the data of a single
con-sumer. Without loss of generality, we assume that all Xj
ðj¼1;. . .;JÞare column-wise centered to remove the consumer effect for all the attributes.
2.2. The CLV3W method with non-negativity constraint (CLV3W-NN)
Starting from a three-way data matrix X, in a CLV3W (Wilderjans & Cariou, 2016)2analysis, theJconsumers are allocated toQnon-overlapping clustersGqðq¼1;. . .;QÞin such a way that the
sum of squared covariances betweentq, a latent product variable for
the clusterGqto which consumerjbelongs, and a weighted average
of the attribute scores of each consumerjðj¼1;. . .;JÞis maximized:
g¼X
J
j¼1
XQ
q¼1
pjqco
v
2ðXjwq;tqÞ; ð1Þwithwqbeing the cluster-specific attribute weights that are
con-stant for all assessors belonging to Gq, andpjq denoting whether
consumerjis allocated (pjq¼1) or not (pjq¼0) to clusterGq.
Max-imizing theCLV3Wcriterion is equivalent to minimizing the least squares loss function associated with aClusterwise Parafacmodel (Wilderjans & Ceulemans, 2013) withQ clusters and one compo-nent in each cluster (Wilderjans & Cariou, 2016):
f¼X
J
j¼1
XQ
q¼1
pjqjjXj
a
jqðtqw0qÞjj2
F; ð2Þ
1 It should be noted that theCLV3Wmodel in which variables (e.g., attributes) are
clustered is mathematically identical to aParaFac with Optimally Clustered Variables
(PFOCV) model (Krijnen, 1993).
2
with all symbols as defined above and
a
jqdenoting the loading ofconsumerjfor clusterGq. Note that
a
jqis undefined when consumerjdoes not belong to clusterGq; in that case,
a
jqis taken equal to 0. Aspointed out above (see Footnote1), thisCLV3Wmodel is mathemat-ically identical to aQ-clusterParaFac with Optimally Clustered Vari-ables– (PFOCV) model (Krijnen, 1993).
To ensure consumers who rate the products along the attributes in a similar way being in the same cluster and consumers who dis-agree in the product evaluation along the attributes to be in differ-ent clusters, a non-negativity constraint is imposed on the consumer loadings
a
jq. This constraint implies that for eachcon-sumer belonging to a particular cluster, the weighted average of his/her attribute scores is positively related to the latent product variable associated to the cluster in question:co
v
ðXqwq;tqÞP0.The model with the latter constraint incorporated will be denoted by the acronym CLV3W-NN, with NN referring to the non-negativity constraint.
2.3. Algorithm
To fit aQ-clusterCLV3W-NNmodel to a three-way data set at hand, first, an initial partition of the consumers intoQclusters is obtained by means of one of the following three procedures: (1) a random or (2) a rational initialization procedure or (3) a proce-dure based on a priori knowledge of the researcher/user. In a ran-dom initialization procedure, the J consumers are randomly allocated toQclusters, with each consumer having an equal prob-ability of being assigned to each cluster. A rational initialization procedure may consist of running an Agglomerative Hierarchical Clustering (AHC) analysis based on criterionfin (2) using Ward’s aggregation criterion (for more information on this procedure, see (Wilderjans & Cariou, 2016)). The obtainedQ-cluster solution can be used as a rational start for theCLV3W-NNalgorithm. Finally, it is also possible to adopt a user-provided consumer partition as initial partition. Such a user-provided partition may be derived from the results of earlier analysis or may be constructed based
on expectations regarding the partition (i.e., which consumers do and which ones do certainly not belong together in a cluster).
2.3.1. Iterative steps of the algorithm
After obtaining an initial consumer partition, the CLV3W-NN algorithm continues by iterating two updating steps until conver-gence. In the first step, the cluster-specific parameterstq,
a
jqandwq are estimated given the consumer partition into the
non-overlapping clustersGqðq¼1;. . .;QÞ. This can be achieved using
a one-component Parafac model (Carroll & Chang, 1970; Harshman, 1970; Hitchcock, 1927) with non-negativity constraint on the consumer loadings3 to each three-way array XðqÞ
ðq¼1;. . .;QÞ, withXðqÞbeing an array that is obtained by only taking
the data slicesXjofXassociated to consumersjthat belong to
clus-terGq; for more information and a comparison of algorithms for
Par-afacwith and without non-negativity constraint, see (Bro & De Jong, 1997; Faber, Bro, & Hopke, 2003; Tomasi & Bro, 2006); for Matlab and R based software to fitParafacmodels with and without non-negativity constraint, see the N-way MATLAB toolbox (Andersson & Bro, 2000) and the R packages Three-way (Andersson & Bro, 2000; Bro & De Jong, 1997; Giordani, Kiers, & Del Ferraro, 2014; Lawson & Hanson, 1974) and multiway (Helwig, 2016). In a second step, each consumer is re-assigned to his/her best fitting cluster based on his/her data and the current value of the cluster-specific parameters tq and wq. To this end, for each cluster Gq
ðq¼1;. . .;QÞ, the optimal non-negative
a
jqgiventqandwqiscom-puted by means of a non-negativity constrained linear regression (Bro & De Jong, 1997; Lawson & Hanson, 1974; Smilde et al., 2004), and consumerj is re-allocated to the cluster Gq for which
fjq¼ jjXj
a
jqðtqw0qÞjj2
Freaches its minimal value. After execution of
the second step, a check is performed to control whether or not there Fig. 1.Clustering schemes in the context of a way data structure: (1) clustering on a reference slice, (2) clustering on the unfolded array and (3) clustering the three-way array.
3
are empty clusters. When this is the case, the consumer who shows the weakest association with his/her cluster in terms of function valuejjXj
a
jqðtqw0qÞjj2
Fis re-allocated to (one of) the empty cluster
(s); this procedure is continued until there are no empty clusters any more. The algorithm is considered converged when (1) updating the consumer cluster memberships leads to the same consumer par-tition, and, as a consequence, to an identical value on the loss func-tion or (2) the improvement in the loss funcfunc-tion value is negligible (i.e., smaller than some pre-defined tolerance value, like:0000001).
2.3.2. Multi-start procedure
Because the presentedCLV3W-NNalgorithm depends on the ini-tial partition that has been used, the algorithm may yield a solution that is not optimal; note that this feature is common to many clus-tering algorithms, like, for example, the very popularLloyd (1982) algorithm for K-means (Steinley, 2003, 2006a, 2006b). An often used way to overcome this limitation of theCLV3W-NNalgorithm consists of using a multi-start procedure in which the algorithm is run multiple times, each time with a different initialization of the consumer partition, and the solution with the optimal loss function value encountered across all runs of the multi-start proce-dure is taken as the final solution. With respect to the initial con-sumer partition, in order to lower the risk of the algorithm retaining a suboptimal solution, we advise to use a multi-start pro-cedure with 50 random starts, the rationalAHCstart, and, when available, one or more user-provided initializations.
2.3.3. Software
Functions to perform aCLV3W-NN analysis have been imple-mented in Matlab (version 2014b) and in R (version 3.2.0) and are available upon request from the authors. Moreover, R code to perform aCLV3W-NNanalysis will soon be added to theRpackage ClustVarLV(Vigneau, Chen, & Qannari, 2015).
2.4. Model selection: Determining the number of clustersQ
An often used procedure to estimate the optimal number of clusters Q consists of, first, applying CLV3W-NN analyses with increasing numbers of clusters (e.g., one, two, three, etc.), and, next, identifying the solution that optimally balances model fit and model complexity. To this end, one may resort to (a general-ized version of) the scree test ofCattell (1966), in which, for the solutions under consideration, the loss function value (2), which functions as a (mis)fit measure, is plotted against the number of clusters (i.e., model complexity). The solution corresponding to the sharpest elbow in the plot is considered the optimal solution. Instead of eyeballing for the sharpest elbow, one may use theCHull method (Ceulemans & Kiers, 2006; Wilderjans, Ceulemans, & Meers, 2013), which allows users to identify the optimal solution in a more automated way. Besides relying on the model selection strategies described above, one should always also consider the interpretability and stability of the solution when deciding about the optimal number of clusters.
3. Case study: coffee aromas emotions dataset
3.1. Coffee dataset
To illustrate the use ofCLV3W-NN, we consider a case study per-taining to consumer emotions associations for a variety of coffee aromas.
3.1.1. List of terms relevant to describe aroma-induced feelings Fifteen affective terms (seeTable 1) were selected, including the six factors exhibited by Chrea et al. (2009), namely Happiness/
Well-being (3 items: happy, well-being, surprised), Disgust Irrita-tion (angry, unpleasant, irritated, disgusted, disappointed), Sooth-ing Peacefulness (calm), EnergizSooth-ing CoolSooth-ing (energetic), Sensory Pleasure (amused, nostalgic) and Awe Sensuality (excited); two additional terms were added: unique and free. These fifteen terms can be categorized according to the two orthogonal bipolar dimen-sions of pleasant-unpleasant and arousing-sleepy (Russell & Pratt, 1980); inTable 1, these fifteen terms are categorized according to the bipolar dimension of pleasant-unpleasant (seeTable 1). More-over, some of them, like excited vs calm, also refer to the arousing-sleepy dimension. Following recommendations of Thomson and Crocker (2013), mainly positive emotions were selected as ‘‘the majority of people seem to exist in a generally positive state of mind”.
3.1.2. Stimuli
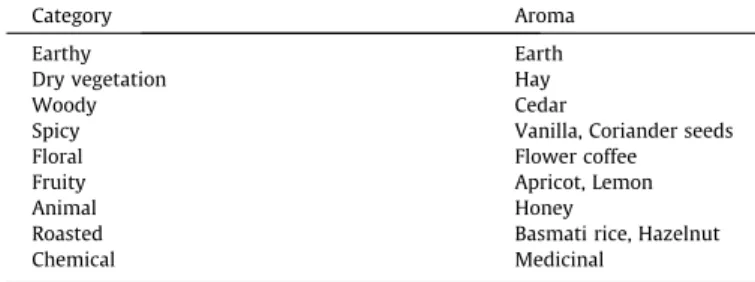
Stimuli were samples of aromas used for training olfactory memory. Twelve samples from the coffee aroma set « Le Nez du CaféÒ» (Jean Lenoir Edition, 2012) were chosen to reflect different aspects of the coffee aromas (seeTable 2). They represented a spec-trum from pleasant to unpleasant aromas, including several aroma families, like fruity odors and floral notes.
3.1.3. Participants
Eighty-four persons (66 females and 18 males) from ONIRIS took part in this study. 77 of them were undergraduate students, they were younger than 25 years old, while the others belonged to the staff of ONIRIS and were older than 25. No participant received any training.
3.1.4. Scale
The participants were asked to complete each rating (i.e., rating the odor of 12 aromas on 15 emotion terms) on a 5-point rating scale. Such a scale was advocated by several authors within the scope of data exploration (Weijters, Cabooter, & Schillewaert, 2010).
3.1.5. Experimental procedure
The experiment took place in a well ventilated room that allowed for hosting four participants at a time. Each participant received a sheet with information regarding the experiment and instructions on how to answer the emotion questionnaire. Data were collected using the Sphinx Plus2-V5 software (Le Sphinx
Développement, SARL, Chavanod, France). Aromas were presented with pillboxes, each pillbox containing drops of an aroma on a cot-ton in order to preserve its odorous characteristics. Pillboxes were labelled with a random three-digit code. The presentation order of the pills was defined using a mutually orthogonal Latin squares design (MacFie, Bratchell, Greenhoff, & Vallis, 1989) to balance out the effect of order of presentation and possible carryover effect. The order of the attributes was randomized across all combina-Table 1
Overview of the 15 emotional attributes of the coffee aromas data.
Positive Negative
Energetic Angry
Calm Unpleasant
Surprised Irritated
Nostalgic Disgusted
Happy Disappointed
tions of participants and products. On average, participants needed 15 min to complete the questionnaire. With respect to each attri-bute, a three-way analysis of variance where the subject, product and order were considered as fixed factors was performed. The sig-nificance level (
a
) was set to 5%. Despite the design of presentation, it appears that among the fifteen emotion terms, four of them were significantly influenced by the order (i.e., angry, disgusted, unpleasant and unique).3.2. Pre-processing and analyzing the data
Before analyzing, in order to deal with some known variations among the consumers, each matrix is column-wise centered to remove the consumers’ main (or shift) effect for each attribute. Further, to control for consumers using different ranges of the scor-ing scales, isotropic scalscor-ing factors were applied, yieldscor-ing an equal total variance for each data blockXj(Kunert & Qannari, 1999).
Next, we analyzed the pre-processed data withCLV3W-NNwith one up to ten clusters. We adopted a multi-start procedure consist-ing of one rational startconsist-ing partition (i.e., the partition obtained with the Agglomerative Hierarchical Clustering procedure) and 50 random initial partitions and retained the solution that yielded the lowest loss function valuefin (2).
3.3. Results and discussion
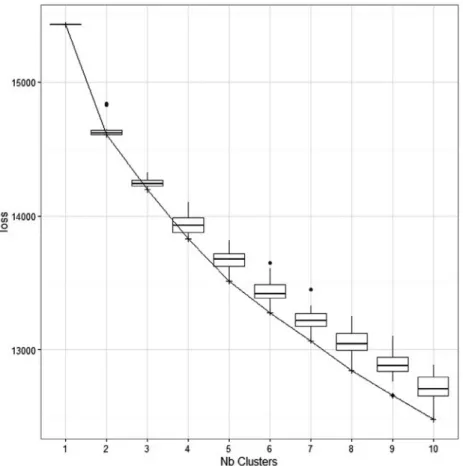
3.3.1. Determining the number of clusters
The evolution of the loss criterion (2) against the number of clusters is depicted inFig. 2; in this figure, for each number of clus-ters, the loss values obtained from 50 random initial partitions and the rational Agglomerative Hierarchical Clustering procedure are summarized by means of a boxplot. From this figure, it appears that the solution with two clusters should be retained as it shows the sharpest elbow.
3.3.2. Results
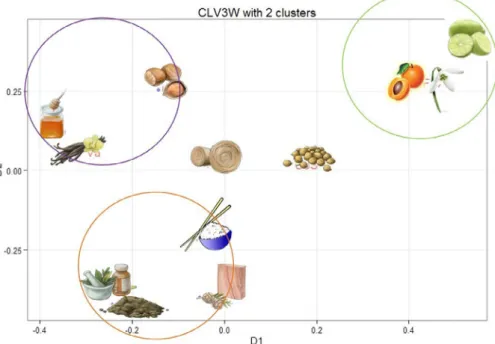
For the retained CLV3W-NN solution with two clusters, the obtained clustering of the consumers along with the consumer loadings is presented inFig. 3, whereas the product scores (resp. attribute weights) for each cluster are depicted in Fig. 4 (resp. Fig. 5). Note that inFigs. 3–5, the two axes D1 and D2 correspond to the two clusters (i.e., the consumer loadings, product scores and attribute weights for the first and second cluster are displayed on D1 and D2, respectively).
Inspecting the retained solution, it appears that the two clusters are equally sized as both contain 42 consumers. For each con-sumer, a loading is estimated that corresponds to the covariance between his/her product scores and the product scores of the clus-ter he/she belongs to. Indeed, as a consumer rates each product in a multi-attribute way, consumer product scores make it possible to synthesize the consumer ratings associated to the set of products. Consumer product scores are obtained using the attribute weights
of the cluster he/she belongs to and depict the way a consumer globally evaluates the set of products. Thus, we can conclude that a high loading corresponds to a high covariance between the con-sumer product scores and the product scores of the cluster he/she belongs to. It finally reflects his/her level of agreement with his/her own cluster. In Fig. 3, the consumer loadings, arranged in an ascending order for ease of reading, are depicted. From this Figure, one can identify the most prototypical consumers for each cluster as those consumers with the highest loadings. Note that there are two consumers that have a zero value, indicating that these consumers are clearly in disagreement with the rest of the panel and therefore can be considered as rather uninformative. Those consumers could be further discarded from the partition. It is worth noting that this zero loading also appears in the ‘‘sparse LV” strategy adopted inCLV (Vigneau, Qannari, Navez, & Cottet, 2016)
When inspecting the product scores (seeFig. 4), one can see strong similarities between the two cluster-specific latent vari-ables, enabling the identification of sets of coffee aroma products that are rated similarly on the attributes across raters. A first set of products, consisting of Basmati rice, Cedar, Earth, and Medicinal, has a negative score for both latent variables. These aromas belong to Roasted, Woody, Earthy and Medicinal notes. Secondly, Apricot, Flower coffee and Lemon aromas are encountered with positive scores on the two latent variables. Fruity and Floral notes encom-pass these three aromas. Three products stress the opposition between the two consumer clusters in the evaluation of the aro-mas. These products correspond to Hazelnut, Honey and Vanilla, which are three aromas that yield negative emotions, with regard to the first consumer subset, and positive emotions for the second consumer cluster. Finally, Coriander seeds and Hay, associated to Spicy and Dry vegetation notes, are encountered with scores around zero for both clusters.
InFig. 5, attributes are presented in (more or less) ascending order according to their component weight for each cluster. Look-ing at this order, one can associate it with the bipolar dimension of pleasant-unpleasant in which disgusted, irritated and unpleasant (i.e., having negative weights) are opposed to amused, happy and well (i.e., positive weights). Note that several attributes have a rel-atively small weighting value, like unique and surprised. Regarding surprised, this could be explained by the fact that surprised may be more associated with pleasant emotion vs unpleasant one (Chrea et al., 2009). With respect to unique, it may be the case that con-sumers have difficulties with scoring the aromas according to this emotion. Amazingly, the distribution of the weights is basically the same across the two clusters. This finding is not caused by a speci-fic property ofCLV3W-NNas this method does not impose any con-straint on the cluster-specific vector of weights. This similarity in weight distributions may be a consequence of the consumers hav-ing the same overall perceptions of the emotion attributes. How-ever, consumers differ in the associations between these emotions (or some of them) and the different aromas (seeFig. 4). In particular, the set of aromas consisting of Hazelnut, Honey and Vanilla, evokes totally opposite emotions between both consumer groups. These three aromas belong to three different notes: Spicy (Vanilla), Animal (Honey) and Roasted (Hazelnut). Inspecting the groups, it appears that the majority of men belong to this second group. This cluster is composed of 26% men compared to a percent-age of 21% in the whole panel (i.e., percentpercent-ages are slightly differ-ent according to a Hypergeometric test:P½X>x ¼6:3%).
In a nutshell,CLV3W-NNreveals the following findings from the coffee aromas dataset:
the 15 emotion terms are perceived in a similar way by the con-sumers in terms of the main bipolar unpleasant-pleasant dimension.
Table 2
Overview of the 12 aromas and the category they belong to of the coffee aromas data.
Category Aroma
Earthy Earth
Dry vegetation Hay
Woody Cedar
Spicy Vanilla, Coriander seeds Floral Flower coffee Fruity Apricot, Lemon
Animal Honey
Roasted Basmati rice, Hazelnut
Fig. 2.Evolution of theCLV3W-NNloss value across increasing numbers of clusters varying from 1 up to 10; boxplots indicate the variability in loss functions values encountered across 50 random starts and a single HAC initialization.
Fig. 4.Configuration of the products (i.e., product loadings) for the two-clusterCLV3W-NNsolution for the coffee aromas data; the two axes D1 and D2 pertain to the two clusters.
Basmati rice, Cedar, Earth and Medicinal are mainly associated with negative emotions, like disgusted, irritated and unpleas-ant, whereas Apricot, Flower coffee and Lemon elicit positive emotions, like amused, happy and well.
Two groups of consumers can be identified based on their opposing evaluation of the aromas of Hazelnut, Honey and Vanilla, corresponding respectively to Roasted, Animal and Spicy notes. A first group associates these aromas with negative emotions, whereas a second group has positive emotions toward these aromas. This latter group is characterized by a higher percentage of men belonging to it.
4. Conclusion
To perform consumer segmentation on the basis of a three-way product by consumer by attribute data array, we proposed the CLV3W-NN approach which aims at identifying simultaneously subsets of consumers – with positively correlated multi-attribute product scores – and a latent product component associated to each group as inCLV3W(Wilderjans & Cariou, 2016). Compared to the latter method,CLV3W-NNoperates with the same optimiza-tion criterion but imposes a non-negativity constraint on the con-sumer vector of loadings. This constraint ensures concon-sumers who rate the products along the attributes in a similar way being grouped into the same cluster and consumers who disagree regarding the product evaluations across the attributes to be in dif-ferent clusters.CLV3W-NNprovides at the same time (1) clusters of consumers, (2) a latent product component capturing the product evaluation patterns associated to each consumer group, (3) a sys-tem of weights indicating the importance of each attribute for each cluster of consumers, and (4) a vector of consumer loadings reflect-ing their level of agreement – in terms of covariance – with the latent component of their group. This latter aspect makes it possi-ble to identify at the same time prototypical consumers having a high level of agreement with their group and non-informative con-sumers disagreeing from the rest of the panel.
Compared to a classical approach consisting of performing a cluster analysis on each attribute slice of the three-way array, CLV3W-NNoffers an overall output that is easier to interpret and which does not require additional consensus methods to aggregate the various obtained partitions (one per attribute slice).CLV3W-NN provides a crisp partition of consumers which is easy to tune and to interpret by the sensory practitioner. We have shown how this approach could be applied within the context of consumer
emo-tions associaemo-tions. In particular,CLV3W-NNidentified the products leading to the main difference between consumer subsets.
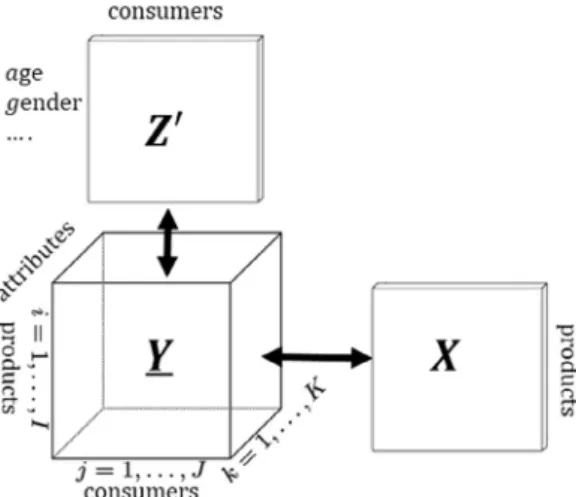
Further research is needed to adapt our approach to more com-plex data structures such as the L-shape structure integrating a three-way array. An L-shaped data structure corresponds to the case where different blocks of data have no common modes but can be rearranged such that one data array makes the connection in two different modes with the two others. This commonly occurs in consumer studies where both consumer data and sociodemo-graphic information as well as attitudes associated to each con-sumer are collected together with characteristics of the products evaluated (e.g. physico-chemical characterization or alternatively sensory profile). Indeed, accounting for consumer information leads to additional information on the consumer mode while con-versely accounting for product characterization provides addi-tional information on the product mode. In order to deal with L-shape structures, Martens et al. (2005) proposed to extend PLS regression (called L-PLSR), this first approach being dedicated to factorial representation rather than consumer segmentation. Sub-sequently,Endrizzi, Gasperi, Calò, and Vigneau (2010)introduced consumer segmentation on the basis of the L-shape structure within the CLV framework. Nevertheless, these two approaches as well as others assumed a 2D-consumer data table (product by consumer).
Going further, an extended L-shape structure can be considered where the datasets at hand corresponds to (1) a 3D-array (product by consumer by attribute), (2) a 2D-consumer matrix with addi-tional data on the consumers and (3) a 2D-product characteristics matrix (Fig. 6). In this context, our aim is to derive theCLV3W-NN criterion to perform consumer segmentation on the basis of such L-shape structure.
References
Andersson, C. A., & Bro, R. (2000). The N-way toolbox for MATLAB.Chemometrics and Intelligent Laboratory Systems, 52(1), 1–4.
Berget, I., Mevik, B.-H., & Næs, T. (2008). New modifications and applications of fuzzy C-means methodology.Computational Statistics & Data Analysis, 52(5), 2403–2418.
Bro, R., & De Jong, S. (1997). A fast non-negativity-constrained least squares algorithm.Journal of Chemometrics, 11(5), 393–401.
Carbonell, L., Izquierdo, L., & Carbonell, I. (2007). Sensory analysis of Spanish mandarin juices. Selection of attributes and panel performance.Food Quality and Preference, 18(2), 329–341.
Cardello, A. V., & Jaeger, S. R. (2016). Measurement of consumer product emotions using questionnaires.Emotion Measurement, 165.
Cariou, V., Verdun, S., & Qannari, E. M. (2014). Quadratic PLS regression applied to external preference mapping.Food Quality and Preference, 32, Part A, 28–34.
Carroll, J. D., & Chang, J.-J. (1970). Analysis of individual differences in multidimensional scaling via an N-way generalization of ‘‘Eckart-Young” decomposition.Psychometrika, 35(3), 283–319.
Cattell, R. B. (1966). The scree test for the number of factors.Multivariate Behavioral Research, 1(2), 245–276.
Ceulemans, E., & Kiers, H. A. L. (2006). Selecting among three-mode principal component models of different types and complexities: A numerical convex hull based method.British Journal of Mathematical and Statistical Psychology, 59 (1), 133–150.
Chrea, C., Grandjean, D., Delplanque, S., Cayeux, I., Le Calvé, B., Aymard, L., et al. (2009). Mapping the semantic space for the subjective experience of emotional responses to odors.Chemical Senses, 34(1), 49–62.
De Soete, G., & Winsberg, S. (1993). A latent class vector model for preference ratings.Journal of Classification, 10(2), 195–218.
De Silva, V., & Lim, L. H. (2008). Tensor rank and the ill-posedness of the best low-rank approximation problem.SIAM Journal on Matrix Analysis and Applications, 30(3), 1084–1127.
Endrizzi, I., Gasperi, F., Calò, D. G., & Vigneau, E. (2010). Two-step procedure for classifying consumers in a L-structured data context. Food Quality and Preference, 21(3), 270–277.
Faber, N. K. M., Bro, R., & Hopke, P. K. (2003). Recent developments in CANDECOMP/ PARAFAC algorithms: A critical review.Chemometrics and Intelligent Laboratory Systems, 65(1), 119–137.
Giordani, P., Kiers, H. A., & Del Ferraro, M. A. (2014). Three-way component analysis using the R package ThreeWay.Journal of Statistical Software, 57(7), 1–23.
Gordon, A., & Vichi, M. (1998). Partitions of Partitions.Journal of Classification, 15(2), 265–285.
Harshman, R. A. (1970). Foundations of the PARAFAC procedure: Models and conditions for an ‘‘explanatory” multi-modal factor analysis.UCLA Working Papers in Phonetics, 16, 1–84.
Helgesen, H., Solheim, R., & Næs, T. (1997). Consumer preference mapping of dry fermented lamb sausages.Food Quality and Preference, 8(2), 97–109. Helwig, N. E. (2016).Component models for multi-way data. R package version 1.0-2.
http://CRAN.R-project.org/package=multiway.
Hitchcock, F. L. (1927). The expression of a tensor or a polyadic as a sum of products. Journal of Mathematics and Physics, 6(1), 164–189.
Johansen, S. B., Hersleth, M., & Næs, T. (2010). A new approach to product set selection and segmentation in preference mapping.Food Quality and Preference, 21(2), 188–196.
Kiers, H. A. (2000). Towards a standardized notation and terminology in multiway analysis.Journal of Chemometrics, 14(3), 105–122.
King, S. C., Meiselman, H. L., & Carr, B. T. (2010). Measuring emotions associated with foods in consumer testing.Food Quality and Preference, 21(8), 1114–1116.
Krijnen, W. P. (1993). The analysis of three-way arrays by constrained PARAFAC methods. Leiden, The Netherlands: DSWO Press.
Krijnen, W. P., Dijkstra, T. K., & Stegeman, A. (2008). On the non-existence of optimal solutions and the occurrence of ‘‘degeneracy” in the Candecomp/Parafac model. Psychometrika, 73(3), 431–439.
Kunert, J., & Qannari, E. M. (1999). A simple alternative to generalized procrustes analysis: Application to sensory profiling data.Journal of Sensory Studies, 14(2), 197–208.
Kroonenberg, P. M. (2008).Applied multiway data analysis. Hoboken, NJ: Wiley.
Lawson, C. L., & Hanson, R. (1974). Linear least squares with linear inequality constraints.Chap, 23, 158–173.
Lloyd, S. (1982). Least squares quantization in PCM.IEEE Transactions on Information Theory, 28(2), 129–137.
MacFie, H. J., Bratchell, N., Greenhoff, K., & Vallis, L. V. (1989). Designs to balance the effect of order of presentation and first-order carry-over effects in hall tests. Journal of Sensory Studies, 4(2), 129–148.
Martens, H., Anderssen, E., Flatberg, A., Gidskehaug, L. H., Høy, M., Westad, F., et al. (2005). Regression of a data matrix on descriptors of both its rows and of its columns via latent variables: L-PLSR.Computational Statistics & Data Analysis, 48 (1), 103–123.
McEwan, J. A. (1996). Preference mapping for product optimization. In N. Tormod & R. Einar (Eds.),Data handling in science and technology. Elsevier.
Meiselman, H. L. (2013). The future in sensory/consumer research:. . .. . .. . .evolving to a better science.Food Quality and Preference, 27(2), 208–214.
Mitchell, B. C., & Burdick, D. S. (1994). Slowly converging parafac sequences: Swamps and two-factor degeneracies.Journal of Chemometrics, 8(2), 155–168.
Næs, T., Brockhoff, P. B., & Tomic, O. (2010). Quality control of sensory profile data. Statistics for Sensory and Consumer Science, 11–38.
Nunes, C. A., Pinheiro, A. C. M., & Bastos, S. C. (2011). Evaluating consumer acceptance tests by three-way preference mapping obtained by parallel factor analysis (PARAFAC).Journal of Sensory Studies, 26(2), 167–174.
Onwezen, M. C., Reinders, M. J., van der Lans, I. A., Sijtsema, S. J., Jasiulewicz, A., Dolors Guardia, M., et al. (2012). A cross-national consumer segmentation based on food benefits: The link with consumption situations and food perceptions.Food Quality and Preference, 24(2), 276–286.
Piqueras-Fiszman, B., & Jaeger, S. R. (2016). Consumer segmentation as a means to investigate emotional associations to meals.Appetite, 105, 249–258.
Qannari, E., Vigneau, E., Luscan, P., Lefebvre, A., & Vey, F. (1997). Clustering of variables, application in consumer and sensory studies. Food Quality and Preference, 8(5), 423–428.
Russell, J. A., & Pratt, G. (1980). A description of the affective quality attributed to environments.Journal of personality and social psychology, 38(2), 311.
Santa Cruz, M. J., Martínez, M. C., & Hough, G. (2002). Descriptive analysis, consumer clusters and preference mapping of commercial mayonnaise in Argentina.Journal of Sensory Studies, 17(4), 309–325.
Sarle, W. (1990).The VARCLUS procedure. SAS/STAT user’s guide.
Séménou, M., Courcoux, P., Cardinal, M., Nicod, H., & Ouisse, A. (2007). Preference study using a latent class approach. Analysis of European preferences for smoked salmon.Food Quality and Preference, 18, 720–728.
Smilde, A., Bro, R., & Geladi, P. (2004). Visualization. Multi-Way Analysis with Applications in the Chemical Sciences, 175–220.
Stegeman, A. (2006). Degeneracy in Candecomp/Parafac explained for pp2 arrays of rank p + 1 or higher.Psychometrika, 71(3), 483–501.
Stegeman, A. (2007). Degeneracy in Candecomp/Parafac and Indscal explained for several three-sliced arrays with a two-valued typical rank.Psychometrika, 72(4), 601–619.
Steinley, D. (2003). Local optima in K-means clustering: What you don’t know may hurt you.Psychological Methods, 8(3), 294.
Steinley, D. (2006a). K-means clustering: A half-century synthesis.British Journal of Mathematical and Statistical Psychology, 59(1), 1–34.
Steinley, D. (2006b). Profiling local optima in K-means clustering: Developing a diagnostic technique.Psychological Methods, 11(2), 178.
Sveinsdóttir, K., Martinsdóttir, E., Green-Petersen, D., Hyldig, G., Schelvis, R., & Delahunty, C. (2009). Sensory characteristics of different cod products related to consumer preferences and attitudes. Food Quality and Preference, 20(2), 120–132.
Thomson, D. M. H., & Crocker, C. (2013). A data-driven classification of feelings.Food Quality and Preference, 27(2), 137–152.
Tomasi, G., & Bro, R. (2006). A comparison of algorithms for fitting the PARAFAC model.Computational Statistics & Data Analysis, 50(7), 1700–1734.
Vichi, M. (1999). One-mode classification of a three-way data matrix.Journal of Classification, 16(1), 27–44.
Vigneau, E., Chen, M., & Qannari, E. M. (2015). ClustVarLV: An R package for the clustering of variables around latent variables.The R Journal, 7(2), 134–148.
Vigneau, E., & Qannari, E. M. (2002). Segmentation of consumers taking account of external data. A clustering of variables approach.Food Quality and Preference, 13 (7–8), 515–521.
Vigneau, E., & Qannari, E. M. (2003). Clustering of variables around latent components.Communications in Statistics – Simulation and Computation, 32(4), 1131–1150.
Vigneau, E., Qannari, E. M., Navez, B., & Cottet, V. (2016). Segmentation of consumers in preference studies while setting aside atypical or irrelevant consumers.Food Quality and Preference, 47, Part A, 54–63.
Vigneau, E., Qannari, E. M., Punter, P. H., & Knoops, S. (2001). Segmentation of a panel of consumers using clustering of variables around latent directions of preference.Food Quality and Preference, 12(5–7), 359–363.
Weijters, B., Cabooter, E., & Schillewaert, N. (2010). The effect of rating scale format on response styles: The number of response categories and response category labels.International Journal of Research in Marketing, 27(3), 236–247.
Westad, F., Hersleth, M., & Lea, P. (2004). Strategies for consumer segmentation with applications on preference data. Food Quality and Preference, 15(7–8), 681–687.
Wilderjans, T. F., & Cariou, V. (2016). CLV3W: A clustering around latent variables approach to detect panel disagreement in three-way conventional sensory profiling data.Food Quality and Preference, 47, Part A, 45–53.
Wilderjans, T. F., & Ceulemans, E. (2013). Clusterwise Parafac to identify heterogeneity in three-way data. Chemometrics and Intelligent Laboratory Systems, 129, 87–97.