Sharif University of Technology
Scientia IranicaTransactions E: Industrial Engineering www.scientiairanica.com
Application of the Taguchi method for the optimization
of visual inspection parameters for multi-layer ceramic
capacitors
C.C. Wu
a;and T.S. Su
ba. Department of Information Management, I-SHOU University, No.1, Sec. 1, Syuecheng Rd., Dashu District, Kaohsiung City 84001, Taiwan.
b. Department of Industrial Management, National Pingtung University of Science and Technology, 1 Hsueh-Fu Rd., Nei Pu Hsiang, Pingtung, 912, Taiwan.
Received 13 January 2013; received in revised form 23 November 2013; accepted 13 January 2014
KEYWORDS Multi-layer ceramic capacitors;
Parameter design; Taguchi method; Visual inspection; Manufacturing process.
Abstract. Multi-Layer Ceramic Capacitors (MLCC) are extensively used as important components of various electric and electronic products. Generally, electronic consumer products, such as mobile phones and digital TVs, contain at least 150 MLCCs, which are manufactured in batches of millions of units. Automated inspection machines have replaced manual optical inspection of MLCC units. To improve the quality of optical inspection in this automated operation, the Taguchi method is used to formulate an experimental layout of machines using ve important parameters that describe practical manufacturing processes. In this study, not only is the parameter design for machines that automatically inspect MLCC optimized, but also signicant parameters that inuence the quality of optical inspection of the MLCCs are obtained. Experimental results illustrate the eectiveness of the method.
© 2014 Sharif University of Technology. All rights reserved.
1. Introduction
Multi-Layer Ceramic Capacitors (MLCC) are exten-sively used in computers, communications, and con-sumer electronic (3C) products such as mobile phones, notebook computers, LCD TVs and tablet PCs be-cause of their small size, large capacitance and high stability [1]. The length, width and height of each MLCC are 1.0, 0.5 and 0.5 mm, respectively. Each batch of production consists of anywhere from hun-dreds to millions of units. To improve their quality and the production eciency, automated inspection machines have replaced optical inspection machines to inspect them for defects of products. The automated
*. Corresponding author. Tel.: +886 7 6577711; Fax: +886 7 6578491
E-mail address: [email protected] (C.C. Wu)
inspection machine adjusts parameter settings for three products, but the settings of the machines are set by inspectors based on personal experience, without the application of consistent standards or criteria. If parameters are set too strictly, then non-defective products will be categorized as defective, and the false-negative error rate is increased. If parameters are set too loosely, then, the error that denes the rate of identication of defective products as non-defective may also be increased. Therefore, the parameter settings of an optical inspection machine signicantly aect production yield.
In previous studies of MLCCs, Yang et al. [2] de-veloped a Tabu-search simulation optimization method for solving the problem of scheduling in a ow shop with multiple processors. A practical case study of an MLCC manufacturing plant is presented to illustrate the proposed solution methodology. Yang et al. [3]
decision-making methods; one for ranking preferences by similarity to ideal solutions, and the other, an analytic hierarchy process, for solving a combinatorial dispatching rule problem associated with an MLCC manufacturing system. Cho et al. [5] developed a sim-ple and cost-eective method for fabricating discrete component-embedded printed circuit boards.
With respect to investigations that involve the application of the Taguchi method specically, George et al. [6] applied the method to formulate an exper-imental layout for establishing the ranking of pre-dominance. Macodiyo and Soyama [7] utilized the Taguchi method to identify critical factors to improve the fatigue strength of chrome-molybdenum steel and to eciently optimize cavitation peening. Hung et al. [8] used the Taguchi method to discover the combi-nation of production levels of control factors to provide low production loss and reduce production variance. Nalbant et al. [9] applied the Taguchi method to study the performance characteristics of the turning operations of AISI 1030 steel bars. Chou et al. [10] used the Taguchi method to determine the optimal operating conditions for improving the roundness and surface roughness of the work pieces. Kim et al. [11] applied the Taguchi method to optimize experimental conditions for the preparation of bimodal Ag nanopar-ticles in a semi-batch reactor. Tzou et al. [12] used the method to optimize the thermal conductivity of 1050 aluminum substrates with Cu or Ag thin lms that were formed under various sputtering conditions. Ozcelik [13] utilized the Taguchi experimental method to examine the eect of injection parameters on the mechanical properties of specimens with a weld line of polypropylene during plastic injection molding. Yiam-sawas et al. [14] used the Taguchi method to examine the factors that promote the growth of zinc oxide nanocrystals. Lin et al. [15] utilized the method to improve the quality of processes for coating thin-lm transistor liquid-crystal display panels with polyimide. Bilici [16] utilized the Taguchi method to optimize friction stir spot welding parameters of polypropy-lene. The Taguchi method has been extensively used to optimize the parameters of this process [17-20].
The above review of current literature clearly shows that no one has used the Taguchi method to set inspection parameters to evaluate the quality of MLCCs. Therefore, this work uses the Taguchi method to optimize the parameter settings of automated op-tical inspection machines to reduce the error rate of inspection and to increase the throughput of the inspection process.
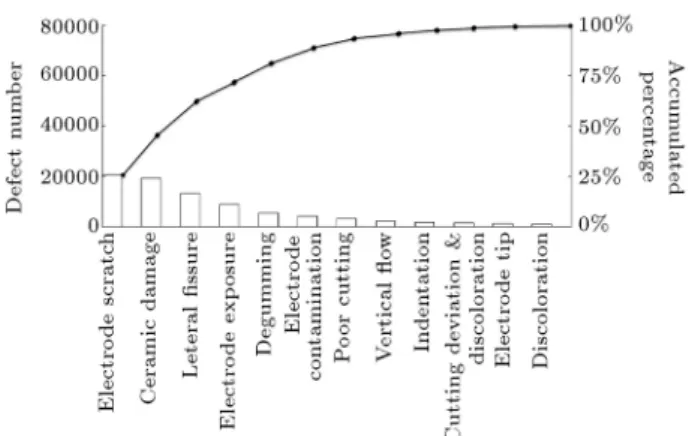
Figure 1. MLCC visual defect Pareto analysis.
2. Case study
Company Y, located in Kaohsiung, Taiwan, is one of the three largest global passive component manufac-turers. Its products include resistor covers, inductors and capacitors. Its annual throughput of MLCCs is approximately 30 billion units. The MLCCs that are manufactured by this company can be grouped into categories, X7R, X5R, and Y5R, based on their sensi-tivity to temperature. Products of all three types are very small. They are typically used in high-capacitance and high-voltage products. Their small size and the large batch size demand automated optical inspection rather than manual visual in all instances of inspection. Figure 1 shows the Pareto analysis of optically or visually identied defects. The analysis used 82677 sets of inspection data that were obtained from the internal quality control system (Compostar CNET) from Jan-uary 2011 to December 2011, as shown in Figure 1.
Based on the analysis of Figure 1, the ve most common causes of optical defects are: scratching of the electrode (20616 defects or 25%), ceramic damage (19302 defects or 23%), lateral ssure (13284 defects or 15%), electrode exposure (8934 defects or 11%), degumming (5433 defects or 7%), and others (15108 defects or 19%) in that order (Figure 2). Table 1 presents the types of MLCC products manufactured by Company Y.
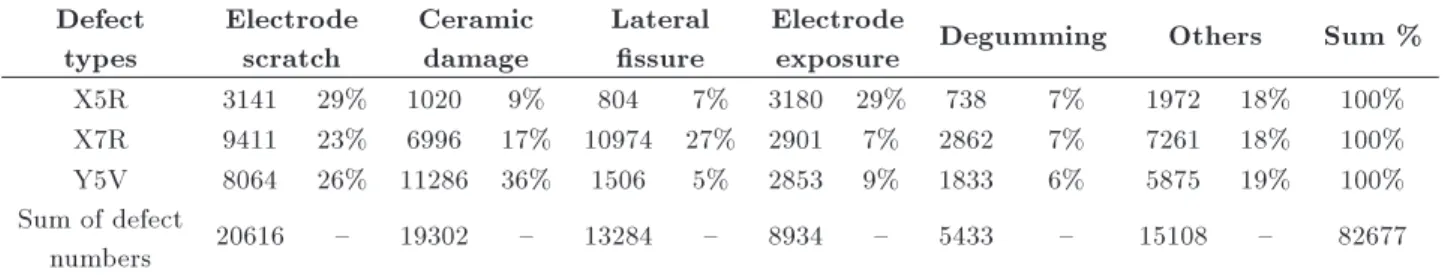
In Table 1, the visual defect type is related to the product properties. For X5R products, the major visual defect types are electrode exposure and electrode scratch; for X7R products, the major visual defect types are lateral ssure and electrode scratch; for Y5V products, the major visual defect types are ceramic damage and electrode scratch. An MLCC is constructed from two or more alternating layers of ceramic and a metal, which act as electrodes. The composition of the ceramic material determines its electrical behavior. Accordingly, some visible defects may change the capacitance of the MLCC and cause it to be functionally defective. Company Y currently utilizes three types of optical inspection equipment.
Figure 2. MLCC visual defect types.
Table 1. Statistical analysis for product types and defect types. Defect
types
Electrode scratch
Ceramic damage
Lateral ssure
Electrode
exposure Degumming Others Sum %
X5R 3141 29% 1020 9% 804 7% 3180 29% 738 7% 1972 18% 100%
X7R 9411 23% 6996 17% 10974 27% 2901 7% 2862 7% 7261 18% 100%
Y5V 8064 26% 11286 36% 1506 5% 2853 9% 1833 6% 5875 19% 100%
Sum of defect
numbers 20616 { 19302 { 13284 { 8934 { 5433 { 15108 { 82677
Two are the Japanese O and K types, and the third is the Y type, which was developed in Taiwan. The Japanese K type equipment is used in 80% of optical inspections; the Taiwanese Y type equipment is used in 13%, and the Japanese O type equipment is used in 7%. This study concerns the setting of the parameters of the Japanese K type optical inspection equipment (machine), as it is the most frequently used, but the results of this study can be easily extended to any optical inspection equipment.
The optical inspection machine identies defects by radiating the surface of an MLCC with a light source, scanning it linearly with an optical lens, and then identifying the defect from the variation of brightness of the color of the surface of the MLCC. The optical inspection machine depends on various parameter settings to inspect dierent products. The purpose of inspection is to minimize the error rate of inspection, which is dened by Eq. (1), given the inspection of S products:
" = Gb+ Bg
S ; (1)
where:
" Error rate (%);
Gb Number of defective products
among the products identied as non-defective;
Bg Number of non-defective products
among the products identied as defective products;
S Total die number in experiment batch. An inspector typically adjusts the particular pa-rameter settings of an optical inspection machine, according to the products to be inspected. Overly strict or loose parameter settings increase the error rate of
inspection. The next section will introduce the Taguchi experimental design and analysis that are used in the present study.
3. The experiment
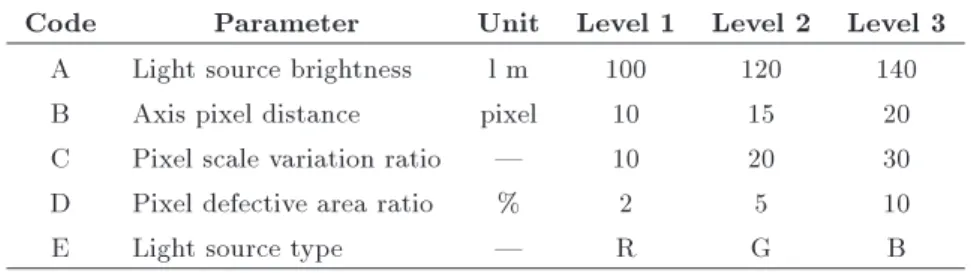
In this study, 500 MLCCs of each of the three types, X5R, X7R, and Y5V, are used. Out of the 500 MLCCs of each product type, 400 are non-defective and the rest are defective. The Japanese K type optical inspection machine is used to determine the equipment setup parameters that aect optical inspection. Based on dis-cussions with on-site engineers, equipment technicians and eld operators, ve critical parameters of optical inspection are identied. They are (1) The brightness of the light source in lm; (2) The distance from the pixels to axis in pixels, used to specify the distance from one point to another along a straight line on the surface of a product; (3) Relative variation of the gray scale of pixels; (4) The pixel defective area ratio, which is the ratio of visual defects to the surface area of the MLCC; (5) The color of the light source; red (R), green (G) or blue (B).
Consistent with the Taguchi method for designing experiments, each of the above ve control factors are set at one of three levels, as shown in Table 2. Experiments and studies, as well as experience in optical inspection at Company Y, have demonstrated the absence of any interaction among the factors. The mixed orthogonal array in the Taguchi method was L18(21 37) (see Table 3).
4. Data analysis
4.1. Taguchi design and analysis of variance In this study, the error rate of inspection is minimized, consistent with a \the-smaller-the-better" quality
char-B Axis pixel distance pixel 10 15 20
C Pixel scale variation ratio | 10 20 30
D Pixel defective area ratio % 2 5 10
E Light source type | R G B
Table 3. Experimental layout using L18(21 37).
A B C D E
Trial no. 1 2 3 4 5 6 7 8
1 1 1 1 1 1 1 1 1
2 1 1 2 2 2 2 2 2
3 1 1 3 3 3 3 3 3
4 1 2 1 1 2 2 3 3
5 1 2 2 2 3 3 1 1
6 1 2 3 3 1 1 2 2
7 1 3 1 2 1 3 2 3
8 1 3 2 3 2 1 3 1
9 1 3 3 1 3 2 1 2
10 2 1 1 3 3 2 2 1
11 2 1 2 1 1 3 3 2
12 2 1 3 2 2 1 1 3
13 2 2 1 2 3 1 3 2
14 2 2 2 3 1 2 1 3
15 2 2 3 1 2 3 2 1
16 2 3 1 3 2 3 1 2
17 2 3 2 1 3 1 2 3
18 2 3 3 2 1 2 3 1
acteristic, as dened by Taguchi. The most appro-priate Signal-to-Noise ratio (SN ratio) that must be maximized for this Taguchi quality characteristic, as explained by Ross [21], is:
= 10: log10 1 n
n
X
i=1
y2 i
!
; (2)
where n is the number of measurements in a trial (and in this experiment, n = 1), and yi is the ith
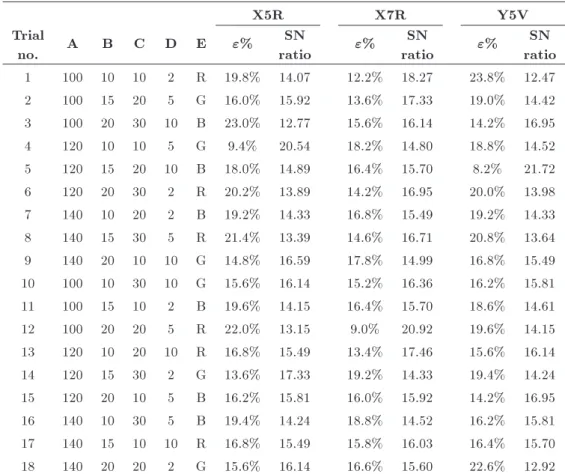
measurement made in a trial. In this study, Minitab software is used to compute " and the SN ratio in all trials. For each trial, " and the SN ratio are calculated for X5R, X7R and Y5V products, as indicated in Table 4.
The SN ratio response of each control factor-level for X5R-X7R and Y5V products are calculated and recorded in Tables 5 through 7, respectively.
Analysis of variance (ANOVA) is performed to de-termine whether the experimental factors signicantly
inuence the SN quality characteristics of the three products, X5R, X7R and Y5V. The ANOVA for SN ratios of X5R, X7R and Y5V products are calculated and recorded in Tables 8 through 10, respectively. The F ratio was computed, and a level of signicance of was used to set the upper limit on the probability of Type I error in all tests of hypotheses associated with the ANOVA tables. As seen in Tables 8, 9 and 10, the signicant parameters for the X5R and X7R products are A, B, C and E; for Y5V products, they are A, D and E.
4.2. Conrmation tests
The predicted SN of the aspect ratio and standard deviation, using the optimal level of each factor, are calculated from the following equation [22]:
^ = m+ q
X
i=1
(i m) ; (3)
where m is the total of the mean SN ratios, i is
the mean SN ratio when factor i is at its optimal level, and q is the number of process parameters that signicantly inuence the performance characteristic. From Table 4, m = 15:24 for X5R; m = 16:29 for
X7R; and m = 15:22 for Y5V. The optimal
param-eter combination for X5R is A2B1C1E2; the optimal parameter combination for X7R is A1B3C2E1; the optimal parameter combination for Y5V is A2D3E3. The calculations are as follows:
^X5R=15:24 + (16:33 15:24) + (15:8 15:24)
+ (16:11 15:24) + (17:11 15:24) = 19:63; ^X7R=16:29 + (17:45 16:29) + (1675 16:29)
+ (17:08 16:29) + (17:72 16:29) = 20:13; ^Y 5V =15:22 + (16:26 15:22) + (16:97 15:22)
+ (16:73 15:22) = 19:52:
Table 11 presents the results of the conrmatory experiments using the optimal inspection parameters for X5R, X7R and Y5V products. The predicted machining performance is close to the actual
machin-Table 4. Error rate and SN ratio for various MLCCs.
X5R X7R Y5V
Trial
no. A B C D E "%
SN
ratio "%
SN
ratio "%
SN ratio 1 100 10 10 2 R 19.8% 14.07 12.2% 18.27 23.8% 12.47 2 100 15 20 5 G 16.0% 15.92 13.6% 17.33 19.0% 14.42 3 100 20 30 10 B 23.0% 12.77 15.6% 16.14 14.2% 16.95
4 120 10 10 5 G 9.4% 20.54 18.2% 14.80 18.8% 14.52
5 120 15 20 10 B 18.0% 14.89 16.4% 15.70 8.2% 21.72 6 120 20 30 2 R 20.2% 13.89 14.2% 16.95 20.0% 13.98 7 140 10 20 2 B 19.2% 14.33 16.8% 15.49 19.2% 14.33 8 140 15 30 5 R 21.4% 13.39 14.6% 16.71 20.8% 13.64 9 140 20 10 10 G 14.8% 16.59 17.8% 14.99 16.8% 15.49 10 100 10 30 10 G 15.6% 16.14 15.2% 16.36 16.2% 15.81 11 100 15 10 2 B 19.6% 14.15 16.4% 15.70 18.6% 14.61 12 100 20 20 5 R 22.0% 13.15 9.0% 20.92 19.6% 14.15 13 120 10 20 10 R 16.8% 15.49 13.4% 17.46 15.6% 16.14 14 120 15 30 2 G 13.6% 17.33 19.2% 14.33 19.4% 14.24 15 120 20 10 5 B 16.2% 15.81 16.0% 15.92 14.2% 16.95 16 140 10 30 5 B 19.4% 14.24 18.8% 14.52 16.2% 15.81 17 140 15 10 10 R 16.8% 15.49 15.8% 16.03 16.4% 15.70 18 140 20 20 2 G 15.6% 16.14 16.6% 15.60 22.6% 12.92 Table 5. Response of SN ratio to each level for X5R
products (larger is better).
Level A B C D E
1 14.37 15.80 16.11 14.99 14.37 2 16.33 15.20 14.99 15.51 17.11 3 15.03 14.73 14.63 15.23 14.25 Max-Min 1.96 1.08 1.48 0.52 2.86
Rank 2 4 3 5 1
Table 6. Response of SN ratio to each level for X7R products (larger is better).
Level A B C D E
1 17.45 16.15 15.95 16.06 15.58 2 15.86 15.97 17.08 16.7 15.57 3 15.56 16.75 15.84 16.11 17.72 Max-Min 1.9 0.78 1.25 0.64 2.15
Rank 2 4 3 5 1
ing performance. For X5R products, the increase in the SN ratio from the initial values of the inspection parameters to the optimal values of the inspection parameters is 4.4, corresponding to a 6.2% reduction in error rate. For X7R products, the increase in the SN ratio from the initial values of the inspection
Table 7. Response of SN ratio to each level for Y5V products (larger is better).
Level A B C D E
1 14.74 14.85 14.96 13.76 16.73 2 16.26 15.72 15.62 14.92 14.57 3 14.65 15.08 15.07 16.97 14.35 Max-Min 1.61 0.88 0.66 3.21 2.38
Rank 3 4 5 1 2
parameters to the optimal values of the inspection parameters is 4.89, corresponding to a reduction in error rate of 6.8%. For Y5V products, the increase in the SN ratio from the initial values of the inspection parameters to the optimal values of the inspection parameters is 6.02, corresponding to a reduction in error rate of 8.2%.
5. Conclusions
The main contribution of this study is the use of the Taguchi method to determine eciently the opti-mal combination of optical inspection parameters for MLCC, using as few experiments as possible. The experimental results support the following conclusions.
A 11.925 2 5.9627 19.49 0.001 11.313 19.85 Yes
B 3.497 2 1.7486 5.72 0.034 2.885 5.06 Yes
C 7.173 2 3.5866 11.72 0.006 6.561 11.51 Yes
D 0.821 2 0.4106 1.34 0.321 0.209 0.37 No
E 31.430 2 15.7152 51.36 0 30.818 54.08 Yes
Error 2.142 7 0.3060 5.201 9.13
Total 56.989 17 56.989 100.00%
aSS: Sum of Square;bDF: Degree of Freedom;cMS: Mean Square.
Table 9. ANOVA table for SN ratios of X7R products. Factors SSa DFb MSc F P -value Pure sum
of square
Percent
contribution Signicant
A 12.454 2 6.2270 37.84 0 12.125 29.35% Yes
B 2.02 2 1.0100 6.14 0.029 1.691 4.09% Yes
C 5.692 2 2.8460 17.29 0.002 5.363 12.98% Yes
D 1.507 2 0.7535 4.58 0.053 1.178 2.85% No
E 18.481 2 9.2405 56.15 0 18.152 43.94% Yes
Error 1.152 7 0.1646 2.798 6.77%
Total 41.306 17 41.306 100.00%
aSS: Sum of Square;bDF: Degree of Freedom;cMS: Mean Square.
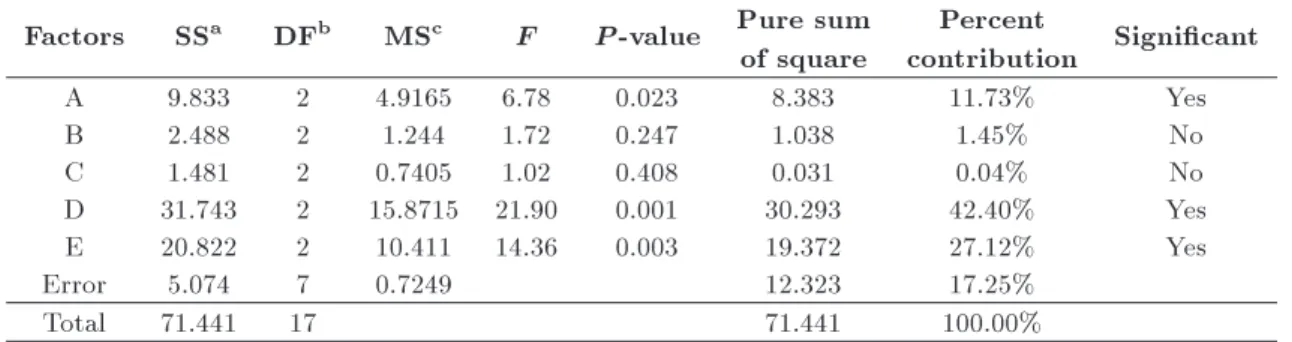
Table 10. ANOVA table for SN ratios of Y5V products. Factors SSa DFb MSc F P -value Pure sum
of square
Percent
contribution Signicant
A 9.833 2 4.9165 6.78 0.023 8.383 11.73% Yes
B 2.488 2 1.244 1.72 0.247 1.038 1.45% No
C 1.481 2 0.7405 1.02 0.408 0.031 0.04% No
D 31.743 2 15.8715 21.90 0.001 30.293 42.40% Yes
E 20.822 2 10.411 14.36 0.003 19.372 27.12% Yes
Error 5.074 7 0.7249 12.323 17.25%
Total 71.441 17 71.441 100.00%
aSS: Sum of Square;bDF: Degree of Freedom;cMS: Mean Square.
Table 11. Results of the conrmation experiment for X5R, X7R and Y5V products. Initial inspection
parameters Optimal inspection parameters Prediction Improvement Experiment Conrmation
X5R
parameters A3B3C3D1E2 A2B1C1D2E2 A2B1C1D2E2 A2B1C1E2
"% 15.6% 9.4% 8.9% 6.2%
SN ratio 16.14 20.54 21.01 19.63 4.4
X7R
parameters A3B2C1D3E1 A1B3C2D2E1 A1B3C2D2E1 A1B3C2E1
"% 15.8% 9.0% 9.1% 6.8%
SN ratio 16.03 20.92 20.81 20.13 4.89
Y5V
parameters A3B2C1D3E1 A2B2C2D3E3 A2B2C2D3E3 A2D3E3
"% 16.4% 8.2% 8.3% 8.2%
very important parameters in reducing the mean error rate and the variation in the error rate, for any MLCC product.
2. ANOVA yields the importance of each control factor as the percentage contribution to the sum of the squares of the variation in the response. For the X5R MLCC, the type of light source con-tributes 54.08%; its brightness concon-tributes 19.85%; the variation ratio of the gray scale of the pixels contributes 11.51%, and the distance between axis and pixels contributes 5.06%. For the X7R MLCC, the respective contributions are 43.94%, 29.35%, 12.98%, and 4.09%. For the Y5V MLCC, the contributions are 42.40% for pixel defective area ratio, 27.12% for the color of light source, and 11.73% for the brightness of the light source.
3. The optimal parameter combination for inspecting X5R is a green light source, a light source brightness of 120 lm, a pixel gray scale variation ratio of ten, and an axis-pixel distance of ten pixels. The optimal parameter combination for inspecting X7R is a red light source, a light source brightness of 100 lm, a pixel gray scale variation ratio of 20, and an axis-pixel distance of 20 pixels. The optimal parameter combination for inspecting Y5V is a blue light source, a light source brightness of 120 lm, and a pixel defective area ratio of 10%.
4. The error rate of optical inspection is reduced from 16% to 7.07%, corresponding to a reduction of 44%. References
1. Kim, E.Y., Lee, J.C. and Kim, B.S. \Leaching be-havior of nickel from waste multi-layer ceramic capac-itors", Hydrometallurgy, 86, pp. 89-95 (2007). 2. Yang, T., Kuo, Y. and Chang, I. \Tabu-search
simu-lation optimization approach for ow-shop scheduling with multiple processors - A case study", International Journal of Production Research, 42, pp. 4015-4030 (2004).
3. Yang, T., Kur, Y. and Cho, C. \A genetic algorithms simulation approach for the multi-attribute combinato-rial dispatching decision problem", European Journal of Operational Research, 176, pp. 1859-1873 (2007). 4. Kuo, Y., Yang, T., Cho, C. and Tseng, Y.C. \Using
simulation and multi-criteria methods to provide ro-bust solutions to dispatching problems in a ow shop with multiple processors", Mathematics and Comput-ers in Simulation, 78, pp. 40-56 (2008).
5. Cho, H.S., Cho, S., Jo, J., Seo, H., Kim, B. and Yoo, J. \Highly reliable processes for embedding discrete passive components into organic substrates", Micro-electronics Reliability, 48, pp. 739-743 (2008). 6. George, P.M., Pillai, N. and Shah, N. \Optimization
of shot peening parameters using Taguchi technique",
Journal of Materials Processing Technology, 153-154, pp. 925-930 (2004).
7. Macodiyo, D.O. and Soyama, H. \Optimization of cavitation peening parameters for fatigue performance of carburized steel using Taguchi methods", Journal of Materials Processing Technology, 178, pp. 234-240 (2006).
8. Hung, Y.H., Huang, M.L. and Chang, C.H. \Optimiz-ing the controller IC for micro HDD process based on Taguchi methods", Microelectronics Reliability, 46, pp. 1183-1188 (2006).
9. Nalbant, M., Gokkaya, H. and Sur, G. \Application of Taguchi method in the optimization of cutting param-eters for surface roughness in turning", Materials and Design, 28, pp. 1379-1385 (2007).
10. Chou, C.Y., Chen, C.H., Yang, C.C. and Wu, C.C. \Application of bivariate parameter design to the opti-mization of the operating conditions of a turning pro-cess", International Journal of Production Research, 43, pp. 5229-5240 (2005).
11. Kim, S.M., Park, K.S., Kim, K.D., Park, S.D. and Kim, H.T. \Optimization of parameters for the synthe-sis of bimodal Ag nanoparticles by Taguchi method", Journal of Industrial and Engineering Chemistry, 15, pp. 894-897 (2009).
12. Tzou, G.J., Tsao, C.C. and Lin, Y.C. \Improvement in the thermal conductivity of aluminum substrate for the desktop PC Central Processing Unit (CPU) by the Taguchi method", Experimental Thermal and Fluid Science, 34, pp. 706-710 (2010).
13. Ozcelik, B. \Optimization of injection parameters for mechanical properties of specimens with weld line of polypropylene using Taguchi method", International Communications in Heat and Mass Transfer, 38, pp. 1067-1072 (2011).
14. Yiamsawas, D., Boonpavanitchakul, K. and Kang-wansupamonkon, W. \Optimization of experimental parameters based on the Taguchi robust design for the formation of zinc oxide nanocrystals by solvothermal method", Materials Research Bulletin, 46, pp. 639-642 (2011).
15. Lin, C.S., Shih, S.J., Lu, A.T., Hung, S.S. and Chiu, C.C. \The quality improvement of PI coating process of TFT-LCD panels with Taguchi methods", Optik, 123, pp. 703-710 (2012).
16. Bilici, M.K. \Application of Taguchi approach to optimize friction stir spot welding parameters of polypropylene", Materials and Design, 35, pp. 113-119 (2012).
17. Tan, O., Zaimoglu, A.S., Hinislioglu, S. and Altun, S. \Taguchi approach for optimization of the bleeding on cement-based grouts", Tunnelling and Underground Space Technology, 20, pp. 167-173 (2005).
18. Tzeng, C.J., Lin, Y.H., Yang, Y.K. and Jeng, M.C. \Optimization of turning operations with multiple performance characteristics using the Taguchi method and grey relational analysis", Journal of Materials Processing Technology, 209, pp. 2753-2759 (2009).
(2006).
20. Wang, T.Y. and Huang, C.Y. \Improving forecasting performance by employing the Taguchi method", Eu-ropean Journal of Operational Research, 176, pp. 1052-1065 (2007).
21. Ross, P.J., Taguchi Techniques for Quality Engineer-ing, 2nd Ed. McGraw-Hill: New York (1996).
22. Yang, H. and Tarng, Y.S. \Design optimization of cutting parameters for turning operations based on the Taguchi method", Journal of Materials Processing Technology, 84, pp. 122-129 (1998).
Biographies
Chin-Chun Wu received her PhD degree from the College of Management at the National Yunlin
Uni-decision analysis, quality engineering, statistics and mathematical economics.
Tai-Sheng Su received a PhD degree in Industrial Engineering and Management from the National Chiao Tung University, Taiwan, and is currently Assistant Professor in the Department of Industrial Management at the National Pingtung University of Science and Technology, Taiwan, ROC. His research areas include production management, operations management, and logistics management. He has published articles in these areas in various national and international jour-nals, including Computers and Industrial Engineering, International Journal of Production Research, Journal of the Operational Research Society, and Journal of the Chinese Institute of Industrial Engineers.