7
July 2
01
4
Some College, No Degree:
A National View of Students
with Some College Enrollment,
Some College, No Degree: A National View of Students with Some College
Enrollment, but No Completion
Over the past 20 years, more than 31 million students have enrolled in college and left without receiving a degree or certificate. Almost one-third of this population had only a minimal interaction with the higher education system, having enrolled for just a single term at a single institution. Signature Report 7 examines the "some college, no degree" phenomenon to better understand the value of some college in its own right and as well as the contribution the "some college, no degree" population can make to achieving college completion goals.
Suggested Citation: Shapiro, D., Dundar, A., Yuan, X., Harrell, A., Wild, J., Ziskin, M. (2014, July). Some College, No Degree: A National View of Students with Some College Enrollment, but No Completion (Signature Report No. 7). Herndon, VA: National Student Clearinghouse Research Center.
Table of Contents
About This Report
Executive Summary
Introduction
o Research on Students with Some College and No Completion o Returns to Postsecondary Education
o Adult Learners
o National Data and Outreach Initiatives o What to Find in the Report
o A Note on the Data Results
o Supplemental Feature: Educational Pathway Differences between Completers and Potential
Completers
o Discussion
NOTE: Please ignore the “Click to Enlarge” instructions next to the figures. This option only works in the online version of the report, which is available at http://nscresearchcenter.org/.
About This Report
AUTHORS
National Student Clearinghouse Research Center Doug Shapiro
Afet Dundar
Project on Academic Success, Indiana University Xin Yuan
Autumn T. Harrell
Justin C. Wild
Mary B. Ziskin ACKNOWLEDGEMENTS
The authors gratefully acknowledge Vijaya Sampath from the National Student Clearinghouse Research Center for her extensive work to prepare the data for analysis and the members of the Project on Academic Success team Don Hossler, Youngsik Hwang, Sarah Martin and Phoebe K. Wakhungu for their efforts, comments, and suggestions that were extremely important to the development of the report.
SPONSOR
This report was supported by a grant from the Lumina Foundation. Lumina Foundation, an Indianapolis-based private foundation, is committed to enrolling and graduating more students from college — especially 21st century students: low-income students, students of color, first-generation students and adult learners. Lumina's goal is to increase the percentage of Americans who hold high-quality degrees and credentials to 60 percent by 2025. Lumina pursues this goal in three ways: by identifying and supporting effective practice, through public policy advocacy, and by using our communications and convening power to build public will for change. For more information, log on to www.luminafoundation.org.
questions about the characteristics and postsecondary education enrollment patterns of this population: What types of colleges did they attend? How long has it been since they last enrolled? How much college have they actually completed?
This report was able to identify the some college, no degree population by tapping a unique database of
enrollment and degree records from the National Student Clearinghouse, rather than the traditional method of conducting surveys of a representative sample of adults. The Clearinghouse data allowed us to dig deeper into the "some college" phenomenon, exclude those who earned degrees or certificates, and analyze in detail the
enrollment pathways of this former student population.
Almost one-third of this population had only a minimal interaction with the higher education system, having enrolled for just a single term at a single institution. For those who had completed at least two terms of enrollment, these pathways often involved non-traditional patterns, such as stopping out, enrolling part time, enrolling at older ages (well after completing high school), and enrolling at multiple institutions. This report's major focus is this latter group: the population for whom we identified more than one enrollment record. These multiple-term enrollees proved to have diverse pathways through higher education, many extending over years and across institutions, that may offer insights for educators and policy makers who, with better understandings of these students, may be able to improve programs and services to better meet their needs in the future. We also made another selection of students who had at least two full academic years' worth of college, whom we called potential completers, recognizing that for most students this would be significant progress toward a two-year credential and half-way to the four-year baccalaureate.
The report provides descriptions of each of these two groups including the age and gender distributions and examines their enrollment pathways including the followings:
Institutional sector(s) in which students enrolled (e.g., exclusively two-year institutions, exclusively four-year institutions, mixed-sector enrollment including both two-four-year institutions and four-four-year
institutions)
Number of institutions in pathway (i.e., number of institutions attended during the study period)
Length of pathway between first and last term enrollment
Number of stop-outs
Years since last enrollment
The supplemental feature examines enrollment patterns of potential completers, comparing them to a sample of students who completed degrees or certificates during the study period. The results presented in the supplemental feature figures compare the two groups on three characteristics: (a) age at last enrollment by the number of institutions students in pathway, (b) number of stop-outs, and (c) length of pathway.
Not surprisingly, the number of stop-outs and the length of pathway were positively related. For example, among multiple-term enrollees with one year or less time elapsed from the first to last enrollment, nearly 90 percent did not stop out at all. In contrast, among those whose enrollments spanned 10 years or more, almost all had at least one stop-out and more than two-thirds (71.2 percent) had two or more stop-outs.
Over half (60.6 percent) of multiple-term enrollees were under 30 years old, including 40.3 percent who were younger than 24 at the time of their last enrollment. A similar proportion (39.4 percent) were 30 years old or older. Only slightly over a quarter of multiple-term enrollees attended four-year institutions exclusively, with over half of them (56.3 percent) attending two-year institutions exclusively and 16.6 percent attending both two- and four-year institutions.
About three-quarters of multiple-term enrollees having attended two-year institutions either exclusively, or before or after attending a four-year institution, reflect the multiple missions of two-year institutions in the nation’s postsecondary education system. This also may represent a variety of student intentions that may include an intention to pursue a degree or seek alternative credentials.
One-third of the multiple-term enrollees attended two or more institutions on their pathway, potentially complicating their return to complete a degree as they may need to transfer their credits from more than one institution.
Potential Completers
Potential completers in this report, are former students who have two or more years’ worth of progress, potentially toward degree completion. These students are a more cohesive group, with more recent enrollments, and are the most relevant to current policy discussions centered on the completion agenda.
Overall, men represent a slightly smaller group among potential completers (1,647,347) compared to women (1,890,769) and more men are in younger age groups than women: 64 percent of the men were under 30 in December 2013, compared to 54 percent of the women. In general, the most common type of potential completer is age 24-29 and has been out of the postsecondary education system for two to six years, as of December 2013. There are about 600,000 women and 630,000 men in this category.
For 17 percent of potential completers, seven or more years has elapsed since their last enrollment. Among those over 30 years old, the figure is 25 percent. This has high policy relevance, especially with regard to designing outreach and recruitment approaches to reach the greatest numbers of potential completers.
In contrast to the results shown for the multiple-term enrollee group, potential completers enrolled quite evenly across different institutional sectors, as defined in this report. The data show that potential completers followed various pathways: enrolling in two- or four-year institutions exclusively or, almost as prevalently, in both (mixed-sector enrollment). This has implications for institutions and policy makers as they work to identify and
Figure A. Potential Completers: Institutional Sector 2003-2013 (N=3,913,918)
Among potential completers, most attended only one (45.6 percent) or two institutions (36 percent). Not surprisingly, greater time elapsed between the first and last enrollment of potential completers who attended more than one institution (see Figure B).
Figure B. Potential Completers: Number of Institutions in Pathway by Length of Pathway (N=3,910,859)
More than one in four potential completers (25.7 percent) enrolled continuously or intermittently for seven years or longer. While 38.1 percent enrolled continuously or on-and-off over three years or less, a similar percentage (36.3 percent) spread their enrollments over four to six years. These results suggest that standard cutoffs for measuring student graduation rates (typically 150 percent of program length) are inadequate: significant numbers of students continue to make substantial progress toward a credential for many years longer.
Students who had enrollments for fewer years tended to persist without any stop-outs. For example, for students who only enrolled for two to three years, 70.6 percent had no stop-outs until the end of the study period whereas nearly one-quarter (24.4 percent) of students who enrolled over the course of 10 years or more had no stop-outs up to their last enrollment.
completers (32.3 percent). Equally important is the observation that potential completers had a higher proportion (17.3 percent) of students with three or more stop-outs, compared to completers (7.1 percent) (see Figure C).
Figure C. Comparison of Potential Completers(N=5,487,543) and Completers (N=1,858,868):
Number of Stop-Outs
In general, the pathway time length for potential completers is longer than for completers. The pathway for a large majority (81.2 percent) of completers was six years or less, compared to 64.4 percent of potential completers. At 42.2 percent, completers also represented the highest proportion of students whose pathway spanned four to six years between first and last enrollment, compared to slightly over a third for potential completers.
IMPLICATIONS FOR POLICYMAKING
Though we are careful to note that the data in this report reveal that the population of students with some college, no degree is diverse, we also recognize that the data reveal where similarities exist within this population and its
For current students, institutional policy makers can use these data to better inform students of the relationship between the increased number of stop-outs and longer pathways, which potentially lead to non-completion. And they can encourage students to find ways to remain enrolled, if they wish to complete a degree within a shorter time frame.
Finally, potential completers' sector enrollment was equally divided between exclusive enrollments in two- and four-year institutions, while nearly the same proportion enrolled in both sectors during their pathway. Therefore, each sector could develop policies and programs directed at distinct subgroups of returning students, considering the information needs regarding credit transfer agreements, course revalidation, and evening and weekend courses.
Many of the implications for institutions discussed above are important for public policymakers to note as well. However, perhaps one of the most important findings in this report is the near equal proportions of potential completers who have enrollment histories in two- or four-year institutions exclusively or both. Returning to the relationship between students who have two or more years' worth of progress toward a degree and the college completion agenda, these data suggest that policymakers should ensure that both types of institutions are supported in their efforts to recruit students who are familiar with their type of institution.
Introduction
Over the past twenty years, more than 31 million students have enrolled in college and left without receiving a degree or certificate, yet relatively little is known about this population. Using national data on their enrollments over time and across institutions this report seeks to answer some important questions about the characteristics and postsecondary education enrollment patterns of this population. What types of colleges did they attend? How long has it been since they last enrolled? How much college have they actually completed?
The report is designed to inform the higher education community, including students, institutions, and policymakers, with new knowledge that may help in understanding the scale and patterns of college
non-persistence and stop out, the potential value to individuals of some college in its own right, perhaps without ever seeking a degree, and also the potential contribution that efforts to re-engage the some college, no degree population can make to achieving college completion goals.
National goals for increasing the level of college attainment among adults are central to current U.S. education policy discussions both because of their importance to educational opportunity and social equity, and for their importance to economic competitiveness. (Bailey, Crosta, & Jenkins, 2013; Blumenstyk, 2013; Jaschik, 2013; Lewin, 2013; Obama, 2009). Yet, these college completion goals may not be achieved by only enrolling and
earned significant numbers of credits towards a degree already, but have not, for whatever reason, completed a degree or certificate. Characterizing students in this group as "near-completers," many organizations are now encouraging a national effort to reach out to and facilitate re-enrollment and degree completions for this group. RESEARCH ON STUDENTS WITH SOME COLLEGE AND NO COMPLETION
Much of what we know about college students generally comes from the postsecondary institutions directly. They know their students well during the time the students spent on campus, but typically do not know what happens after they leave the campus, including whether those who left without a degree ever transferred and completed a credential somewhere else. Thus, information on the some college, no degree population primarily derives from Census survey data, according to which, about one-fifth (21.3 percent) of the national population 25 years and over have some college experience, but no degree compared to over one-third of the adult population (36.2 percent) who have an associate's degree or higher. While the Census data provide demographic information such as age, gender and race, it does not address critical questions such as how much college was completed, how long ago, and at what types of institutions.
Going beyond basic facts about the population, there are three relevant areas of research that help to frame the issues at the center of this report. First, we examine recent research on economic returns to postsecondary education. Second, because most U.S. adults with some college and no completion are adult learners (age 24 or older), we examine findings from studies specifically about adult college students to gain insight into this population. Finally, we explore the wide-ranging projects that have emerged recently throughout the country aimed at recruiting or re-engaging near-completers, and encouraging them to finish a postsecondary credential. RETURNS TO POSTSECONDARY EDUCATION
Research on the returns to postsecondary education shows economic gains associated with all levels of college enrollment, regardless of whether it leads to completing a degree (Bahr, 2014; National Center for Education Statistics, 2012). Nevertheless, studies show that such gains are greater for those who complete degrees. According to a College Board report, earning a bachelor's degree increased median annual earnings by $16,100 compared to those with some college, no degree among those working full time ($56,500 and $40,400, respectively, Baum et al., 2013, p. 11). U.S. adults who have completed postsecondary credentials also have documented advantages in employer health insurance and pension coverage (Baum et al., 2013; Belfield & Bailey, 2011). In a review of literature exploring benefits of community college enrollment, Belfield and Bailey (2011) found that the vast majority of studies in this area reported income gains associated with attending a two-year college, and the financial returns increased along with the number of credit hours completed. Similarly, in a study on community college students in Kentucky, Jepsen, Troske, and Coomes (2014) found that completing college courses — even without subsequent degree completion — increased earnings, but that both associate's degrees and certificates of completion yielded greater income returns for students. The findings of a report by Gladieux and Perna (2005) using data on first-time freshmen who enrolled in postsecondary education in 1995-1996, showed
Unemployment rates for adults age 25 and older decrease with higher education attainment as well. Smaller proportions of U.S. adults with some college experience were found to be unemployed compared to high school graduates, but those with an associate's or bachelor's degree showed even lower unemployment rates (Snyder & Dillow, 2011).
ADULT LEARNERS
Most research on adult learners focuses on prior learning assessment (CAEL, 2008), the complexity of balancing school with job and family obligations (Goldrick-Rab & Sorensen, 2010; Kasworm, 2010), or state policy and institutional practices that support adult learners' success while they are enrolled (Boeke, Zis, & Ewell, 2011; Robinson & Lakin, 2007).
Fewer studies focus on the pathways and needs of those who were previously enrolled in college, but left without a credential and are no longer attending postsecondary education. Most adult students have many responsibilities competing for their time (Kasworm, 2010; Ross-Gordon, 2011) and college completion can be seen as an
additional burden. In a study of adults who were considering returning to complete their postsecondary education, Hagelskamp, Schleifer and DiStasi (2013) found that many had poor information about the college-going process, including what factors to consider when selecting a program and institution, and many likewise lacked information on the benefits of degree completion.
NATIONAL DATA AND OUTREACH INITIATIVES
As a part of the focus on college completion framed by the Lumina Foundation, College Board, Complete College America, and other national groups, several state-level and multi-state efforts have emerged focusing specifically on outreach to students who have some college credit but no credential. Initiatives, such as the Adult College Completion Network and Project Win-Win, have drawn effectively on research on adult learners. The research produced as a result of these new initiatives has had to break new ground in identifying this pivotal some college, no degree population.
Project Win-Win, a multi-year collaboration of the Institute for Higher Education Policy (IHEP) and the State Higher Education Executive Officers (SHEEO), is a prominent and instructive example of this kind of effort. Project Win-Win worked with 61 institutions that award associate's degrees in nine states (Florida, Louisiana, Michigan, Missouri, New York, Ohio, Oregon, Virginia, and Wisconsin) to identify and reach out to adults who had accrued significant college credit without completing a degree. The students were grouped into two categories: "students whose records qualified them for degrees, but who never received those degrees" and "students whose records indicated that they were within striking distance of an associate's award" (Adelman, 2013, p.4). Of the 41,689 students identified as eligible for degree, 6,733 were able to receive the associate's degree and another 2,076 expressed interest in returning to complete the degree. These numbers represent a 16
percentage point increase in associate's degrees awarded by the participating states, growth that the project's collaborators characterized as a "considerable down payment" on national college completion goals (p. 10).
including identifying the "universe" of former students who met the basic criteria in the first place, awarding degrees to those who were eligible, and contacting potential completers for re-enrollment. The research presented here extends the work of these single and multi-state projects by offering a national view informed by 20 years of longitudinal student-level data.
WHAT TO FIND IN THIS REPORT
This report describes students who have enrolled in college at some point in the past 20 years, left without receiving a degree or certificate, and have not re-enrolled in the past year and a half. After exploring the enrollment patterns of the overall group, termed some college, no degree, we then narrow our focus to two key subgroups of interest, and organize our findings on these groups in two main sections:
Potential re-entry students: Students with no degree or certificate, but who have two or more enrollment records. For the purposes of this report, we have called this group "Multiple-term Enrollees."
Students with substantial, recent college enrollment: Students with no degree or certificate, but who have the equivalent of two or more years’ worth of progress. For the purposes of this report, we have called this group "Potential Completers."
In the results section and appendices that follow, we explore and describe selected characteristics of each group, breaking results out by gender, age at last enrollment, and age at the end of the study period. In addition, we present results describing students' enrollment pathways, focusing on a number of key features and experiences including: (1) number of institutions attended, (2) the types of institution(s) attended (two-year institutions, four-year institutions or both), (3) the number of stop-outs, (4) the length of pathway, and (5) four-years since last
enrollment.
In addition, we have included a supplemental feature comparing potential completers with a sample of students who did complete a degree or certificate in the same period potential completers were enrolled in college. For this analysis, we compare the completers and potential completers on three key points: (1) number of institutions attended by age at last enrollment, (2) number of stop-outs, and (3) the length of pathway (or total elapsed time between the first and last enrollment).
A NOTE ON THE DATA
Data Source
The data for this report were drawn from the StudentTrackerSM and DegreeVerifySM services, administered by the
National Student Clearinghouse® (the Clearinghouse), which tracks 96 percent of college enrollments nationwide
Cohort Definition
The study focused on the cohort of students who had at least one enrollment record at U.S. colleges and
universities after January 1, 1993, with no enrollment records between August 13, 2012, and December 31, 2013, and no degree or certificate through December 31, 2013.
Because the study was intended to describe students who had left postsecondary education, those who had any enrollment records beginning on or after August 13, 2012 were considered "still enrolled" and excluded from the study.
For this report, the Clearinghouse and the Project on Academic Success (PAS) balanced competing priorities in selecting a method for identifying the study cohort. On one hand, Clearinghouse data allowed the researchers to capture a unique headcount of students nationally and, therefore, to follow individual students across multiple sequential enrollments, while also accounting for concurrent enrollments at more than one institution at the same time. On the other hand, there are some limitations with the method for identifying the study cohort in this report.
The institutions participating in the Clearinghouse Enrollment Reporting service (i.e. providing the data coverage) do not comprise 100 percent of all institutions for any individual year. Data coverage has grown steadily over the years examined in this study, which likely resulted in an underestimation of the study's overall cohort size, particularly among students who may have enrolled in the earlier years at institutions not covered by the Clearinghouse at that time. It should also be noted that student enrollments at institutions outside of the U.S. were not included. Moreover, the total coverage rate in the degree data is also not 100 percent, meaning that a small number of students included in the study will likely have had a degree or certificate from a
Results
Figure 1. Some College, No Degree by Enrollment Pathway
*This figure is based on data shown in Appendix B, Table 1.
Figure 1 divides the full population (31,458,482) of students with some college, no degree into those who
attended only one term (N=10,036,274) and those who have completed more than one term (N=21,422,208). The latter group is further divided into those students with at least two terms of enrollment (N=17,508,166) and a group we refer to as potential completers (N=3,914,042). Potential completers are those students with two or more years’ worth of progress between August 11, 2003, and December 31, 2013.
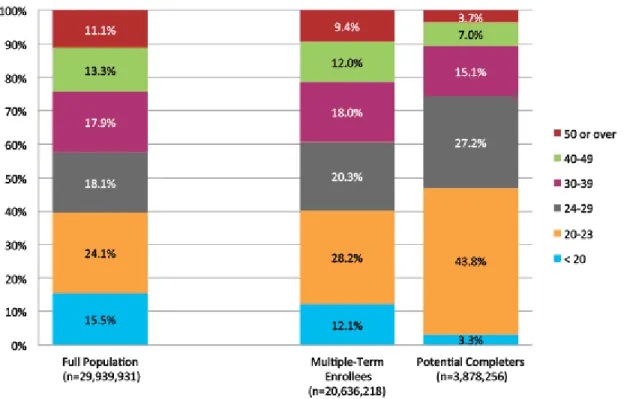
Figure 2. Some College, No Degree by Age at Last Enrollment (N=29,939,931)
*This figure is based on data shown in Appendix B, Table 2.
Note: Students with age data missing were excluded from the above figure.
Figure 2 shows students' age at their last term of enrollment. The distribution of age ranges at students' last enrollment was different for potential completers than for the full population and multiple-term enrollees. For example, while three-quarters of potential completers were under age 30 at the time of their last enrollment, 57.7 percent of the full population and 60.6 percent of multiple-term enrollees were under age 30. Similarly, only 10.7 percent of potential completers were age 40 or over while 24.4 percent of the full population and 21.4 percent of multiple-term enrollees were in this age range.
Figure 3. Some College, No Degree by Gender (N=28,195,165)
*This figure is based on data shown in Appendix B, Table 3.
Note: Students with gender data missing were excluded from the above figure.
Figure 3 presents some college, no degree population by gender. Gender distribution across all three groups was very similar with slightly more than half of the students being women in each group.
Figure 4. Some College, No Degree by Institutional Sector (N=30,741,449)
*This figure is based on data shown in Appendix B, Table 4.
Note: Students with institutional sector data missing were excluded from the above figure
Figure 4 shows the institutional sector of enrollments across the study period for the full population with some college, no degree, as well as for the two subset groups, multiple-term enrollees and potential completers. Well over half of the full population enrolled exclusively in two-year institutions throughout the study period (62.5 percent). Multiple-term enrollees showed a similarly high distribution, with 56.3 percent having attended two-year institutions exclusively. However, potential completers were more evenly distributed, with an equal
percentage (35.6 percent) enrolling exclusively in four-year institutions and exclusively in two-year institutions. In addition, a larger proportion (28.8 percent) of the potential completers showed mixed sector pathways, enrolling in both two- and four-year institutions throughout the study period, compared to only 16.6 percent of multiple-term enrollees.
Figure 5. Multiple-Term Enrollees: Age in December 2013 by Gender (N=18,549,543)
*This figure is based on data shown in Appendix B, Table 5.
Figure 5 shows the distributions of multiple-term enrollees by age as of December, 31 2013 (the end of the study period) for women and men. A higher proportion of men than women were in the three younger age groups (with a total of 59.6 percent of men versus 51.2 percent of women). Forty percent of women were 40 or older, as opposed to less than third of men (30.3 percent).
Figure 6. Multiple-Term Enrollees: Institutional Sector 1993-2013 (N=21,334,851)
*This figure is based on data shown in Appendix B, Table 6.
Note: Summer terms excluded when considering institutional sector.
Figure 6 displays a representation of the institutional sectors that multiple-term enrollees were enrolled in between 1993 and 2013. Over half of this group (56.3 percent) enrolled exclusively in two-year institutions. A little over a quarter (27.2 percent) enrolled exclusively in four-year institutions and 16.6 percent enrolled in both two- and four-year institutions. The prevalence of enrollment in two-year institutions exclusively likely reflects the scope and multiple missions of two-year institutions in the nation's postsecondary education system. Results may point to possible implications for recruiting returners from this group, as well. Knowing that more than half of this group has experience exclusively with two-year institutions, two-year institutions, for example, may have a
Figure 7. Multiple-Term Enrollees: Institutional Sector by Age in December 2013 (N=20,556,269)
*This figure is based on data shown in Appendix B, Table 7.
Note: Summer terms excluded when considering institutional sector.
Figure 7 presents the distribution of multiple-term enrollees by institutional sector across age groups, as of December 2013. The distribution across age groups held the same pattern as the whole of multiple-term enrollees. Across all age groups, more than half of multiple-term enrollees enrolled exclusively at two-year institutions with the highest proportions being in age groups younger than 24 and 50 or over (61.2 percent and 62.9 percent, respectively).
Considering the percentage of students who attended two-year institutions exclusively, alongside those who had enrollments in both sectors, the prevalence of two-year institutions in postsecondary education is evident.
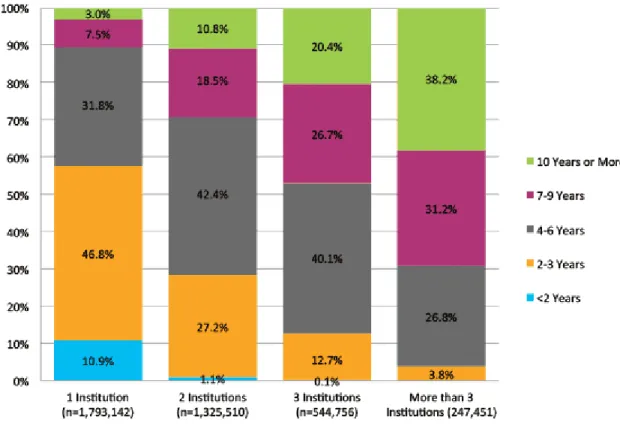
Figure 8. Multiple-Term Enrollees: Number of Institutions in Pathway by Age at Last Enrollment (N=20,636,218)
*This figure is based on data shown in Appendix B, Table 8.
Figure 8 shows the distribution of multiple-term enrollees by the number of institutions within the pathway for each age group. For this analysis, age groups were based on students' age at their last enrollment. Across all age groups a sizable proportion of students attended more than one institution with the highest proportion occurring among students between 24 and 29 years (45.4 percent). Among students who were between 30 and 39 years at their last enrollment, 37.9 percent attended more than one institution, followed by 35.3 percent in the 20- to 23-years-old age group.
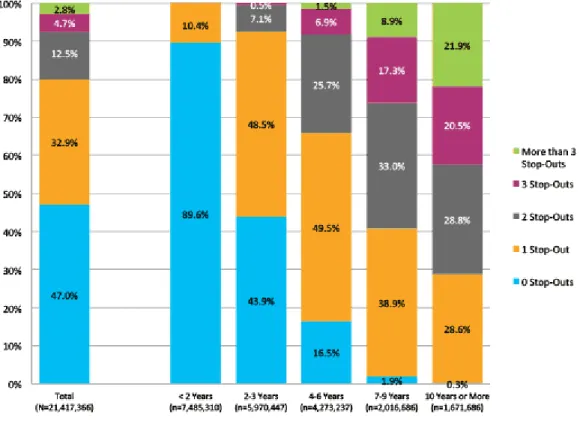
Figure 9. Multiple-Term Enrollees: Length of Pathway (N=21,417,366)
*This figure is based on data shown in Appendix B, Table 9.
Figure 9 presents the length of students' pathway, in years, between their first and last term of enrollment. About one-third of these students (34.9 percent) began and ended their postsecondary study in less than two years. A little over one-quarter (27.9 percent) enrolled in courses for two to three years and one-fifth (20.0 percent) enrolled over the course of four to six years. A similar percentage of students enrolled for longer periods, 9.4 percent of students enrolled for seven to nine years and 7.8 percent enrolled 10 years or more.
Figure 10. Multiple-Term Enrollees: Number of Stop-Outs by Length of Pathway (N=21,417,366)
*This figure is based on data shown in Appendix B, Table 10.
Note: Students may show a duration of one year or less due to concurrent enrollment at separate institutions.
Figure 10 shows the distribution of multiple-term enrollees by number of stop-outs over the length of pathway. Not surprisingly, only one in 10 (10.4 percent) of the students whose pathway length was less than two years had one stop-out during that time while the majority, 89.6 percent, did not stop out at all. Alternatively, for students who showed enrollments over a span of 10 years or more, almost all of them had at least one stop-out with more than two-thirds (71.2 percent) having two or more stop-outs.
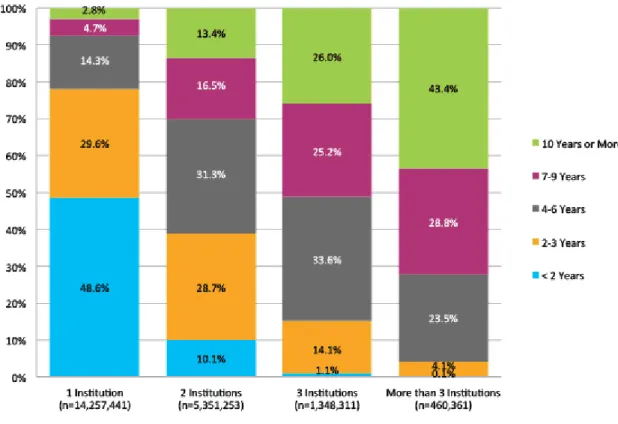
Figure 11. Multiple-Term Enrollees: Length of Pathway by Number of Institutions in Pathway (N=21,417,366)
*This figure is based on data shown in Appendix B, Table 11.
Figure 11 shows that nearly two-thirds of multiple-term enrollees (66.8 percent) attended only one institution by the end of the study period. Of those, just under half (48.6 percent) have less than two years between their first and last enrollment records.
Differences in the pathway length and the number of institutions in the pathway show an intuitive pattern, with greater percentages of students who have attended more than one institution also having longer enrollment periods. For example, the pathway length for 43.4 percent of students who attended more than three institutions was 10 years or more, while 78.2 percent of students who attended only one institution had three years or less between their first and last enrollments.
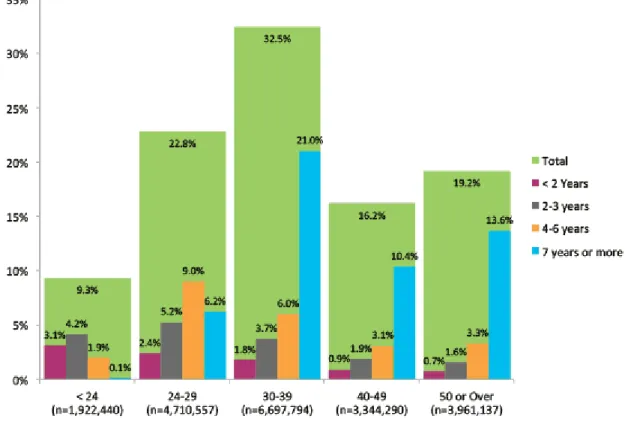
Figure 12. Multiple-Term Enrollees: Age in December 2013 by Years Since Last Enrollment (N=20,636,218)
*This figure is based on data shown in Appendix B, Table 12.
Figure 12 shows age, as of December 2013, against years since last enrollment for multiple-term enrollees. Of those 30 years or older, a majority have been out of higher education for seven or more years. For the younger groups (29 years or younger), many have a shorter pathway length since their last enrollment.
Among the age groups, very few (9.3 percent) are under the age of 24. A greater proportion of the population are between 24 and 29 years old and have been out for three years or less (7.6 percent), while 15.2 percent are between 24 and 29 and have been out of college for four or more years. The greatest proportion of multiple-term enrollees are between the ages of 30 and 39 and have been out of college for seven or more years (21 percent). The next largest proportion of multiple-term enrollees are 50 years or older and have been out of college for seven or more years (13.6 percent), followed by those between 40 and 49 years that have been out of higher education for seven or more years (10.4 percent).
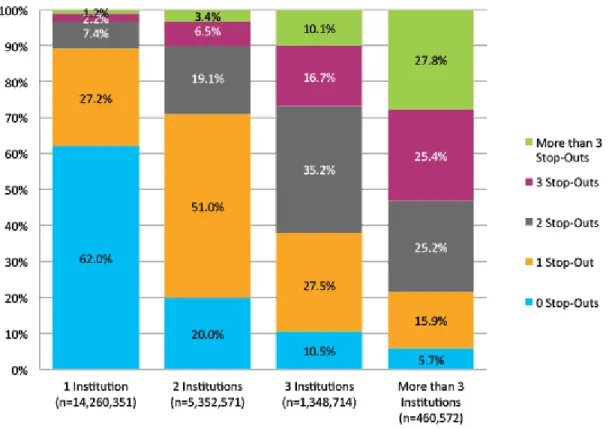
Figure 13. Multiple-Term Enrollees: Number of Stop-Outs by Number of Institutions in Pathway (N=21,422,208)
*This figure is based on data shown in Appendix B, Table 13.
Figure 13 examines the number of stop-outs against the number of institutions in the pathway of multiple-term enrollees. As the number of institutions in the pathway increased, the proportion of students with no stop-outs decreased. For example, of those students who had attended only one institution, a majority (62.0 percent) had no stop-outs while among those who attended two institutions, only 20 percent did not stop out. Just over half (51 percent) of students who had attended two institutions had one stop-out, and nearly one-fifth had two stop-outs (19.1 percent). For those students having attended three institutions, over one-third (35.2 percent) had two outs. Similar proportions of those who attended three institutions had either one out, or three or more stop-outs (27.5 percent and 26.8 percent, respectively). Lastly, of those students having attended more than three institutions, all but a small proportion of them (94.3 percent) had one or more stop-outs. The data show an intuitive pattern across multiple-term enrollees: as the number of institutions in the pathway rose, the percentage
Figure 14. Potential Completers: Gender by Age in December 2013 (N=3,541,117)
*This figure is based on data shown in Appendix B, Table 14.
Figure 14 presents potential completers by their age, as of December 2013, for women and men separately. At the end of the study period, a higher proportion of men (63.7) were 29 or younger than women (53.8 percent). Consequently, while almost one in five women was 40 or over at the end of the study, only a little over one in 10 men was in the same age category. A quarter, or just over, of each gender group, 27.0 percent of women and 25.0 percent of men, were between 30 to 39 years of age.
Figure 15. Potential Completers: Institutional Sector 2003-2013 (N=3,913,918)
*This figure is based on data shown in Appendix B, Table 15.
Note: Summer terms excluded when considering institutional sector
Figure 15 presents potential completers and the institutions they attended. Unlike multiple-term enrollees, more than half of whom attended two-year institutions exclusively, potential completers were evenly divided between exclusive enrollments in either two- or four-year institutions, both at 35.6 percent. However, mixed enrollments in two- and four-year institutions was also high among potential completers (28.8 percent*), and when compared to multiple-term enrollees (16.6 percent).
*Over half of the potential completers with mixed enrollments (56.6 percent) had their last enrollment in a four-year institution.
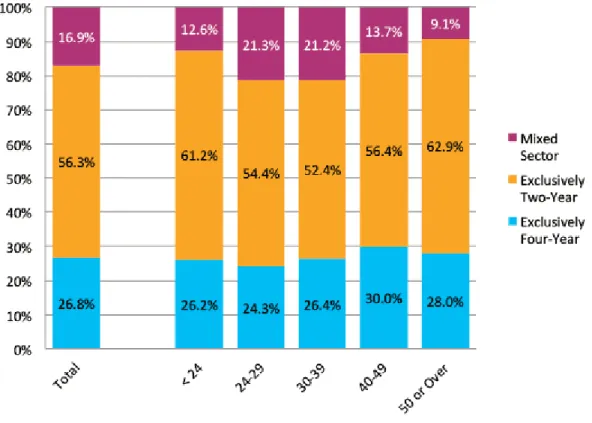
Figure 16. Potential Completers: Institutional Sector by Age in December 2013 (N=3,881,338)
*This figure is based on data shown in Appendix B, Table 16.
Note: Summer terms excluded when considering institutional sector
Figure 16 presents potential completers by the institutional sector they have attended across age, as of December 2013. Of students who were younger than 24 years old, the greatest proportion attended two-year institutions exclusively (41.4 percent), about a third (32.3 percent) have attended four-year institutions exclusively, and just over a quarter (26.3 percent) have mixed sector enrollment between the two types of institutions. Of the older age groups, 40 to 49 years and 50 years or over, each group has students who attended four-year institutions
exclusively in almost equal proportions, 45.5 percent and 45.4 percent, respectively. A greater proportion of the 50 or older age group (39.8 percent) have attended two-year institutions exclusively compared to 35.4 percent of those age 40 to 49 years.
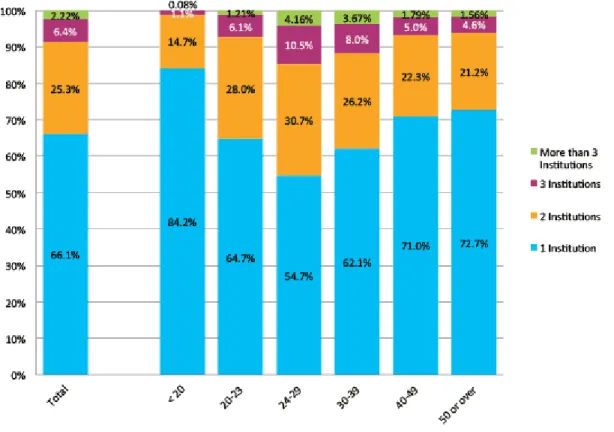
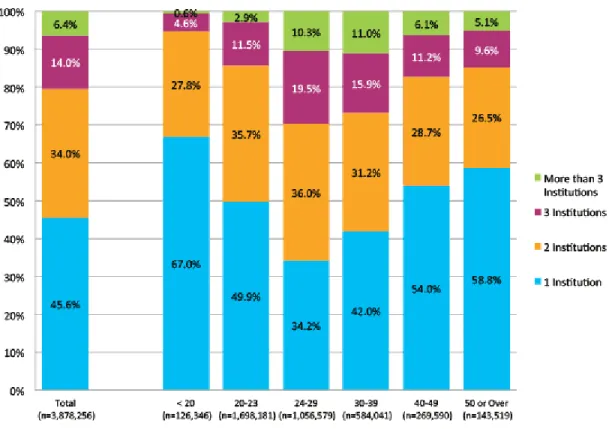
Figure 17. Potential Completers: Number of Institutions in Pathway by Age at Last Enrollment (N=3,878,256)
*This figure is based on data shown in Appendix B, Table 17.
Figure 17 shows interesting patterns when comparing the distributions of potential completers by the number of institutions in the pathway across age groups, based on the age at the last enrollment. In each age group, as well as for all potential completers in total, while the majority attended one or two institutions, a substantial proportion of students attended more than two institutions. Of the total, more than half attended two or more institutions (54.4 percent). The lowest proportion of students who attended more than two institutions was in the youngest population, younger than 20 years at their last enrollment (5.2 percent). This is likely due to the fact that few in this group have had the time to attend multiple institutions. In contrast, for example, almost one-third of the potential completers in age group 24 to 29 years attended more than two institutions in their postsecondary career.
Figure 18. Potential Completers: Length of Pathway (N=3,910,859)
*This figure is based on data shown in Appendix B, Table 18.
Figure 18 shows the distribution of potential completers by pathway length. Over a third of potential completers (36.3 percent) had some enrollment in college classes within a four- to six-year time period. Another third (32.7 percent) started and ended enrollment within two to three years. One-tenth of this population (10.3 percent) were enrolled, at various times, between the beginning and end of the period considered for potential completers in this study.
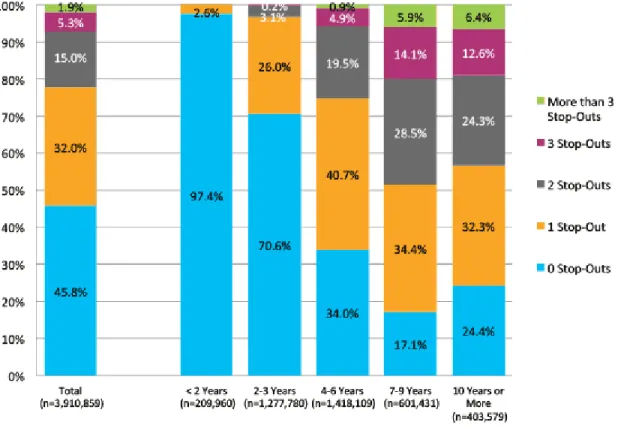
Figure 19. Potential Completers: Number of Stop-Outs by Length of Pathway (N= 3,910,859)
*This figure is based on data shown in Appendix B, Table 19.
Figure 19 presents the distribution of potential completers by the number of stop-outs over the pathway length. Overall, more than half of potential completers had at least one stop-out.
The pathway length was between two to six years for more than two-thirds of potential completers (68.9 percent). However, the majority of those who had enrollments for two to three years only (70.6 percent) had no stop-outs. This percentage dropped to 34.0 percent for those whose pathway length was four to six years. The percentage of those who persisted without any stop-outs decreased further for those who had enrollments for longer times. For example, only about one-quarter (24.4 percent) of students who enrolled over the course of 10 years or more had no stop-outs.
Figure 20. Potential Completers: Number of Institutions in Pathway by Length of Pathway (N=3,910,859)
*This figure is based on data shown in Appendix B, Table 20.
Figure 20 describes the percentages of potential completers by the pathway length broken out by the number of institutions in the pathway. In general, attending more institutions appeared to be associated with an extended time of enrollment for potential completers. For students who have attended only one institution, 78.6 percent of them enrolled in postsecondary education for two to six years, as of December 2013, with 46.8 percent showing a span of enrollment for two to three years and 31.8 percent for four to six years. About one-tenth (10.5 percent) of this group was enrolled for seven or more years.
For students who attended two institutions, 29.3 percent enrolled over a period of seven or more years. Compared to the previous two groups, students who attended three or more institutions were more likely to have enrolled for a longer period. Notably, for students who had attended three institutions about half of them (47.1 percent) enrolled at least seven years. Among those who attended more than three institutions, 38.2 percent had enrolled
Figure 21.1. Potential Completers: Age in December 2013 by Years Since Last Enrollment - Percentage of All Women (N=1,890,769)
*This figure is based on data shown in Appendix B, Table 21.
Figure 21.1 shows the percentages of female potential completers by the number of years since their last
enrollment across all age groups, as of December 2013. More than 40 percent of female potential completers (44.2 percent) were between 24 and 29 years old, as of December 2013, representing the largest age group, followed by 27.1 percent of those who were age 30 to 39 years old. For women across these two age groups, more than one-quarter (27.8 percent) have four to six years since their last enrollment followed by 20.8 percent who have been out of college for two to three years. Based on the size of the subgroups, a typical female potential completer is a woman age 24 to 29 whose last postsecondary enrollment was two to six years before December 2013.
Figure 21.2. Potential Completers: Age in December 2013 by Years Since Last Enrollment - Percentage of All Men (N=1,647,347)
*This figure is based on data shown in Appendix B, Table 21.
Figure 21.2 shows the percentages of male potential completers by years since their last enrollment across all age groups, as of December 2013. Similar to female potential completers, a greater proportion (53.0 percent) of male potential completers was between 24 and 29 years old, as of December 2013, followed by 25 percent who were 30 to 39 years old. Similar to that of the typical female potential completer, a typical male potential completer is a man between 24 and 29 years old who stopped out of college two to six years before December 2013.
Figure 22. Potential Completers: Number of Institutions in Pathway by Length of Pathway (N=3,910,859)
*This figure is based on data shown in Appendix B, Table 22.
Figure 22 shows the number of stop-outs by the number of institutions in the pathway for potential completers. Overall, as the number of institutions attended increased, the percentage of students who experienced greater numbers of stop-outs also increased. Of the students who attended only one institution, over half (63.1 percent) did so without any stop-outs, compared to only one-sixth of students (15.6 percent) who attended more than three institutions.
While there are costs associated with changing institutions, financial costs as well as possible delays in academic progress, it appears students who enrolled in multiple institutions over the course of their career had extended amounts of time off between enrollments. The percentage of students who had two stop-outs or more increased from 11.9 percent for those who attended only one institution to 53.9 percent for students who attended more than
SUPPLEMENTAL FEATURE:
Educational Pathway Differences between Completers and Potential Completers
In this supplemental feature, we expand on the analyses presented throughout the main part of the report. These analyses focus on enrollment patterns shown by a group of potential completers as compared to a sample of students who were awarded a degree or certificate between August 11, 2003, and December 31, 2013
(“Completers”). In this supplemental feature, potential completers are the students who enrolled for at least one term between August 11, 2003, and December 31, 2013, and made two or more years' worth of progress based on
all their enrollment records, even if some of those enrollments occurred before August 11, 20031. Results are
presented in three figures that show: (a) age at last enrollment by the number of institutions on students' postsecondary education pathway (Figure 1), (b) number of stop-outs (Figure 2), and (c) the length of pathway (Figure 3).
1In the main part of the report, two or more years' worth of progress for potential completers were calculated
based only on enrollment records between August 11, 2003, and December 31, 2013. Subsequently, the sample size for potential completers is larger in the supplemental feature than it is in the main part of the report.
Figure S-1. Comparison of Potential Completers(N=5,422,996) and Completers (N=1,848,895): Age at Last Enrollment by Number of Institutions in Pathway
Figure S-1 shows the number of institutions attended by completers and potential completers, grouped by traditional age students (<24) and adult learners (24 and over). Over half of the completers group (51.1 percent) attended only one institution, while in comparison a smaller proportion of potential completers (42.6 percent) followed that pattern. Results demonstrated a similar pattern across two age groups. Both among those who were under age 24 and those who were 24 and over, a higher proportion of completers attended only one institution compared to potential completers.
Attending three or more institutions was more prevalent among potential completers than completers: more than one in five potential completers (22.0 percent) attended three or more institutions, while only 16.1 percent of completers did so. In general, among both completers and potential completers, adult learners enrolled in three or more institutions at greater rates than younger students.
Figure S-2. Comparison of Potential Completers(N=5,487,543) and Completers (N=1,858,868): Number of Stop-Outs
Figure S-3. Comparison of Potential Completers (N=5,484,153) and Completers (N=1,858,361): Length of Pathway
*This figure is based on data shown in Appendix B, Table S-3.
Figure S-3 displays the length of pathway between first and last enrollment for completers and potential
completers. For completers, a large majority (81.2 percent) had a pathway length of six years or less, compared to 64.4 percent of potential completers. For both groups, students with a pathway length of four to six years showed the highest proportions, 42.2 percent for completers and 33.4 percent for potential completers. There were about twice as many potential completers (35.6 percent) compared to completers (18.7 percent) with a pathway length of seven or more years.
Overall, more than half of completers who attended only one institution had no stop-out or spent only six years or less in postsecondary institutions. In comparison, more than half of potential completers attended more than one institution and had at least one stop-out. Also more than one-third of potential completers continued enrolling in postsecondary institutions over seven or more years.
who were awarded a bachelor's degree and below (including associate's degree and certificate) between August 11, 2003, and December 31, 2013. Completers' enrollment records include all their enrollments records occurred before the degree or certificate completion date going back to January 1, 1993.
Discussion
Over the past 20 years, more than 31 million students have enrolled in college and left without receiving a degree or certificate. The size of this population is an indication of the many unique strengths, and some weaknesses, of the American higher education system. It undoubtedly represents the economic value and other rewards that may be attached to completing even a few college courses or terms, and the ability of students to benefit from an increase in skills or competencies even without a formal credential. It also represents the opportunity that many postsecondary courses and programs offer to students preparing for a non-academic credential or an industry certification awarded by a third party outside of the college or university attended. Finally, for many institutions and policy makers, this population represents a new enrollment opportunity, a latent reserve of students who may have already covered a significant distance on the path to a degree and need only a nudge or an opening to pick up where they left off, complete a degree, and add to the nation's stock of educated adults.
This report was able to identify the some college, no degree population by tapping a unique database of
enrollment and degree records from the National Student Clearinghouse, as opposed to the traditional method of surveying a representative sample of adults. The Clearinghouse data allowed us to dig deeper into the "some college" phenomenon, exclude those who earned degrees or certificates, and analyze in detail the enrollment pathways of this former student population.
Almost one-third of this population had only a minimal interaction with the higher education system having enrolled for just a single term. They never returned to their starting institution and never re-enrolled at another institution. This population may be viewed by some as representing the inefficiencies of a poorly aligned
educational system that does not adequately prepare students with the academic skills or resources necessary to succeed. Others might argue that these students are a reminder of the immense opportunity offered by
postsecondary institutions to students of all types, even those whose optimism and ambition may later turn out to have exceeded their determination or academic preparation.
For those who had completed at least two terms of enrollment, these pathways often involved non-traditional patterns, such as stopping out, enrolling part time, enrolling at older ages (well after completing high school), and enrolling at multiple institutions. This report's major focus is this latter group: the population for whom we identified more than one enrollment record. These multiple-term enrollees proved to have diverse pathways
MULTIPLE-TERM ENROLLEES
Just as one-third of all some college, no degree students had only a single term of enrollment, the multiple-term enrollees also had a concentration at the lower end of the range of enrollment pathways: more than one-third (34.9 percent) began and ended their postsecondary enrollments within a single year. At the other end of the range, about one in six, or 17.2 percent enrolled on-and-off for seven years or longer. Not surprisingly, the number of stop-outs and the length of pathway were positively related. For example, among multiple-term enrollees with one year or less time elapsed from the first to last enrollment, nearly 90 percent did not stop out at all. In contrast, among those whose enrollments spanned 10 years or more, almost all had at least one stop-out and more than two-thirds (71.2 percent) had two or more stop-outs.
Over half (60.6 percent) of multiple-term enrollees were under 30 years old, including 40.3 percent who were younger than 24 at the time of their last enrollment. A similar proportion (39.4 percent) were 30 years old or older. Only a slightly over a quarter of multiple-term enrollees attended four-year institutions exclusively with over half of them (56.3 percent) attending two-year institutions exclusively and 16.6 percent attending both two- and four-year institutions.
About three-quarters of multiple-term enrollees having attended two-year institutions either exclusively, or before or after attending a four-year institution, reflect the multiple missions of two-year institutions in the nation's postsecondary education system. This also may represent a variety of student intentions that may include an intention to pursue a degree or seek alternative credentials.
Results may point to possible implications for recruiting returners from this group as well. Knowing that more than half of this group has experience exclusively with two-year institutions, for example, is notable. It may suggest that two-year institutions could have a particular interest and leading role in reaching students who might potentially return.
Our findings provide further insights into the enrollment behaviors of multiple-term enrollees. One-third of the multiple-term enrollees attended two or more institutions on their pathway, potentially complicating their return to complete a degree as they may need to transfer their credits from more than one institution. As the number of institutions in a student's pathway increased, the proportion of students with no stop-out decreased. For example, of those students who had attended only one institution, a majority (62.0 percent) had no stop-outs. Among those who attended two institutions, only 20 percent did not stop out.
POTENTIAL COMPLETERS
For the remainder of the discussion we will focus on potential completers, students who have two or more years' worth of progress, potentially toward degree completion. These students are a more cohesive group, with more recent enrollments, and are the most relevant to current policy discussions centered on the completion agenda.
For 17 percent of potential completers, seven or more years has elapsed since their last enrollment. Among those over 30 years old, the figure is 25 percent. This has high policy relevance, especially with regard to designing outreach and recruitment approaches to reach the greatest numbers of potential completers.
In contrast to the results shown for the multiple-term enrollee group, potential completers enrolled quite evenly across different institutional sectors, as defined in this report. The data show that potential completers followed various pathways: enrolling in two- or four-year institutions exclusively or, almost as prevalently, in both (mixed-sector enrollment). This has implications for institutions and policy makers as they work to identify and
encourage some college, no degree populations to return to college and complete a credential.
Among potential completers, most attended only one (45.6 percent) or two institutions (36 percent). Not surprisingly, greater time elapsed between the first and last enrollment of potential completers who attended more than one institution.
More than one in four potential completers (25.7 percent) enrolled continuously or intermittently for seven years or longer. While 38.1 percent enrolled continuously or on-and-off over three years or less, a similar percentage (36.3 percent) spread their enrollments over four to six years. These results suggest that standard cutoffs for measuring student graduation rates (typically 150 percent of program length) are inadequate: significant numbers of students continue to make substantial progress toward a credential for many years longer.
Students who had enrollments for fewer years tended to persist without any stop-outs. For example, for students who only enrolled for two to three years, 70.6 percent had no stop-outs until the end of the study period whereas nearly one-quarter (24.4 percent) of students who enrolled over the course of 10 years or more had no stop-outs up to their last enrollment.
ANALYSIS OF ENROLLMENT PATHWAYS OF POTENTIAL COMPLETERS AND STUDENTS WHO COMPLETED A DEGREE OR CERTIFICATE
This report's Supplemental Feature compares the enrollment pathways of potential completers to those of students who successfully completed a degree or certificate. Compared to completers, more potential completers attended multiple institutions. Just over half of the completers group (51.1 percent) attended only one institution, while 42.6 percent of potential completers followed that pattern. More potential completers (22 percent) attended three or more institutions than completers (16.1 percent).
The findings also showed that among both completers and potential completers, older students enrolled in multiple institutions at greater rates than younger students. The proportion of potential completers who had one or more stop-outs was higher than that of completers. About twice as many completers (59.7 percent) had no stop-outs up to their last enrollment, compared to potential completers (32.3 percent). Equally important is the observation that potential completers had a higher proportion (17.3 percent) of students with three or more
stop-or mstop-ore stop-outs. Intuitively, both results combined would suggest that higher number of stop-outs could probably result in a longer pathway length between the first and last enrollment.
IMPLICATIONS FOR POLICYMAKING
The findings in Signature Report 7 support the idea of incorporating students with some college, no degree into the current college completion agenda. This report focuses on two specific subsets of this population: multiple-term enrollees and potential completers. Research on higher education often focuses on students who researchers have access to, namely students enrolled during the data collection phase of research (for a notable exception, see the report on Project Win-Win Adelman, 2013). By contrast, this report describes the population of students who have some experience with college, but have stopped out of postsecondary education and are not currently enrolled. We look at their demographic and enrollment characteristics to suggest how policies can help provide incentives for these students to finish their degree. Within each subset of the students with some college, no degree, we look at characteristics (including gender, age at the end of enrollment, and age as of December 2013), institutional sector enrollments, number of institutions in pathway, pathway length, number of stop-outs, and years since last enrollment, as well as cross-sections of those characteristics.
These characteristics have potential policy implications for both institutional and public policies. Though we are careful to note that the data in this report reveal that the population of students with some college, no degree is diverse, we also recognize that the data reveal where similarities exist within this population and its subsets.
Institutional Policy Implications
Institutions can track their own former students examining their enrollment pathways using the Clearinghouse StudentTracker service. This report offers some new ways to analyze enrollment behaviors of former students who left the postsecondary education system without receiving a credential as well as national benchmarks for this population.
For students who have the equivalent of at least two years' worth of progress toward a degree, that is potential completers, the majority of both men and women are young adult learners, 24 to 29 years old as of December 2013. Within this group, a majority have been out of higher education for relatively short periods, between four to six years, while the second largest group has been out only two to three years. Another notable characteristic is that most of this group attended only one or two institutions. As a result, identifying institutions that may want to reach out to those former students is likely to be straightforward when the potential completer had exclusive experience with one institution and less complicated when no more than two institutions are involved. Knowing students' age may help institutions to design outreach efforts based on their current stage in life. Similarly, knowing how long the student has spent out of the college setting allows institutions to tailor advice about the need to revalidate credits or whether a degree could be finished before that process needs to take place.
For current students, institutional policy makers can use these data to better inform students of the relationship between the increased number of stop-outs and longer pathways, which potentially lead to non-completion. And they can encourage students to find ways to remain enrolled, if they wish to complete a degree within a shorter time frame.
Finally, potential completers' sector enrollment was equally divided between exclusive enrollments in two- and four-year institutions, while nearly the same proportion enrolled in both sectors during their pathway. Therefore, each sector could develop policies and programs directed at distinct subgroups of returning students, considering the information needs regarding credit transfer agreements, course revalidation, and evening and weekend courses.
Public Policy Implications
Many of the implications for institutions discussed above are important for public policymakers to note as well. However, perhaps one of the most important findings in this report is the near equal proportions of potential completers who have enrollment histories in two- or four-year institutions exclusively or both. Returning to the relationship between students who have two or more years' worth of progress toward a degree and the college completion agenda, these data suggest that policymakers should ensure that both types of institutions are supported in their efforts to recruit students who are familiar with their type of institution.
References
Adelman, C. (2013). Searching for Our Lost Associate’s Degrees: Project Win-Win at the Finish Line. Institute for Higher Education Policy (IHEP). Washington, DC.
Bahr, P.R. (2014). The labor market returns in earnings to community college credits and credentials in California. Ann Arbor, Michigan: Center for the Study of Higher and Postsecondary Education, School of Education, University of Michigan. Retrieved from https://umich.app.box.com/Bahr-2014-earnings1
Baum, S., Ma, J., & Payea, K. (2013). Education pays 2013: The benefits of higher education for individuals and society. Washington, DC: College Board. Retrieved 11/4/2013 from:
http://trends.collegeboard.org/sites/default/files/education-pays-2013-full-report.pdf. Belfield, C. R., & Bailey, T. (2011). The benefits of attending community college: A review of the evidence. Community College Review, 39(1), 46-68.
Lane, P. (2012). Strategies for Success: Promising Ideas in Adult College Completion. Policy Exchanges. Western Interstate Commission for Higher Education.
Pusser, B., D. W. Breneman, B. N. Gansneder, et al. (2007). Returning to learning: Adults’ success in college is key to America’s future. Indianapolis, IN: Lumina Foundation for Education.
Ross-Gordon, J. M. (2011). Research on adult learners: Supporting the needs of a student population that is no longer nontraditional. Peer Review, 13(1), 26-29.
Snyder, T. D., & Dillow, S. A. (2011). Digest of education statistics 2010 (NCES 2011-015). Washington, DC: US Department of Education, Institute of Education Sciences. National Center for Education Statistics. Retrieved
from http://nces.ed.gov/pubs2011/2011015.pdf.
Tierney, W. G. (2013). The Conundrum of Profit-Making Institutions in Higher education. In L. W. Perna (1st ed.), Preparing Today's Students for Tomorrow's Jobs in Metropolitan America (pp. 149-176). Philadelphia,
Pennsylvania: University of Pennsylvania Press.
U.S. Census Bureau. (n.d). Educational Attainment: 2012 American Community Survey 1-Year Estimates. Retrieved from
http://factfinder2.census.gov/faces/tableservices/jsf/pages/productview.xhtml?pid=ACS_12_1YR_S1501&prod Type=table.
Appendix A: Methodological Notes
OVERVIEW
This report describes students who enrolled in a U.S. postsecondary institution for at least one term at some point since January 1, 1993, with no enrollment records between August 13, 2012, and December 31, 2013, and no degree or certificate, as of December 31, 2013, according to National Student Clearinghouse data. After exploring the enrollment patterns of the overall group, termed some college, no degree, briefly, we report on a group, termed multiple-term enrollees, defined as those students who enrolled for two terms or more during the study period (January 1, 1993, to December 31, 2013)1. The main findings of the report focus on a more limited group we have termed potential completers — i.e., students who have accrued the equivalent of two-years' enrollment or more in the last 10 years of the study period (August 11, 2003, to December 31, 2013)2. Details regarding data,
NATIONAL COVERAGE OF THE DATA
The National Student Clearinghouse® (the Clearinghouse) is a unique and trusted source for higher education
enrollment and degree verification. Since its creation in 1993, the participation of institutions nationwide in Clearinghouse data-collection programs has steadily increased. Currently, Clearinghouse data include more than 3,600 postsecondary institutions and 96 percent of U.S. postsecondary enrollments. The Clearinghouse has an over 20-year track record of providing automated student enrollment and degree verifications. Due to the Clearinghouse's unique student-level record approach to data collection, the Clearinghouse data provides opportunities for robust analysis not afforded by the more commonly used institution-level national databases. The enrollment data used in this report provide an unduplicated headcount of students enrolled in postsecondary education. Clearinghouse data track enrollments nationally and are not limited by institutional and state
boundaries. Moreover, because the data are student-level, researchers can use it to link concurrent as well as consecutive enrollments of individual students at multiple institutions, a capability that distinguishes the
Clearinghouse data from national databases built with institution-level data. For instance, in the National Center for Education Statistics (NCES) and the Integrated Postsecondary Education Data System (IPEDS) — one of the most widely used national data sets in postsecondary education research — concurrent enrollments remain unlinked and, therefore, are counted as representing separate individuals and create duplication.
COHORT IDENTIFICATION, DATA CUT, AND DEFINITIONS
The study focused on the cohort of students who had at least one enrollment record at U.S. colleges and
universities after January 1, 1993, with no enrollment records between August 13, 2012, and December 31, 2013, and no degree or certificate through December 31, 2013.
Because the study intended to describe students who had not received a completion credential and who had left postsecondary education, students who had one or more enrollment record beginning on August 13, 2012, or later were considered "still enrolled" and excluded from the study data set. Also excluded from the study were students whose enrollment records were only from institutions outside the U.S.
In summary, the study cohort included students who fulfilled all of the following conditions: 1. Enrolled in a Title IV institution at some time during the study period;
2. Did not have an enrollment record, as shown in Clearinghouse data, after August 13, 2012;
3. Did not receive any degree or certificate from a postsecondary institution at any point according to Clearinghouse data;
4. Did not have enrollment records exclusively from institutions within U.S. territories or outside of the U.S.; 5. Had at least one enrollment term of legitimate length (i.e., one day long or longer); and