Interactive Labs for Introductory Statistics
Courses
A. Bathi Kasturiarachi
Kent State University, Stark Campus, USA.
[email protected]
Abstract
We introduce a new set of interactive learning labs for introductory statistics courses. The targeted courses are taught in a classroom equipped with laptop computers to accommodate a mathematics laboratory environment. Speci…c lab modules are centered on major themes or concepts, ampli…ed by current readings, and enhanced by the computer software systems MS Excel, SPSS, and Fathom. Experiential learning has been at the heart of the design since students will be experimenting statistical ideas using computers during lab sessions. They will be expected to work in small groups so that the learning centered clusters will exchange ideas in the spirit of cooperative learning. We will discuss and elaborate on the rationale underlying the development of the labs.
AMS Classi…cation: [2000]Primary 97C80; Secondary 97U70, 97B50 Keywords: Learning modules, pre-service teachers, liberal arts majors
1
Introduction
Statistics is the science of studying numerical data that arise in the context of some study. It is a subject that has its roots in the mathematical subject of probability, but has evolved mainly though scienti…c attempts to draw conclusions from data while being mindful of the inherent imprecision in calculations that lead to delicate error estimates. It is this latter description that helps us to understand the role of statistics as a science. In the contemporary approach to statistics teaching, heavy emphasis is placed on data analysis at the beginning and throughout the course. According to David Moore [4], a leading educator in statistics, the main categories into which the subject of statistics sub divides are production of data, analysis of data, and inference from data. The guiding principles we have used throughout the redesigning of the elementary statistics courses at Kent State University, Stark Campus, have been the following three standards [1] recommended by the American Statistical Association (ASA) and the Mathematical Association of America (MAA):
Emphasize statistical thinking
More data and concepts; less theory, fewer recipes Foster active learning.
Statistical pedagogy has undergone radical change during the past few decades due mainly to cheap computing power and e¢ cient software that enables students to shortcut laborious calcula-tions. Computers can do more than reduce calculacalcula-tions. It allows students to explore data and discover statistical ideas and draw inferences about the data by experiences they receive in a labora-tory setting. With these learning outcomes in mind, we applied for a grant from the Provost’s O¢ ce at Kent State University, under the program Partnerships in Transforming Teaching and Learning
with Technology [5]. Part of the funding we received was used to develop learning labs for two elementary statistics courses. The elementary statistics courses at Kent State University are among the choices for the Liberal Education Requirement (LER) in the College of Arts & Sciences. Due to the applied nature of the course, majors outside the College of Arts & Sciences, such as Nurs-ing, Criminal Justice, Education, and Fashion Designing have made it a relevant option for their students. Students in these classes come from diverse disciplinary backgrounds and various levels of mathematical preparation. The presence of diverse majors in the classroom is a challenge that typi…es the need to introduce data that are relevant to their disciplines. In the past we have used graphing calculators as a tool to analyze such data in real time and continue to do so [2]. The learning labs have augmented and enhanced the structured inquiry that is required in the courses by providing our students the necessary tools to explore the world of data. In order to properly implement the new labs and to facilitate a smooth dissemination of ideas, we searched for the best pedagogical technique that would connect to learning theory optimally. Experiential Learning be-came the catalyst that enabled us to arrange the learning labs in small groups so these learning centered clusters were able to exchange ideas in the spirit of cooperative learning.
2
Experiential Learning
Experiential learning is a theory that espouses the idea that people learn from their experiences. Such learning is most e¤ective when the environment in which the learning occurs is structured to maximize the learning outcomes. Experiential learning theory o¤ers a foundation that is soundly based in a cognitive process that balances a students’education, personal development, and work. The experiential learner, according to David Kolb [3], goes through a cyclic learning process that de-velops in four stages. First the learner encountersconcrete experiences(CE), followed byre‡ections and observations (RO), which directs the learner to abstract conceptualization (AC), and …nally ends with active experimentation (AE). At which point, the learning cycle goes back to concrete experiences etc. This model is known as the Kolb Learning Cycle. A learner, whose orientation is CE, deals with experiences preferring an intuitive approach to problems. Such learners relate well to people and are comfortable in real-life situations. A learner whose orientation is RO looks for meanings in situations through observations. They re‡ect on these meanings and seek to learn about their implications. A learner whose orientation is AC, will focus on logical understanding and concentrates on theory. Lastly, a learner whose orientation is AE relies on experimentation. Such a learner will undergo some necessary risk to ensure the completion of a task. An ideal learner cycles through each of the learning modes and never actually settles at a single orientation. The diverse types of learners in our classroom are most likely not ideal learners, so the learning labs we have implemented should appeal to all types of learners.
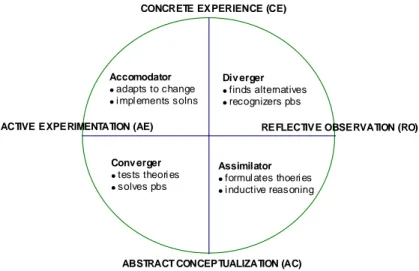
The Kolb Learning Cycle can be further divided to measure the degree to which abstractness is emphasized over concreteness (AC-CE) and active experimentation is emphasized over re‡ection (AE-RO). The learning style plane (…gure 1), in which the vertical AC-CE axis is perpendicular to the horizontal AE-RO axis, illuminates this comparison. Each of the four quadrants identi…es a dominant learning style. In the (AC, AE) quadrant we place the converger, whose dominant learning styles are abstract conceptualization and active experimentation. These learners perform well solving problems which require a single correct answer. Most convergers specialize in the physical sciences and engineering (about 10% in our statistics classes). The opposite of this learning style is found in the (CE, RO) quadrant, known as adiverger, because of their ability to generate alternate ideas. These learners are mostly interested in humanities and liberal arts (about 40% in our statistics classes). The third type of learner is anassimilatorfound in the (AC, RO) quadrant, having dominant learning styles of abstract conceptualization and re‡ective observation. An assimilator will integrate observations and ideas into a theoretical framework and prefer to work in basic sciences and mathematics (about 20% in our statistics classes). The opposite learning style of an assimilator is an accommodator found in the (CE, AE) quadrant. This learner is able to adapt to changing circumstances. Such learners usually prefer action oriented jobs such as those found in business,
Figure 1: Klob Learning Cycle Assimilator
• formul ates thoeri es
• i nductive reasoning Conv erger • tests theori es • solves pbs Div erger • finds alternatives • recognizers pbs Accomodator • adapts to change • i mpl ements solns ACTIVE EXPERIMENTATION (AE)
ABSTRACT CONCEPTUALIZATION (AC)
REFLECTIVE OBSERVATION (RO) CONCRETE EXPERIENCE (CE)
education, and technical …elds (about 30% in our statistics classes).
A mathematician, who is trained to teach statistics, is most likely an assimilator. If such an educator teaches students only to think with learning abilities found in this particular quadrant, there is a risk of alienating the students whose learning styles are in the other three quadrants. This fact holds the key to understanding the value of our learning labs. During the lab sessions students will share and exchange ideas, experiment, and draw valid conclusions all in an ideal setting that favors experiential learners.
3
Interactive Labs
The interactive labs give instructors a greater ‡exibility in choosing material for topics taught in the elementary statistics courses. Some applications will readily involve topics from other disci-plines. By evaluating student writing rigorously we expect excellence in communicating statistical ideas. The targeted courses are taught in a classroom equipped with laptop computers to ac-commodate a mathematics laboratory environment. Speci…c lab modules are centered on major themes or concepts, ampli…ed by current readings, and enhanced by the computer software systems MS Excel, SPSS, and Fathom. Interactive labs focused on data have been the key to students’ understanding of statistical concepts. One of our long term goals is to develop a new electronic resource that would be accessible to all instructors at Kent State University who teach similar courses.
3.1
Key Statistical Topics
From the viewpoint of a statistics educator, one of the foremost expectations in a beginning statistics course is the promotion of statistical thinking. For the experiential learner, statistical thinking is a platform on which a serious dialogue between data, statistical analysis, and modeling will take place. In a beginning statistics course, due to time constraints, it is reasonable to be able to complete only a handful of labs during the semester. In our original grant proposal we recommended that ten labs should …t comfortably in a 15-week semester. However, when we developed the labs during the …rst year, we found it necessary to expand the list of concepts covered in the labs to twenty and left it up to the instructors to cherry pick a subset of the labs. In general, most of these labs have not
been developed from ground level up, but rather built on existing ideas that have been developed by other institutions. This has enabled us to avoid the many pitfalls that crop up during the embryonic stage and have a more re…ned product ready for classroom use. We list below ten selected statistical topics that are covered by our labs and brie‡y elaborate on the rationale for each choice.
Mean verses Median This lab is done very early during the course when central tendencies are discussed. Before tackling the seemingly more complicated idea of variability, it is worthwhile to spend time to ensure that students are able to pick the correct and appropriate measurement(s) for the center of data.
Importance of Standard Deviation Every process is subject to variability. Even in carefully collected data, the ubiquitous presence of variability heaves a touch of unexpectedness to every data set. Statistics would not be a science without variability. In this lab students explore variability through a series of activities.
Association and Lurking Variables At an introductory level, association, is the exploration of relationships between two variables. The genesis of this idea goes back in time to Nicole Oresme (1320-1382), a French cleric and mathematician, who introduced a two-dimensional representation of velocity as it changed with respect to time. In the …rst part of the lab (take home) students complete a translated original reading of Oresme and are introduced to the modern day version of a scatter plot. The second part of the lab (in-class) allows the students to discover the important distinction betweenassociation andcausation.
Correlation and Regression The idea of correlation between two variables and the related idea of linear regression forms the core of Exploratory Data Analysis (EDA). As the name suggests, EDA, is a journey that the students undertake to discover more and more properties of data. We have designed a series of labs along [6] that explore the important notions of correlation coe¢ cient (r), role ofr2, outliers, in‡uential data, residues, and prediction.
Conditional Probability Probability is a triumph of an idea. Yet its complexity poses a serious challenge to both statistics educators as well as beginning students. In particular, conditional probability is a di¢ cult idea for many students. The lab has two parts. The …rst part has two readings followed by short answer questions and the second part is an experiment performed in class using thumb tacks where the ideas of conditional probability are further explored.
Central Limit Theorem The Central Limit Theorem (CLT) forms the foundation for estimating population parameters which in turn leads to hypothesis testing. Students who have used the standard normal distribution to answer questions about random samples are led to believe that most distributions are normal. They are surprised to learn that most distributions are not normal. The Central Limit Theorem is needed to pull them back to their comfort zone. Since a proof of the theorem is not within reach, they are led to discover it through experimentation. A plethora of such experiments exist. We use one where the original non-normal distribution is constructed using the ages of pennies.
Con…dence Intervals A con…dence interval procedure produces an interval from sample data that will contain the true parameter and a con…dence level that describes the proportion of all samples for which such an interval would contain the true value of the parameter. Although this is a tricky idea for students, it is one of the most lucid statements that can be made using probability. It has all the elements of good approximation - an interval, the error, and a statement about the con…dence of the method. We have three labs developed for this topic.
P-value of a Test of Signi…cance Students often …nd that in hypothesis testing, the comparison of an observed value from a sample to a test statistic somewhat hard to follow. The alternative method is to use the P-value, which gives a probability that an e¤ect at least as strong as that observed in a sample can occur by chance. We prefer theP-value method. Our lab includes right, left, and two-tailed hypothesis testing.
Statistical Signi…cance When we use the termstatistically signi…cant,we mean that an observed e¤ect is too large to occur simply by chance. We explore this idea in our labs through examples covering randomized experimental data obtained from medical studies.
Randomization Response Sampling Sensitive issues are di¢ cult to poll because subjects may fear repercussions for answering truthfully. We can use randomized response sampling to address the issue of minimizing untruthful responses to sensitive questions. The lab for this section illustrates a clever use of a probability tree diagram.
3.2
Sample Labs
The page limit imposed on this article does not permit us to include examples of our labs. Sample labs can be accessed at http://www.personal.kent.edu/~akasturi/statlabs.html. These interactive learning labs are easily adaptable with minor modi…cations to …t most introductory statistics courses.
References
[1] Cobb, G. (1992). “Teaching Statistics,”inHeeding the Call for Change: Suggestions for Curric-ular Action, ed. Lynn Steen. MAA Notes, Number 22, 3-43.
[2] Kasturiarachi, A., Bathi. (2000). Using Graphing Calculators to Teach Elementary Statistics. AURCO Journal, Spring 2000, 139-148.
[3] Kolb, David A. (1983). Experiential Learning: Experience as the source of learning. Prentice Hall.
[4] Moore, David S. (2006). The Basic Practice of Statistics, 4th Edition, New York, NY: W. H. Freeman and Company.
[5] Pearl, Dennis K. (2004). Private communications at the Symposium held at Kent State Univer-sity, FPDC, February 20, 2004.
[6] Rossman, Allan J., Chance, Beth L., Lock, Robin H. (2002). Workshop Statistics: Discovery with Data and Fathom,Key College Publishing.