syslog-ng Store Box 6.5
Copyright 2020 One Identity LLC. ALL RIGHTS RESERVED.
This guide contains proprietary information protected by copyright. The software described in this guide is furnished under a software license or nondisclosure agreement. This software may be used or copied only in accordance with the terms of the applicable agreement. No part of this guide may be reproduced or transmitted in any form or by any means, electronic or mechanical, including photocopying and recording for any purpose other than the purchaser’s personal use without the written permission of One Identity LLC . The information in this document is provided in connection with One Identity products. No license, express or implied, by estoppel or otherwise, to any intellectual property right is granted by this document or in connection with the sale of One Identity LLC products. EXCEPT AS SET FORTH IN THE TERMS AND CONDITIONS AS SPECIFIED IN THE LICENSE AGREEMENT FOR THIS PRODUCT, ONE IDENTITY ASSUMES NO LIABILITY WHATSOEVER AND DISCLAIMS ANY EXPRESS, IMPLIED OR STATUTORY WARRANTY RELATING TO ITS PRODUCTS INCLUDING, BUT NOT LIMITED TO, THE IMPLIED WARRANTY OF MERCHANTABILITY, FITNESS FOR A PARTICULAR PURPOSE, OR NON-INFRINGEMENT. IN NO EVENT SHALL ONE IDENTITY BE LIABLE FOR ANY DIRECT, INDIRECT, CONSEQUENTIAL, PUNITIVE, SPECIAL OR INCIDENTAL DAMAGES (INCLUDING, WITHOUT LIMITATION, DAMAGES FOR LOSS OF PROFITS, BUSINESS INTERRUPTION OR LOSS OF INFORMATION) ARISING OUT OF THE USE OR INABILITY TO USE THIS DOCUMENT, EVEN IF ONE IDENTITY HAS BEEN ADVISED OF THE POSSIBILITY OF SUCH DAMAGES. One Identity makes no representations or warranties with respect to the accuracy or completeness of the contents of this document and reserves the right to make changes to specifications and product descriptions at any time without notice. One Identity does not make any commitment to update the information contained in this document. If you have any questions regarding your potential use of this material, contact: One Identity LLC. Attn: LEGAL Dept 4 Polaris Way Aliso Viejo, CA 92656
Refer to our Web site (http://www.OneIdentity.com) for regional and international office information. Patents One Identity is proud of our advanced technology. Patents and pending patents may apply to this product. For the most current information about applicable patents for this product, please visit our website at http://www.OneIdentity.com/legal/patents.aspx. Trademarks One Identity and the One Identity logo are trademarks and registered trademarks of One Identity LLC. in the U.S.A. and other countries. For a complete list of One Identity trademarks, please visit our website at www.OneIdentity.com/legal. All other trademarks are the property of their
respective owners. Legend
WARNING: A WARNING icon highlights a potential risk of bodily injury or property damage, for which industry-standard safety precautions are advised. This icon is often associated with electrical hazards related to hardware.
CAUTION: A CAUTION icon indicates potential damage to hardware or loss of data if instructions are not followed.
SSB User Guide
Updated - 30 November 2020, 11:57 Version - 6.5
Contents
Preface 5 Target audience and prerequisites 5 Introduction 6 What SSB is 6 What SSB is not 7 Why is SSB needed 7 Who uses SSB 8 SSB web interface 9 Supported web browsers 9Searching log messages 11
Using the search interface 11 Customizing columns of the log message search interface 18 Metadata collected about log messages 19 Using complex search queries 20 Searching encrypted logspaces 27 Using persistent decryption keys 27 Using session-only decryption keys 29
Creating reports from log data 31
Creating custom statistics from log data 31
Displaying log statistics 31
Creating reports from custom statistics 34
Configuring custom reports 35
Browsing reports 36
Creating content-based alerts 38
Setting up alerts on the search interface 39
Setting up alerts on the Search > Content-Based Alerts page 41
1
Preface
Welcome to the syslog-ng Store Box 6.5 User Guide.This document describes how to use the syslog-ng Store Box (SSB). Background information for the technology and concepts used by the product are also discussed.
Target audience and prerequisites
This guide is intended for auditors, consultants, and security experts responsible for auditing, monitoring, and troubleshooting applications and server administration processes. It is also useful for IT decision makers looking for a tool to improve the security and auditability of their servers, or to help compliance with the Sarbanes-Oxley (SOX), the Health Insurance Portability and Accountability Act (HIPAA), Basel II, or the Payment Card Industry (PCI) standard.2
Introduction
This chapter introduces the syslog-ng Store Box (SSB), discussing how and why it is useful, and what benefits it offers to an existing IT infrastructure.What SSB is
syslog-ng Store Box (SSB) is a device that collects, processes, stores, monitors, and manages log messages. It is a central log server appliance that can receive system (syslog and eventlog) log messages and Simple Network Management Protocol (SNMP) messages from your network devices and computers, store them in a trusted and signed logstore, automatically archive and back up the messages, and also classify the messages using artificial ignorance. The most notable features of SSB are as follows: l Secure log collection using Transport Layer Security (TLS). l Trusted, encrypted, and time stamped storage. l Ability to collect log messages from a wide range of platforms, including Linux, Unix, BSD, Sun Solaris, HP-UX, IBM AIX, IBM System i, as well as Microsoft Windows. l Forwards messages to log analyzing engines. l Classifies messages using customizable pattern databases for real-time log monitoring, alerting, and artificial ignorance. l High Availability (HA) support to ensure continuous log collection in business-critical environments. l Real-time log monitoring and alerting. l Retrieves group memberships of the administrators and users from a Lightweight Directory Access Protocol (LDAP) database. l Strict, yet easily customizable access control to grant users access only to selected log messages. l Ability to search log data in multiple logspaces, whether on the same SSB applicance or located on a different appliance, even in a remote location.SSB is configured and managed from any modern web browser that supports HTTPS connections, JavaScript, and cookies.
Supported browsers:
Mozilla Firefox 52 ESR We also test SSB on the following, unsupported browsers. The features of SSB are available and usable on these browsers as well, but the look and feel might be different from the supported browsers. Internet Explorer 11, Microsoft Edge, and the currently available version of Mozilla Firefox and Google Chrome.What SSB is not
The syslog-ng Store Box (SSB) appliance is not a log analyzing engine, though it can classify individual log messages using artificial ignorance. SSB comes with a built-in feature to store log message patterns that are considered "normal". Messages matching these patterns are produced during the legitimate use of the applications (for example sendmail, Postfix, MySQL, and so on), and are unimportant from the log monitoring perspective, while the remaining messages may contain something “interesting”. The administrators can define log patterns on the SSB interface, label matching messages (for example, security event, and so on), and request alerts if a specific pattern is encountered. For thorough log analysis, SSB can also forward the incoming log messages to external log analyzing engines.Why is SSB needed
Log messages contain information about the events happening on the hosts. Monitoring system events is essential for security and system health monitoring reasons. A well-established log management solution offers several benefits to an organization. It ensures that computer security records are stored in sufficient detail, and provides a simple way to monitor and review these logs. Routine log reviews and continuous log analysis help to identify security incidents, policy violations, or other operational problems. Logs also often form the basis of auditing and forensic analysis, product troubleshooting and support. There are also several laws, regulations and industrial standards that explicitly require the central collection, periodic review, and long-time archiving of log messages. Examples of such regulations are the Sarbanes-Oxley Act (SOX), the Basel II accord, the Health Insurance Portability and Accountability Act (HIPAA), or the Payment Card Industry Data Security Standard (PCI-DSS).Built around the popular syslog-ng Premium Edition (syslog-ng PE) application used by thousands of organizations worldwide, the syslog-ng Store Box (SSB) brings you a
powerful, easy-to-configure appliance to collect and store your logs. Using the features of the latest syslog-ng PE to their full power, SSB allows you to collect, process, and store log
All data can be stored in encrypted and optionally time stamped files, preventing any modification or manipulation, satisfying the highest security standards and policy compliance requirements.
Who uses SSB
The syslog-ng Store Box (SSB) appliance is useful for everyone who has to collect, store, and review log messages. In particular, SSB is invaluable for: l Central log collection and archiving: SSB offers a simple, reliable, and convenient way of collecting log messages centrally. It is essentially a high-capacity log server with high availability support. Being able to collect logs from several different platforms makes it easy to integrate into any environment. l Secure log transfer and storage: Log messages often contain sensitive information and also form the basis of audit trails for several applications. Preventing eavesdropping during message transfer and unauthorized access once the messages reach the log server is essential for security and privacy reasons. l Policy compliance: Many organization must comply with regulations like the Sarbanes-Oxley Act (SOX), the Basel II accord, the Health Insurance Portability and Accountability Act (HIPAA), or the Payment Card Industry Data Security Standard (PCI-DSS). These regulations often have explicit or implicit requirements about log management, such as the central collection of log messages, the use of log analysis to prevent and detect security incidents, or guaranteeing the availability of log messages for an extended period of time — up to several years. SSB helps these organizations to comply with these regulations. l Automated log monitoring and log pre-processing: Monitoring log messages is an essential part of system-health monitoring and security incident detection and prevention. SSB offers a powerful platform that can classify tens of thousands of messages real-time to detect messages that deviate from regular messages, and promptly raise alerts. Although this classification does not offer as complete an inspection as a log analyzing application, SSB can process many more messages than a regular log analyzing engine, and also filter out unimportant messages to decrease the load on the log analyzing application.3
SSB web interface
syslog-ng Store Box (SSB) is configured via the web interface. Configuration changes take effect automatically after clicking . Only the modifications of the current page or tab are activated — each page and tab must be committed separately.Supported web browsers
The syslog-ng Store Box (SSB) web interface can be accessed only using TLS encryption and strong cipher algorithms. The browser must support HTTPS connections, JavaScript, and cookies. Make sure that both JavaScript and cookies are enabled.
NOTE:
SSB displays a warning message if your browser is not supported or JavaScript is disabled. If you have successfully accessed the SSB web interface using HTTPS at least once, your browser will remember this, and on any subsequent occasions, it will force you to access SSB using HTTPS, even if you try loading it through an HTTP connection. This is thanks to the HTTP Strict Transport Security (HSTS) policy, which enables web servers to enforce web browsers to restrict communication with the server over an encrypted SSL/TLS connection for a set period. Web servers declare the HSTS policy using a special Strict-Transport-Security response header field. This might, however, cause issues in any of the following cases: l When the SSL certificate of SSB's web interface has expired. In this case, any attempt to access the web interface using a secure connection will fail with an error message. l When you switch the trusted CA-signed certificate to a self-signed certificate for SSB's web interface. As per HSTS design, a self-signed certificate is not taken to have been issued by a trusted CA, therefore any secure connections to the SSB web interface will fail with an error message. The resolution to the above-mentioned issues is to:
l Remove the HSTS settings in your browser. This must be done locally, in a browser-specific way. For detailed instructions, consult the support site of the browser you are using. OR l Upload a new certificate, using a different browser on a different machine. For detailed instructions on how to upload external certificates to SSB, see "Uploading external certificates to SSB" in the Administration Guide.
Supported browsers:
Mozilla Firefox 52 ESR We also test SSB on the following, unsupported browsers. The features of SSB are available and usable on these browsers as well, but the look and feel might be different from the supported browsers. Internet Explorer 11, Microsoft Edge, and the currently available version of Mozilla Firefox and Google Chrome.4
Searching log messages
This section describes how to browse the log messages collected on SSB.l Using the search interface on page 11 explains how to use and customize the search
interface, describes the log message data that is available on SSB, and provides examples of the the wildcard and boolean search operators you can use.
l Searching encrypted logspaces on page 27 describes how to decrypt and browse
encrypted logspaces.
Using the search interface
The syslog-ng Store Box(SSB) application has a search interface for browsing the collected log messages. You can choose the logspace, enter a search expression, specify the
timeframe, and browse the results here.
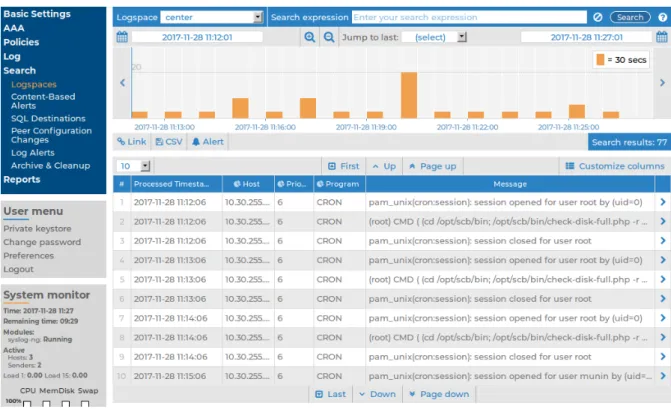
This section walks you through the main parts of the search interface. To access the search interface, navigate to Search > Logspaces.
Figure 1: Search > Logspaces — The log message search interface
Logspaces:
To choose the appropriate logspace, use the Logspace name menu. Note that you cannot access plain text logspaces on the SSB search interface. For more information on the available logspaces, and how to configure them, see "Storing messages on SSB" in the Administration Guide.Search:
On the log message search interface, you can use the Search expression field to search the full list of log messages. Search expressions are case insensitive, with the exception of operators (like AND, OR, etc.), which must always be capitalized. Click the icon, or see Using complex search queries for more details. When searching log messages, the capabilities of the search engine depend on the delimiters used to index the particular logspace. For details on how to configure the delimiters used for indexing, see "Creating logstores" in the Administration Guide. NOTE: You can search in indexed logspaces even if log traffic is disabled. You can create complex searches using wildcards and boolean expressions. For more information and practical examples, see Using complex search queries. NOTE: SSB only indexes the first 59 characters of every name-value pair (parameter). This has two consequences:l If the parameter is longer than 59 characters, an exact search might deliver multiple, imprecise results. Consider the following example. If the parameter is: .sdata.security.uid=2011-12-08T12:32:25.024+01:00-hostname-12345 SSB indexes it only as: .sdata.security.uid=2011-12-08T12:32:25.024+01:00-hostname-This corresponds to the first 59 characters. As a result, searching for: nvpair:.sdata.security.uid=2011-12-08T12:32:25.024+01:00-hostname-12345 returns all log messages that contain:
.sdata.security.uid=2011-12-08T12:32:25.024+01:00-hostname- l Using wildcards might lead to the omission of certain messages from the
search results. Using the same example as above, searching for the value: nvpair:*=2011-12-08T12:32:25.024+01:00-hostname-12345 does not return any results (as the 12345 part was not indexed). Instead, you have to search for: nvpair:*=2011-12-08T12:32:25.024+01:00-hostname-* This, as explained above, might find multiple results.
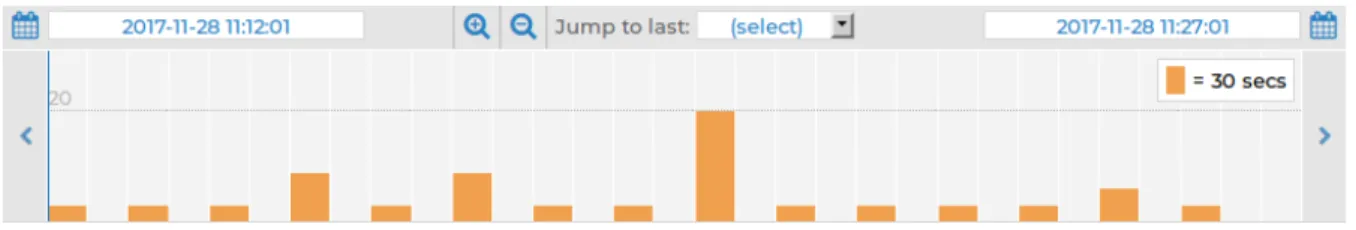
Overview:
Displays the number of log messages in the selected time interval. Figure 2: Search > Logspaces — Log message overviewUse the and icons to zoom, and the arrows to display the previous or the next intervals. To change the timeframe, you can:
l Change the beginning and the end date.
l Click and drag the pointer across a period on the calendar bars to select a specific
interval and zoom in.
l Use the Jump to last option to select the last 15 minutes, hour, 6 hours,
day, or week.
Hovering the mouse above a bar displays the number of results, and the start and end date of the period that the bar represents. Click a bar to display the results of that period in the table. Use Shift+Click to select multiple bars.
Action bar:
The search interface provides an action bar that allows you to: l Fetch a link to a search query. l Export search results into a csv file. l Create a content-based alert. It also displays the following information: l Error and warning messages.l The number of search results returned by a search query.
Figure 3: Search > Logspaces: Action bar
Link to a search query:
On clicking , the Bookmark links panel is displayed: Figure 4: Search > Logspaces — Bookmark links panel
Bookmark links allow you to fetch a link to a search query so that you can:
l Share your search queries with colleagues, who can then access the relevant search
results in one click.
The link in the Current view field provides a direct link to your search query and its results currently displayed on your screen. Whenever you open the bookmarked link from your browser, it will always return the same, fixed set of results. The start and end date that you set when executing the search query and fetching the link from the Bookmark links panel remain fixed. The Last menu, on the other hand, allows you to specify an interval of time, for example, the last 15 minutes or the last hour, and fetch search results generated within that period. The search results that you access using this link may differ on two different occasions as the start point of the specified interval is always the moment you open the bookmarked link from your browser.
CSV export:
On clicking , the CSV export panel is displayed: Figure 5: Search > Logspaces — CSV export panel
Clicking exports your search results into a CSV file. This saves the table as a text file containing comma-separated values. Note that if an error occurs when exporting the data, the exported CSV file will include a line (usually as the last line of the file) starting with a zero and the details of the problem, for example, 0<description_of_ the_error>. CAUTION:
Do not use Download CSV export to export large amounts of data, as exporting data can be very slow, especially if the system is under heavy load. If you regularly need a large portion of your data in plain text format, consider using the SSB RPC API (for details, see "The SSB RPC API" in the Administration Guide), or sharing the log files on the network and processing them with external tools (for details, see "Accessing log files across the network" in the Administration Guide).
Alert:
The alert functionality enables you to set up content-based alerts for search expressions of your choice. You will receive an alert when a match is found between the search expression and the contents of a log message. Note that the alerts are generated for only those log messages that are stored in the logspace(s) for which you set up the alert. For detailed information on content-based alerts, see "Creating content-based alerts" in the Administration Guide.Errors and warnings:
When any user action results in an error condition (for example, if you enter an invalid search expression, display statistics for a column that has not been indexed), an error or warning notification will be displayed on the action bar. Errors are shown in red letters, warnings are displayed in amber. If there is more than one notification, the latest will be displayed and the number of notifications triggered will also be indicated. Clicking the notification will open an Errors and warnings panel:Figure 6: Search > Logspaces — Errors and warnings panel
The Errors and warnings panel displays a list of errors/warnings with their time stamp and details of their cause. You can clear notifications one by one by clicking next to the them, or clear all of them by clicking .
Search results:
After running a search query, the action bar displays the number of search results returned by the query. This is useful information when you are trying to find out how often a certain element appears in the logs.List of log messages:
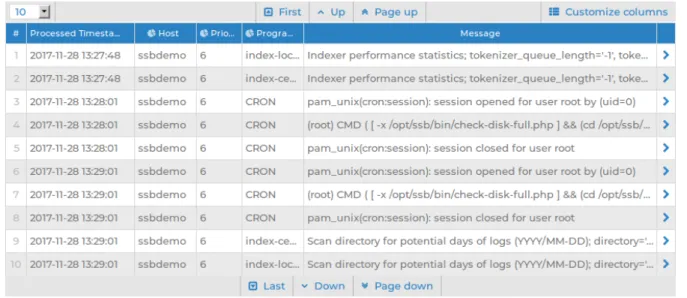
Use the arrow keys and the Page Up and Page Down keys to navigate the listed log
messages, or use the mouse wheel to scroll. You can disable mouse wheel scrolling in your User menu > Preferences. If data is too long to fit on one line, it is automatically wrapped and only the first line is displayed.
Figure 7: Search > Logspaces — List of log messages
Details of a log message:
To expand a row in the list of log messages, click . The complete log message is displayed:
Figure 8: Search > Logspaces — Viewing a single log message
Use the arrow keys to jump to the previous or the next log message.
Use the Page Up and Page Down to jump to the 10th log message before or after the currently displayed log message. You can also jump to the previous or the next log message with the mouse wheel.
If the displayed log message consists of several pages of data, you can configure the mouse wheel to be able to use it for scrolling the message vertically. To do this, navigate to User menu > Preferences, deselect Mousewheel scrolling of search results and click Set options. This will disable jumping between log messages with the mouse wheel. You can perform the following actions:
l Click any word in the message to copy it to the Search field.
of log messages.
l Click any of the icons to view the statistics of the selected category.
To return to the list of all log messages, click .
Customizing columns of the log message
search interface
The following describes how to customize the data displayed on the log message search interface.
To customize the data displayed on the log message search interface
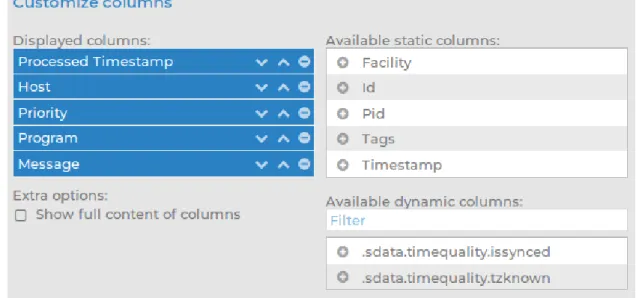
1. Click Customize columns.
The parameters used for the columns when displaying log messages are listed under Displayed columns. All other available parameters are listed under Available static columns and Available dynamic columns.
Dynamic columns are created from structured data parameters (name-value pairs) in log messages stored on syslog-ng Store Box(SSB). Structured data parameters are detected and added to the list of customizable columns automatically. (For more information on the structured data part of log messages, see "The STRUCTURED-DATA message part" in the Administration Guide.) NOTE:
To export the search results into a CSV file, click on the action bar. Note that the CSV file includes all the static columns and the displayed dynamic columns.
Figure 9: Search > Logspaces > Customize columns — Customizing columns of the log message search interface
2. To add a static column to the Displayed columns, click .
3. To add a dynamic column to the Displayed columns, choose a name-value pair from Available dynamic columns and click .
The selected name generates a new, separate dynamic column with a <name> heading (where <name> is the name of the key). The relevant values are displayed in the cells of the respective column.
4. To remove parameters from the Visible columns, click .
5. To display the full content of each column (including the log messages), enable Show full content of columns.
Metadata collected about log messages
The following information is available about the log messages: l Processed Timestamp: The date when syslog-ng Store Box(SSB) received the log message in YEAR-MONTH-DAY HOUR:MINUTE:SECOND format. l Timestamp: The time stamp received in the message — the time when the log message was created in YEAR-MONTH-DAY HOUR:MINUTE:SECOND format. l Facility: The facility that sent the message. l Priority: The priority value of the message. l Program: The application that created the message. l Pid: The program identifier of the application that created the message.l Message: The text of the log message.
l Tag: Tags assigned to the message matching certain pattern database rules.
l Id: Unique ID of the message.
l classifier.rule_id: ID of the pattern database rule that matched the message.
l classifier.class: Description of the pattern database rule that matched the message.
l Dynamic columns, created from additional name-value pairs, might also be
available.
Using complex search queries
You can use wildcards and boolean expressions, and search specific parts of the log messages collected on syslog-ng Store Box(SSB). NOTE: When searching log messages, the capabilities of the search engine depend on the delimiters used to index the particular logspace. By default, the indexer uses the following delimiter characters to separate the message into words (tokens): & : ~ ? ! [ ] = , ; ( ) ' ". For details on how to configure the delimiters used for indexing, see "Creating logstores" in the Administration Guide. NOTE: It is not possible to search for the whitespace () character in the MESSAGE part of the log message, since it is a hard-coded delimiter character. The following sections provide examples for different search queries: l For examples of exact matches, see Searching for exact matches and using complex queries on page 20. l For examples of using boolean operators to combine search keywords, see Combining search keywords on page 21.
l For examples of wildcard searches, see Using wildcard searches on page 22.
l For examples of searching for special characters, see Searching for special characters on page 24. l For examples of searching in a specific part of the message, see Searching in a specific part of the message on page 25. l For examples of searching name-value pairs, see Searching the name-value pairs of the message on page 25.
Searching for exact matches and using complex queries
By default, SSB searches for keywords as whole words in the MESSAGE part of the log message and returns only exact matches.
Example: Searching for exact matches
Search expression example Matches example Example EXAMPLE Does not match examples example.com query-by-example examCombining search keywords
You can use boolean operators - AND, OR, and NOT - to combine search keywords. Note that the boolean operators are case sensitive, and must be in all caps. More complex search expressions can also be constructed with parentheses.
Example: Combining keywords in search
Search expression keyword1 AND keyword2Matches (returns log messages that contain both keywords) Search expres-sion keyword1 OR keyword2 Matches (returns log messages that contain at least one of the keywords)
Search expression keyword1 AND NOT keyword2
Matches (returns log messages that contain only keyword1)
To search for expressions that can be interpreted as boolean operators (for example: AND), use the following format: message:AND.
Example: Using parentheses in search
Use parentheses to create more complex search expressions:
Search expression
(keyword1 OR keyword2) AND keyword3
Matches (returns log messages that contain either keyword1 and keyword3, or keyword2 and keyword3)
Using wildcard searches
You can use the ? and * wildcards in your search expressions.
Example: Using wildcard ? in search
The ? (question mark) wildcard means exactly one arbitrary character. Note that it does not work when trying to find non-UTF-8 or multibyte characters. If you want to search for these characters, the expression ?? might work, or you can use the * wildcard instead. Search expression example? Matches example1 examples Does not match example.com example12 query-by-example example? Search expression ?example? Matches 1example2 Does not match example.com example12 query-by-example
Search expression example??
Matches example12
Does not match example.com
example1
query-by-example
Example: Using wildcard * in search
The * wildcard means 0 or more arbitrary characters. It finds non-UTF-8 and multibyte characters as well. Wildcard characters also work in any message part, for example, program:postfix*. Search expression example* Matches example examples example.com Does not match query-by-example example* Search expression *example Matches example query-by-example Does not match example.com example12 Search expression *example* Matches example query-by-example example.com example12
Example: Using combined wildcards in search
Wildcard characters can be combined. Search expression ex?mple* Matches example1 examples example.com exemple.com example12 Does not match exmples query-by-exampleSearching for special characters
To search for the question mark (?), asterisk (*), backslash (\) or whitespace () characters, you must prefix these characters with a backslash (\). Any character after a backslash is handled as a character to be searched for. NOTE: Delimiter characters are an exception to the rule. It is not possible to search for delimiter characters, even when they are prefixed.
Example: Searching for special characters
To search for a special character, use a backslash (\). Search expression example\? Matches example? Does not match examples example1 To search for the backslash character, use two backslashes (\\). Search expression C:\\Windows Matches C:\WindowsSearch expression nvpair:path=C:\\Program\ Files
Matches C:\Program Files
Searching in a specific part of the message
You can search in a specific part of the message using the <type>: prefix. The message: (or msg:) prefix means the message part and can be omitted. For example, use the program: prefix to search for the name of an application, or use the host: prefix to search for a host name, and so on.
Example: Searching specific parts of messages
Search expression program:syslog-ngMatches All log messages from the syslog-ng application.
Searching the name-value pairs of the message
You can search the structured data part of log messages using the nvpair: prefix. Use the = delimiter to separate the name and the value of structured data parameters, and remove the quote marks from the values.
Example: Searching the structured data part of messages
Search expression nvpair:.sdata.win@18372.4.event_type=Alert Matches All log messages where there is a win@18372.4 element with the event_type="Alert" parameter. For example: [win@18372.4 EVENT_TYPE="Alert"]Example: Using wildcard * to search the structured data
You can use the asterisk (*) wildcard to broaden the search to all structured data elements.
Search expres-sion
nvpair:*event_type=Alert*
Matches All log messages where the "event_type" name has the "Alert" value.
Example: Searching for parameter names
To search for a specific name, add the "=" character after the name.
Search expression nvpair:*event_type=*
Matches All log messages where an "event_type" name exists.
Example: Searching for parameter values
To search for a specific value, add the "=" character before the value. Search expression nvpair:*=Alert Matches All log messages where a name has the "Alert" value. NOTE: SSB only indexes the first 59 characters of every name-value pair (parameter). This has two consequences: l If the parameter is longer than 59 characters, an exact search might deliver multiple, imprecise results. Consider the following example. If the parameter is: .sdata.security.uid=2011-12-08T12:32:25.024+01:00-hostname-12345 SSB indexes it only as: .sdata.security.uid=2011-12-08T12:32:25.024+01:00-hostname-This corresponds to the first 59 characters. As a result, searching for: nvpair:.sdata.security.uid=2011-12-08T12:32:25.024+01:00-hostname-12345
returns all log messages that contain:
.sdata.security.uid=2011-12-08T12:32:25.024+01:00-hostname- l Using wildcards might lead to the omission of certain messages from the
search results. Using the same example as above, searching for the value: nvpair:*=2011-12-08T12:32:25.024+01:00-hostname-12345 does not return any results (as the 12345 part was not indexed). Instead, you have to search for: nvpair:*=2011-12-08T12:32:25.024+01:00-hostname-* This, as explained above, might find multiple results.
Search performance tips
To decrease the load on SSB when searching and receive your search results faster, note the following points. l Use as small a time range as possible l Prefer AND instead of OR l Avoid unneeded wildcard characters, such as * and ? l Use wildcard characters at the end of the tokens if possible
Searching encrypted logspaces
By default, you cannot browse encrypted logstores from the SSB web interface, because the required decryption keys are not available on SSB. To make browsing and searching encrypted logstores possible, SSB provides the following options:
l Use persistent decryption key(s) for a single user.
For details, see Using persistent decryption keys on page 27. l Use decryption keys for the duration of the user session only.
For details, see Using session-only decryption keys on page 29. One Identity recommends using 2048-bit RSA keys (or stronger).
account, and can also be protected (encrypted) with a passphrase.
To use persistent decryption keys
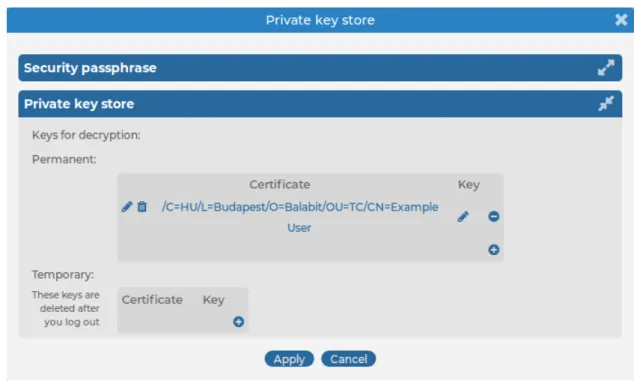
1. Select User menu > Private keystore. A pop-up window is displayed.
2. Select Permanent > , then select Certificate > . A pop-up window is displayed.
Figure 10: User menu > Private keystore — Adding decryption keys to the private keystore
3. Paste or upload the certificate used to encrypt the logstore. 4. Select Key > . A pop-up window is displayed.
5. Paste or upload the private key of the certificate used to encrypt the logstore. 6. Repeat Steps 2-5 to upload additional keys if needed.
7. Select Security passphrase > Change, and enter a passphrase to protect the private keys.
Figure 11: User menu > Private keystore — Securing the private keystore with a passphrase
8. Click Apply.
Using session-only decryption keys
You can upload decryption keys to browse encrypted logspaces for the duration of the session only. These keys are automatically deleted when you log out from syslog-ng Store Box(SSB).
To use session-only decryption keys
1. Select User menu > Private keystore. A pop-up window is displayed.
2. Select Temporary > , then select Certificate > . A pop-up window is displayed.
Figure 12: User menu > Private keystore — Adding decryption keys to the private keystore 3. Paste or upload the certificate used to encrypt the logstore. 4. Select Key > . A pop-up window is displayed. 5. Paste or upload the private key of the certificate used to encrypt the logstore. 6. Repeat Steps 2-5 to upload additional keys if needed. 7. Click Apply.
5
Creating reports from log data
SSB can periodically create reports from the statistics of processed logs. To configure reporting, first you have to create statistics from log data, and save it as a reporting subchapter. You can then configure a report using the saved subchapter. You can include multiple subchapters in a report. The necessary procedures are described in the following chapters: l For more information on creating statistics from available log data, see Creating custom statistics from log data on page 31.l For more information on creating reports, see Configuring custom reports on
page 35.
l For instructions on browsing the generated reports, see Browsing reports on page 36.
Creating custom statistics from log data
The syslog-ng Store Box(SSB) application can create statistics from the Facility, Priority, Program, Pid, Host, Tags, and .classifier.class columns. Use Customize columns to add the required column, if necessary. NOTE: The .classifier.class data is the class assigned to the message when pattern database is used. For details, see "Classifying messages with pattern databases" in the Administration Guide. The pattern databases provided by One Identity currently use the following message classes by default: system, security, violation, or unknown. You can display statistics on the web interface, export the related data as CSV, and also save the statistics to include in a report.Displaying log statistics
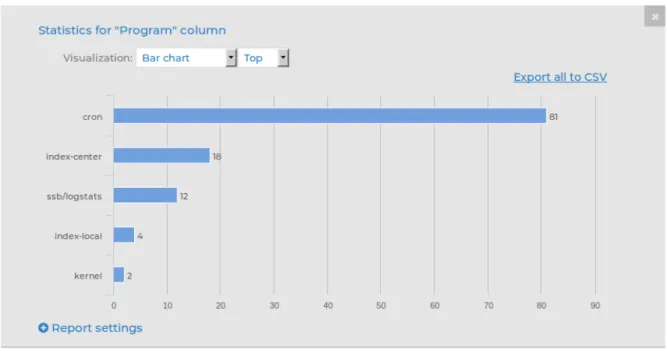
To display statistics about the log messages, click the icon in the appropriate header of the table.
NOTE:
For performance reasons, when creating statistics for a Multiple Logspace (see "Creating multiple logspaces" in the Administration Guide), syslog-ng Store Box(SSB) does not create statistics if the data upon which the statistics is based (for example, the hostname) has over 1000 entries in any of the member logspaces. In this case, SSB displays the Number of member statistics has too many entries error message. Figure 13: Search > Logspaces — Displaying log statistics as Bar chart
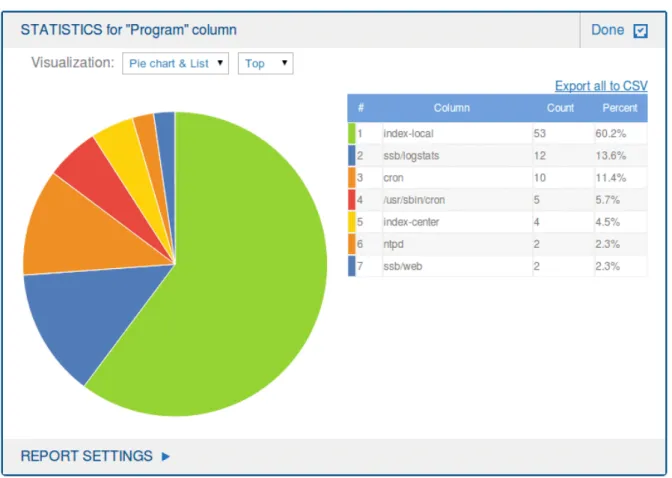
In Pie chart & List view, percentages add up to 100%. The only exception to this is when statistics are based on Tags. Since statistics are provided for tags rather than messages, when messages have multiple tags, the percentages may add up to more than 100%.
Figure 14: Search > Logspaces — Displaying log statistics as Pie chart & List Statistics will show the item with the largest number of entries first. To display the item with the least number of entries first, select Least. NOTE: When navigating to the "future" in the search bar, it is possible that the number of logs displayed in the Search results differs from the number of logs displayed in the Count part of the Host pie chart. To avoid this, do not navigate to the "future". If this has already happened, save the search expression that you have used somewhere, and then refresh the page by clicking Log > Search again. Note that it will display the original state of the Search page, meaning that for example it will remove all search expressions that you have entered before.
You can export these statistics in CSV format using the Export all to CSV option, or you can include them in reports as a subchapter.
CAUTION:
Do not use Export all to CSV to export large amounts of data, as exporting data can be very slow, especially if the system is under heavy load. If you regularly need a large portion of your data in plain text format, consider using the syslog-ng Store Box(SSB) RPC API (for details, see "The SSB RPC API" in the Administration Guide), or sharing the log files on the network and processing them with external tools (for details, see "Accessing log files across the network" in the Administration Guide).
Creating reports from custom statistics
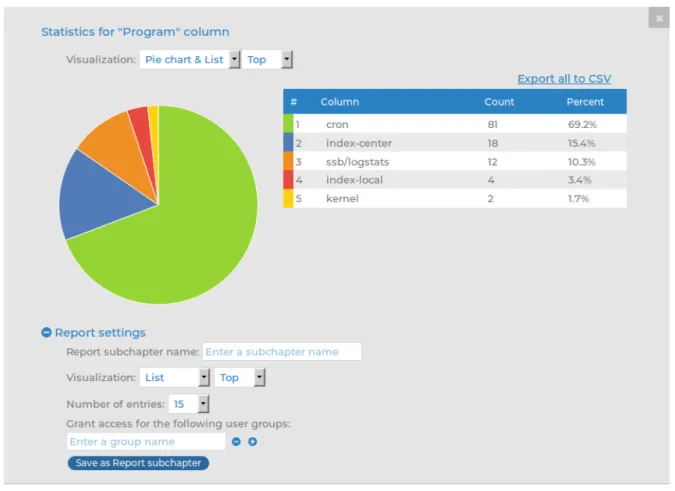
You can save log statistics to include them in reports as a subchapter.Figure 15: Search > Logspaces — Creating reports from custom log statistics
1. In the Statistics view, click Report settings.
2. Add a name for the statistics in the Report subchapter name field. 3. Select the Visualization for the report: List, Pie chart, or Bar chart.
5. Choose the Number of entries to include. NOTE: Selecting All includes only the first 1000 results. The remaining results are aggregated as 'others'. NOTE: For performance reasons, when creating statistics for a Multiple Logspace (see "Creating multiple logspaces" in the Administration Guide), syslog-ng Store Box (SSB) does not create statistics if the data upon which the statistics is based (for example, the hostname) has over 1000 entries in any of the member logspaces. In this case, SSB displays the Number of member statistics has too many entries error message.
6. Select the user group that can access the subchapter in the Grant access for the following user groups field.
7. Click Save as Report subchapter.
8. To add the saved subchapter to a report, follow the instructions provided in Configuring custom reports.
Configuring custom reports
The following describes how to configure syslog-ng Store Box(SSB) to create custom reports. Make sure that the user account has read & write/perform access to the use static subchapters privilege.
To configure SSB to create custom reports
1. Log in to the SSB web interface, and navigate to Reports > Configuration. Figure 16: Reports > Configuration — Configuring custom reports
2. Click and enter a name for the custom report.
3. Reports are organized into chapters and subchapters. To add a new chapter, go to Table of contents, click Add Chapter, enter a name for the chapter, then click OK. Repeat this step to create further chapters if needed.
4. Click Add Subchapter to add various reports and statistics to the chapter. The available reports will be displayed in a pop-up window. The reports created from custom statistics are listed at the end.
5. Use the arrows to change the order of the subchapters if needed.
6. To specify how often SSB should create the report, select the relevant Generate this report every (Day, Week, Month) option. Weekly reports are created on Mondays, while monthly reports on the first day of the month. You can select multiple options simultaneously.
7. By default, members of the search group can access the custom reports via the SSB web interface. To change this, enter the name of a different group into the Reports are accessible by the following groups field, or click to grant access to other groups. NOTE: Members of the listed groups will be able to access only these custom reports even if their groups do not have read access to the Reporting > Reports page. However, only those reports will be listed, to which their group has access. 8. By default, SSB sends out the reports in email to the address set in the Basic
Settings > Management > Mail settings > Send reports to field. NOTE:
If this address is not set, the report is sent to the SSB administrator's email address.
l To disable email sending, unselect the Send reports in e-mail option.
l To email the reports to a different address, select Recipient > Custom address, and enter the email address where the reports should be sent. Click to list multiple email addresses if needed. 9. Click .
Browsing reports
The generated reports are available in Portable Document (PDF) format by selecting Reports > Generated reports from the Main Menu.Use the time bar to find reports that apply to a particular period. If you select a period (for example, click a bar), only those reports will be displayed that contain information about the selected period.
Figure 17: Browsing reports
The following information is available about the reports: l Download: A link to download the report.
l Interval: The length of the reported period, for example, week, month, and so on.
l Report from: The start of the reported interval.
l Report to: The end of the reported interval.
l Generate time: The date when the report was created.
TIP:
To create a report for the current day, select Generate reports for today. The report will contain data for the 00:00 - current time interval. If artificial ignorance (for details, see "Classifying messages with pattern databases" in the Administration Guide) is enabled, an artificial ignorance report is created as well.
6
Creating content-based alerts
The syslog-ng Store Box(SSB) application can create content-based alerts about log messages based on specific search expressions. Search queries are run every few seconds and an alert is triggered whenever a match between the contents of a log message and a search expression is found. Alerts are collected and sent to a pre-defined email address (or email addresses). Some log messages might have particular significance and therefore getting notifications about those can often be more efficient than searching for them manually. You can set up or modify alerts for local logspaces or those logspaces to which you have the relevant privileges, meaning that: l Either the relevant user group has been assigned read and write/perform access tothe Search > Logs object on the AAA > Access Control page.
l Or the user group has been added under the Access control option of the relevant logspace on the Log > Logspaces page. There are two ways to create alerts, using the search interface or the Search > Content-Based Alerts page: l For details on how to set up alerts on the search interface, see Setting up alerts on the search interface.
l For details on how to set up alerts on the Search > Content-Based Alerts page,
see Setting up alerts on the Search > Content-Based Alerts page. NOTE:
Content-based alerting is currently not available for filtered, multiple, and remote logspaces.
NOTE:
In the case of encrypted logspaces, no decryption key is required for content-based alerting to work. SSB has access to the log messages while processing them, and the indexer and content-based alerting services run before encryption happens.
Setting up alerts on the search
interface
This section describes how to set up alerts using the search interface.
To set up alerts using the search interface
1. Configure a target where you wish to send your content-based alerts.
Alert targets are set up and modified by superusers or user groups that have been assigned read and write/perform access to the Policies object on the AAA > Access Control page.
To specify an alert target:
a. Go to Policies > Alert targets. b. Click .
The new tab that opens allows you to record an alert target. Figure 18: Policies > Alert targets — Alert targets page
c. Enter a name for your alert target. NOTE:
Alert target names must be unique.
d. In the Target email address field, enter the email address where you wish to send alerts.
NOTE:
You can specify only one email address per target. However, you can add multiple targets per alert, which allows you to send a specific alert to more than one email addresses (if required).
e. In the Cooldown period field, enter the minimum amount of time (in seconds) that should pass between the sending of two alert messages to this target. The minimum value is 60 seconds, and the maximum value is 999999 seconds. NOTE: An alert message is sent only when a match is found between the contents of log messages and a search expression. This means that if no match is found, more time may pass between two alert messages than the interval specified as the cooldown period. f. Click to save your details.
Expected result:
You have successfully configured a target for your alert where alert messages will be sent.
2. Optional step: You can also specify the email address from which the alerts are sent to your targets. Configuring an email address from where you wish to receive emails can be useful for filtering purposes. If you do not specify such an email address, a default one will be used.
For detailed instructions, see the steps describing how to specify a Send e-mails as email address in "Configuring e-mail alerts" in the Administration Guide.
3. Once you have set up a target or targets, navigate to the search interface by going to Search > Logspaces.
Figure 19: Search > Logspaces — Setting up alerts on the search interface
4. In the Logspace name menu, select the relevant logspace.
5. In the Search expression field, enter the search expression that you wish to receive alerts about and click .
6. To configure additional details for the alert, click . The Content-based alerting panel is displayed.
The Logspace field displays the name of the logspace that you have selected from the Logspace name menu. The Search expression field displays the search expression that you entered in the Search expression field. 7. Enter a name for your alert in the Alert name field. NOTE: Alert names must be globally unique. Using a prefix before alert names can help avoid specifying a name that is already in use. 8. Select a target from Targets. You can select multiple targets if you wish to distribute the alert to multiple email addresses. You can remove targets you have already added by clicking in front of the target's name. 9. To save your details, click . NOTE: If you wish to modify your alert later on, you can make changes via Search > Content-Based Alerts. For details, see Setting up alerts on the Search > Content-Based Alerts page.
Setting up alerts on the Search >
Content-Based Alerts page
This section describes how to set up alerts on the Search > Content-Based Alerts page.
To set up alerts on the Search > Content-Based Alerts page
1. Configure a target where you wish to send content-based alerts. For details on how to do this, see Step 1 in Setting up alerts on the search interface.
2. Optional step: You can also specify the email address from which alerts are sent. Configuring an email address from where you wish to receive emails can be useful for filtering purposes. If you do not specify such an email address, a default one will be used.
For detailed instructions, see the steps describing how to specify a Send e-mails as email address in "Configuring e-mail alerts" in the Administration Guide.
3. Once you have set up a target or targets, navigate to Search > Content-Based Alerts.
4. Click .
Figure 21: Search > Content-Based Alerts — Setting up content-based alerts on the Search
5. Enter a name for your alert. NOTE:
Alert names must be globally unique. Using a prefix before alert names can help avoid specifying a name that is already in use.
6. In the Search expression field, enter the search expression that you wish to receive alerts about. 7. Select the appropriate logspace from the Logspace menu. 8. Select a target or targets from the Alert targets menu. You can select multiple targets if you wish to distribute the alert to multiple email addresses. You can remove targets you have already added by clicking . 9. To save your details, click . NOTE: If you wish to modify your alert later on, you can make changes by revisiting the relevant steps on the Search > Content-Based Alerts page.
Format of alert messages
Once content-based alerts have been created, syslog-ng Store Box(SSB) will send alert messages to the configured targets.
The alert email's subject line will follow this format: Alert: [myalert][mylogspace]
Alert: There were at least 10000 matches between Mon 18 Apr 2016 10:45:38 CEST and Mon 18 Apr 2016 10:45:43 CEST on
* logspace: "<mylogspace>" * alert: "<myalert>"
* search expression: "<mysearchexpression>"
To review these matches on your SSB appliance, see: https://<IP_address_of_SSB>:<port_number>/index.php?_ backend=SearchLogspace#logspace_name=mylogspace&
from=1460976338&to=1460976343&search_expression=mysearchexpression
Note: You will not receive a new alert message for a cooldown period of 1 minute for this alert.
Note that the contents of the log messages are not shared in the alert message. A URL is provided to direct users to their SSB appliance.
About us
About us One Identity solutions eliminate the complexities and time-consuming processes often required to govern identities, manage privileged accounts and control access. Our solutions enhance business agility while addressing your IAM challenges with on-premises, cloud and hybrid environments.Contacting us
For sales and other inquiries, such as licensing, support, and renewals, visit https://www.oneidentity.com/company/contact-us.aspx.Technical support resources
Technical support is available to One Identity customers with a valid maintenance contract and customers who have trial versions. You can access the Support Portal at https://support.oneidentity.com/. The Support Portal provides self-help tools you can use to solve problems quickly and independently, 24 hours a day, 365 days a year. The Support Portal enables you to: l Submit and manage a Service Request l View Knowledge Base articles l Sign up for product notifications l Download software and technical documentation l View how-to videos at www.YouTube.com/OneIdentity l Engage in community discussions l Chat with support engineers online l View services to assist you with your product