ARTIGO ORIGINAL
ABSTRACT
Introduction: In type 2 diabetic patients treated with metformin the development of hyperlactacidemia or even lactic acidosis seems to result from an acute precipitating event. This study aims to assess the prevalence and relative risk of hyperlactacidemia in diabetic patients admitted in the Emergency Room, the predictive factors for high lactate concentration and the influence of hyperlactacidemia in patients’ prognosis.
Material and Methods: Transversal observational study including patients observed between June and October 2012: 138 type 2 dia
-betics, 66 treated with metformin, and 83 non-diabetic patients. Studies’ variables: age, sex, cause of admition, blood pressure, drugs, personal history, analytical study (biochemistry and arterial blood gas analyses with lactate) and destination. Statistical analysis was performed using SPSS 21.0®.
Results: Mean lactate concentration and hyperlactacidemia prevalence were significantly higher in diabetic patients (2.1 ± 0.1mmol/L
vs 1.1 ± 0.1mmol/L, p < 0.001 and 39.1% vs 3.6%, p < 0.001, respectively) and in those under metformin compared to other diabetics
(2.7 ± 0.2 mmol/L vs 1.6 ± 0.1 mmol/L, p < 0.001 and 56.9% vs 23.3%, p < 0.001, respectively). Diabetics on metformin presented a
25-fold increased risk of hyperlactacidemia (OR = 25.10, p < 0.05). Creatinine was the only independent predictive factor for lactate
concentrations (B = 1.33, p < 0.05). Patients with hyperlactacidemia had 4.4 times higher odds of being hospitalized or dying (OR =
4.37, p < 0.05). When hospitalized, they had longer hospitalization periods (21.66 ± 5.86 days vs 13.68 ± 5.33 days, p < 0.001) and
higher rate of deaths (12.5% (n = 4) vs 4.3% (n = 2), p < 0.05).
Conclusion: There was an increased risk of hyperlactacidemia in patients with type 2 diabetes, particularly for those under metformin. Serum creatinine represented the only independent associated factor of lactate concentration. The presence of hyperlactacidemia was associated with worse prognosis.
Keywords: Metformin; Diabetes Mellitus, Type 2; Lactates; Emergency Service, Hospital; Portugal.
Relation between Metformin Treatment and
the Development of Hyperlactacidemia at the
Emergency Room
Relação entre o Tratamento com Metformina e o Desenvolvimento de
Hiperlactacidemia no Serviço de Urgência
1. Serviço de Endocrinologia, Diabetes e Metabolismo. Centro Hospitalar e Universitário de Coimbra. Coimbra. Portugal. Recebido: 20 de Maio de 2013 - Aceite: 09 de Dezembro de 2013 | Copyright © Ordem dos Médicos 2014
Daniela GUELHO1, Isabel PAIVA1, Francisco CARRILHO1
Acta Med Port 2014 Mar-Apr;27(2):196-203
RESUMO
Introdução: Em diabéticos tipo 2 sob metformina o desenvolvimento de hiperlactacidemia ou mesmo acidose láctica parece decor
-rer de um evento precipitante agudo. Este estudo objetiva avaliar a prevalência e risco relativo de hiperlactacidemia em diabéticos observados no Serviço de Urgência, os fatores preditores da concentração de lactatos e a influência da lactacidémia no prognóstico.
Material e Métodos: Estudo observacional transversal incluindo 138 diabéticos tipo 2, dos quais 66 sob metformina, e 83 doentes não diabéticos atendidos entre junho e outubro de 2012. Variáveis estudadas: idade, sexo, motivo de urgência, pressão arterial, hábitos farmacológicos, antecedentes, estudo analítico (bioquímica e gasometria arterial com doseamento de lactatos) e destino após obser
-vação. Análise estatística realizada com SPSS 21.0®.
Resultados: A concentração de lactatos e proporção de hiperlactacidemia foram significativamente superiores nos diabéticos (2,1 ± 0,1 mmol/L vs 1,1 ± 0,1mmol/L, p < 0,001 e 39,1% vs 3,6%, p < 0,001, respetivamente); particularmente naqueles sob metformina
comparativamente aos restantes diabéticos (2,7 ± 0,2 mmol/L vs 1,6 ± 0,1 mmol/L, p < 0,001 e 56,9 % vs 23,3 %, p < 0,001, respeti
-vamente). Os diabéticos sob metformina contabilizaram uma probabilidade de hiperlactacidemia 25x superior (OR = 25,10, p < 0,05).
A creatinina representou o único fator preditor independente da lactacidemia (B = 1,33; p < 0,05). Os doentes com hiperlactacidemia
apresentaram probabilidade 4,4x superior de serem internados ou falecerem (OR = 4,37, p < 0,05). E, quando internados, contabi
-lizaram tempo de internamento (21,66 ± 5,86 dias vs 13,68 ± 5,33dias, p < 0,001) e número de óbitos superiores (12,5% (n = 4) vs
4,3% (n = 2), p < 0,05).
Conclusões: Demonstrou-se um risco acrescido de hiperlactacidemia em diabéticos tipo 2, particularmente naqueles sob metformina. A creatinina sérica representou o único fator preditor independente da concentração de lactatos. A presença de hiperlactacidemia condicionou um pior prognóstico.
Palavras-chave: Diabetes Mellitus Tipo 2; Metformina; Hiperlactacidemia; Portugal; Serviço de Urgência.
INTRODUCTION
Metformin is consensual among major international recommendations for type-2 diabetes initial therapeutic approach.1-4 The choice of this drug in diabetes treatment is sustained through its capacity for reducing blood glucose without allowing for the presence of hypoglycaemia, its association with several metabolic benefits and concomitant acceptable safety profile.. Its major anti-diabetic mechanism
is related to a reduction in hepatic glucose production (neoglucogenesis), also functioning as an insulin sensitizer and a modulator of components of the incretin axis, reducing glucose gastrointestinal absorption and indirectly promoting β-cell function. Metformin´s preferential action on the hepatocyte derives from an increase in OCT1 (organic cation transporter 1) expression in these cells. At the intracellular
35
35 ano
s a p
rom
ov
er
as
ciê
CA
P
ORT
UGUE
SA
ARTIGO ORIGINAL
level, it seems to have an effect through inhibition of the mitochondrial respiratory chain complex I, reducing cell energy status, activating the AMPK (AMP activated protein kinase) sensor and affecting neoglucogenesis.5
The most frequent adverse effect related to the use of metformin is the accumulation of lactic acid and the development of acidosis. Lactate plasma levels result from a balance between synthesis and utilization. Lactic acid is produced in the muscle, adipose tissue and liver through glucose anaerobic metabolism. It is quickly buffered, partly through extracellular bicarbonate, resulting in the formation of lactate. Then it is subjected to hepatic and to a less extent to renal metabolism, in order to regenerate pyruvate. Pyruvate is in turn converted to carbon dioxide and water or to glucose, the latter as a result of neoglucogenesis.6
Metformin may result in an increase of serum lactate levels in patients with diabetes due to neoglucogenesis inhibition, a predisposition to anaerobic metabolism and the production of lactate in the bowel.7 However, it seems that in order for hyperlactacidemia or even for lactic acidosis to occur, an acute event is required. Metformin-related lactic acidosis production mechanisms are not fully understood. It seems to occur as a result of acute events preventing lactate removal, in conditions increasing plasma lactate levels inducing its accumulation in the context of a reduced clearance (sepsis, ischaemia, etc.) or even situations in which there is a severe increase of metformin serum levels, in the context of metformin chronic administration.8
Factors not directly related to diabetes treatment such as body weight, blood pressure, blood glucose, renal function and the use of non-steroidal anti-inflammatory drugs or angiotensin-converting enzyme inhibitors also seem to influence lactate levels.9-11 There is also some controversy
regarding the concept whether metformin use on its own is responsible for an increase in serum lactate levels in patients with diabetes.
Despite recent therapeutic improvements and progress in haemodialysis techniques, mortality related to lactic acidosis is still very high12,13 and, even when it does not produce acidosis, relative hyperlactacidemia is associated with an increase in critically-affected patients’ hospital mortality.12 As most patients with hyperlactacidemia or lactic acidosis are asymptomatic, it is extremely important to identify reliable markers that show an increased risk for its development.
Our study aimed to assess the prevalence of hyperlactacidemia in patients with type-2 diabetes attending the Emergency Department; to quantify the relative risk of hyperlactacidemia in patients with diabetes treated with metformin; to identify independent predictive factors of lactate content and to determine the influence of lactacidemia in clinical outcome.
MATERIAL AND METHODS Population and data sources
This was a cross-sectional observational study with random selection of patients with type-2 diabetes that
attended an Emergency Room between June and October 2012. These patients were observed for complaints other than those apparently related to diabetes. A biochemical analysis (including renal and liver function and ultrasensitive CPR levels) and arterial blood gases (with lactate levels) were obtained at admission. Non-diabetic patients attending the Emergency Room during the same time period were selected as controls. Patients with a type-2 diabetes diagnosis were included in the study if they were treated with nutritional therapy and/or with oral anti-diabetic drugs for more than six months regardless of age. Those over 60 years of age at the time of diagnosis, regardless of the treatment; patients between the ages of 40 and 60 without a requirement for insulin therapy after three months upon the diagnosis of diabetes and with body mass index (BMI) above 30 kg/m² were also considered.
The exclusion criteria were as follows: patients with type-1 diabetes or with diabetes secondary to another disease; pregnant women; previously known health conditions contra-indicating metformin treatment, particularly cardiac failure NYHA (New York Heart Association)class III-IV , chronic kidney disease (glomerular filtration rate < 60 mL/ min/ 1.73 m2), liver failure (or liver enzymes > 3x above normal levels), chronic respiratory failure (or paO2 levels < 25 mmHg); kidney or liver transplant patients; acute cardiovascular events including cardiac failure; hypovolemia or haemodynamic instability; active alcohol abuse; HIV infection; sepsis; acute trauma or major surgical procedure; short-bowel syndrome; congenital or enzyme deficiencies; major seizures; hypothermia; severe asthma; carbon monoxide intoxication; pheochromocytoma and invasive cancer.
We selected 843 patients, of which 622 presented exclusion criteria. Eighty-three non-diabetic and 138 diabetic patients were included, from which 65 patients were treated with metformin. A total of 221 patients were included in our study, including 106 (47.8%) male, with mean 75 ± 11.6 (37-97) years of age.
The reason for attending the Emergency Room was collected and included unspecific disorders of consciousness / urinary tract disorders / cardio-respiratory disorders / gastro-intestinal disorders / fever of unknown origin / skin disorders / orthopaedic disorders or obesity / usual drug treatment (with dosage) / blood pressure at admission (mmHg) and patient’s destiny upon Emergency Room clinical attendance (discharge/admission/outpatient/ death). Obesity was defined as BMI ≥ 30 Kg/m². A history of cardiac failure clinical history and chronic obstructive pulmonary disease (COPD) was also recorded.
ARTIGO ORIGINAL
defined as between 0.0 and 2.0 mmol/L. Hyperlactacidemia was defined as a lactate level ≥ 2 mmol/L and a significant hyperlactacidemia as ≥ 4 mmol/L. Lactic acidosis was defined as pH < 7.35 with lactate > 4 mmol/L (with anion gap ≥ 15 mEq/L in association with metabolic or mixed acidosis).
Statistical analysis
In order to globally characterize our group of patients numerical variables are presented as mean ± standard deviation and qualitative variables in absolute and relative frequencies. The Chi-square independence test was used for univariate analysis and Students’ t-test for independent
samples. Linear regression was used for the analysis of the objectives of the study, using the stepwise method, in order to determine which variables had a statistically significant effect on lactate. Logistic regression was used, to determine which factors influence hyperlactacidemia and patient’s outcome, using the forward method. A ROC (receiving operating characteristic) curve was used to determine the ideal creatinine cut-off for the identification of a significant hyperlactacidemia. Statistical analysis used IBM’s SPSS software version 21.0 (SPSS; IBM Corporation, New York, New York, USA). A level of p < 0.05 was considered as statistically significant.
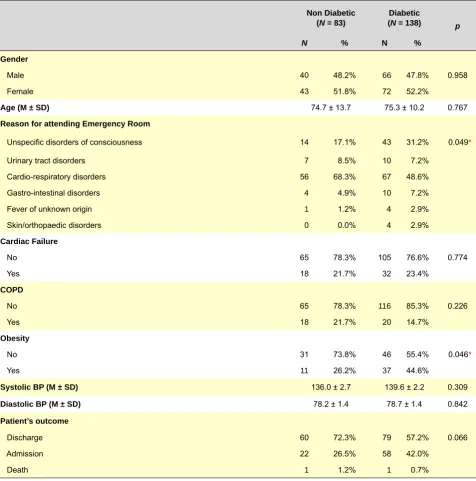
Table 1 – Comparison of clinical characteristics between diabetic and non-diabetic patients
Non Diabetic (N = 83)
Diabetic
(N = 138) p
N % N %
Gender
Male 40 48.2% 66 47.8% 0.958
Female 43 51.8% 72 52.2%
Age (M ± SD) 74.7 ± 13.7 75.3 ± 10.2 0.767
Reason for attending Emergency Room
Unspecific disorders of consciousness 14 17.1% 43 31.2% 0.049*
Urinary tract disorders 7 8.5% 10 7.2%
Cardio-respiratory disorders 56 68.3% 67 48.6%
Gastro-intestinal disorders 4 4.9% 10 7.2%
Fever of unknown origin 1 1.2% 4 2.9%
Skin/orthopaedic disorders 0 0.0% 4 2.9%
Cardiac Failure
No 65 78.3% 105 76.6% 0.774
Yes 18 21.7% 32 23.4%
COPD
No 65 78.3% 116 85.3% 0.226
Yes 18 21.7% 20 14.7%
Obesity
No 31 73.8% 46 55.4% 0.046*
Yes 11 26.2% 37 44.6%
Systolic BP (M ± SD) 136.0 ± 2.7 139.6 ± 2.2 0.309
Diastolic BP (M ± SD) 78.2 ± 1.4 78.7 ± 1.4 0.842
Patient’s outcome
Discharge 60 72.3% 79 57.2% 0.066
Admission 22 26.5% 58 42.0%
Death 1 1.2% 1 0.7%
ARTIGO ORIGINAL
RESULTS
Patient characteristics
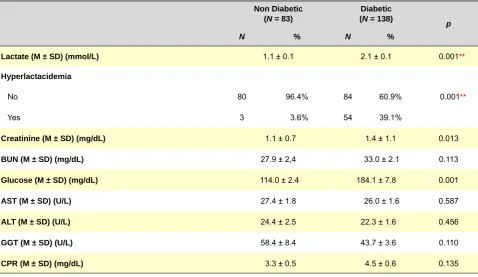
Tables 1 and 2 present the results of the univariate analysis of the different variables used in the study (demographic, clinical, analytical and therapeutic), irrespective of diabetes. Regarding the motive for attending the Emergency Department, 68.3% of non-diabetic patients presented cardio-respiratory symptoms versus 48.6% in patients with diabetes and unspecific disorders of consciousness occurred in 17.1% of non-diabetic patients versus 31.2% in diabetics. A higher percentage of obesity was observed in diabetic patients (44.6% vs. 26.2%). Patients with diabetes presented higher mean levels of creatinine (1.4 ± 0.1 vs. 1.1 ± 0.1, p < 0.05) and glucose (184.1 ± 7.8. vs. 114.0 ± 2.4, p < 0.01). Lactacidemia mean levels were significantly higher in patients with diabetes (2.1 ± 0.1 vs. 1.1 ± 0.1) as well as the proportion of patients with hyperlactacidemia (39.1% vs. 3.6%).
Table 3 presents the characterization of patients with diabetes irrespective of metformin treatment, focusing on differences identified between the study and control groups. A high number of patients with diabetes were not under any diabetes medication and only 66 patients were treated with metformin. These patients were significantly younger (73.5 ± 1.3 vs. 76.9 ± 1.2), with lower creatinine mean levels (1.2 ± 0.1 vs. 1.5 ± 0.1) and significantly higher mean levels of lactic acid (2.7 ± 0.2 vs. 1.6 ± 0.1). Only 23.3% of the patients not under metformin presented hyperlactacidemia, when compared with 56.9% of the patients treated with metformin (p < 0.001).
The distribution of plasma lactate in both groups is shown in Fig. 1.
Lactic acidosis was diagnosed in 5 patients, all of which were treated with metformin and presented in acute kidney failure. Table 4 presents the drug therapy in our group of patients. The patients under metformin were treated, on average, with 1,568 ± 533.5 (500 – 3,000) mg/day.
Factors influencing lactate levels
Based on a logistics regression analysis using lactacidemia as a dependent variable, metformin conferred a risk for hyperlactacidemia in diabetic patients vs. the remaining patients (OR = 25.1; p < 0.01). This odds ratio is enhanced by obesity (OR = 9.15; p < 0.05) and the value of glycaemia (OR = 1.02; p < 0.05) and inversely correlated with blood pressure (OR = 0.93; p < 0.05).
When specifically analysing the patients with diabetes treated with metformin, Spearman correlation revealed that the levels of lactic acid were positively correlated with the dose of metformin (r = 0.49, p < 0.01), creatinine (r = 0.267, p < 0.05) and glucose concentrations (r = 0.23, p < 0.01) and negatively correlated with pH (r = -0.381, p < 0.01) and the arterial content of HCO3 (r = -0.558, p < 0.01). We observed the absence of a significant correlation between metformin therapy and patient’s age, drugs used, partial O2 and CO2 pressure, AST, ALT, GGT, CPR, systolic and diastolic blood pressure. However, the stepwise multiple regression analysis revealed that creatinine represented the only independent factor influencing lactate levels (B = 1.33; p < 0.05) in these patients.
Effect of creatinine levels on lactate levels
In order to determine a creatinine cut-off level to identify significant hyperlactacidemia, the area under the curve
Table 2 – Comparison of biochemical characteristics between diabetic and non-diabetic patients
Non Diabetic (N = 83)
Diabetic (N = 138)
p
N % N %
Lactate (M ± SD) (mmol/L) 1.1 ± 0.1 2.1 ± 0.1 0.001**
Hyperlactacidemia
No 80 96.4% 84 60.9% 0.001**
Yes 3 3.6% 54 39.1%
Creatinine (M ± SD) (mg/dL) 1.1 ± 0.7 1.4 ± 1.1 0.013
BUN (M ± SD) (mg/dL) 27.9 ± 2,4 33.0 ± 2.1 0.113
Glucose (M ± SD) (mg/dL) 114.0 ± 2.4 184.1 ± 7.8 0.001
AST (M ± SD) (U/L) 27.4 ± 1.8 26.0 ± 1.6 0.587
ALT (M ± SD) (U/L) 24.4 ± 2.5 22.3 ± 1.6 0.456
GGT (M ± SD) (U/L) 58.4 ± 8.4 43.7 ± 3.6 0.110
CPR (M ± SD) (mg/dL) 3.3 ± 0.5 4.5 ± 0.6 0.135
ARTIGO ORIGINAL
(AUC) of the ROC curve was optimized using the Younden index and the closest to the (0.1) point on the ROC curve. The estimated AUC was 0.766 (95% CI: 0.584 – 0.936; p = 0.005) and the creatinine cut-off level was defined as 1.145 mg/dL, with a 90.0% sensitivity and a 66% specificity to
predict significant hyperlactacidemia (Fig. 2).
Effect of hyperlactacidemia on patient’s outcome Finally, we analysed which factors had a statistically significant influence on patient’s outcome (hospital
Table 3 – Comparison of clinical and biochemical characteristics in patients with diabetes according to metformin treatment
Non-treated with Metformin
(N = 73)
Treated with Metformin
(N = 65) p
N % N %
Gender
Male 33 45.2% 33 50.8% 0.514
Female 40 54.8% 32 49.2%
Age (M ± SD) 76.9 ± 10.1 73.5 ± 10.1 0.046*
Obesity
No 24 58.5% 22 52.4% 0.573
Yes 17 41.5% 20 47.6%
Lactate (M ± SD) (mmol/L) 1.6 ± 0.1 2.7 ± 0.2 0.001**
Hyperlactacidemia
No 56 76.7% 28 43.1% 0.001**
Yes 17 23.3% 37 56.9%
Creatinine (M ± SD) (mg/dL) 1.5 ± 0.9 1.2 ± 1.1 0.048
Glucose (M ± SD) (mg/dL) 181.5 ± 10.2 187.0 ± 12.0 0.724
* p < 0.05; ** p < 0.01; M: Mean; SD: Standard Deviation
1.5%
41.5%
27.7%
15.4%
7.6%
4.6% 19.2%
58.9%
17.8%
4.1%
0.0% 0.0%
0 - 1 1.1 - 2 2.1 - 3 3.1 - 4 4.1 - 5 > 5
Figure 1 – Frequency histograms showing the percentage distribution based on the lactate level in patients according to metformin treatment (not treated - green; treated -blue).
ARTIGO ORIGINAL
admission or death vs. discharge). Most patients were discharged from hospital (51.4%, n = 113), slightly more than one third of these (35%, n = 77) needed to be admitted and almost all the remaining were referred for outpatient follow-up (12.7%, n = 28). Only two patients died (0.9%, n = 2).
We found that the presence of infection, showed by an increase of CRP levels (OR = 1.10; 95% CI: 1.01 – 1.19: p < 0.01) and by hyperlactacidemia (OR = 4.37; 95% CI: 1.71
Figure 2 – ROC (Receiver Operating Characteristic) curve of creatinine levels for detection of a significant hyperlactacidemia in patients with diabetes treated with metformin
– 11.82: p < 0.05) had a negative and independent influence on patient’s outcome, increasing the possibility of hospital admission or mortality. Regarding hyperlactacidemia, its presence increased 4.4 times the odds ratio of admission or mortality, when compared with patients with lactate levels within normal values. In addition, admitted patients with hyperlactacidemia presented a longer hospital stay (21.66 ± 5.86 days vs. 13.68 ± 5.33 days, p < 0.001) and a higher mortality during the hospital stay (12.5% (n = 4) vs. 4.3% (n = 2), p < 0.05).
DISCUSSION
Previous studies demonstrated a 45% increase in the lactate turnover basal rate in patients with diabetes, which would be in line with an increase in its plasma content.14 Accordingly, in the present study, patients with diabetes presented in fact significantly higher lactate levels than the remaining patients who attended the Emergency Department. In addition, in our study, although significantly younger and with lower serum creatinine levels, the patients with diabetes treated with metformin presented significantly higher lactate levels when compared with patients on other therapeutic regimens, showing that the effect of metformin on the glucose and lactate metabolism significantly increases the ability to develop hyperlactacidemia in patients with diabetes.
Beyond diabetes therapy, the lactate plasma levels were correlated with several other variables. The association between hyperlactacidemia and obesity has been already described in other studies.9,15 The mechanism is not fully understood, although it seems to result from tissue
Table 4 – Diabetes therapy of patients with diabetes attending the Emergency Room
Diabetes therapy N %
Non-pharmacologic 99 44.8
Metformin 30 13.6
Sulphonylurea 11 5.0
DPP4 inhibitor 3 1.4
Insulin 41 18.6
Metformin + DPP4 inhibitor 16 7.2
Metformin + DPP4 inhibitor + Insulin 3 1.4
Metformin + Insulin 4 1.8
Metformin + Sulphonylurea + Acarbose 3 1.4
Metformin + Sulphonylurea 6 2.7
Metformin + DPP4 inhibitor + Sulphonylurea 4 1.8
Insulin + DPP4 inhibitor 1 0.5
ROC curve
Specificity
0.0 0.0 0.1 0.2 0.3 0.4 0.5 0.6 0.7 0.8 0.9 1.0
0.1 0.2 0.3 0.4 0.5 0.6 0.7 0.8 0.9 1.0
ARTIGO ORIGINAL environment oxygen deficiency, induced by obesity and by insulin resistance which, by activating anareobic glycolysis,
induces an increase in the production and release of lactic acid by adipose tissue.9 In addition, we also found
a positive correlation between lactate and glucose serum levels. This association may be explained by a decrease in renal perfusion caused by the osmotic diuresis induced by hyperglycaemia.16
Therefore, the increase in lactate plasma levels observed in patients with type-2 diabetes can be the result of a combination between a global decrease in oxidative capacity, secondary to the change in lactate metabolism, accentuated by treatment with metformin which would have a crucial role, increasing lactic acid release by adipose tissue and decreasing renal excretion.
When specifically analysing patients with diabetes treated with metformin, we found that although more than half of the patients present lactate levels above 2 mmol/L only five patients met lactic acidosis criteria, reducing the clinical impact of lactacidemia as a risk indicator in these patients. In our study, lactic acidosis associated with metformin occurred in patients with acute co-morbidities which might on their own cause acidosis. Nevertheless, as serum bicarbonate level correlates negatively with the lactate level, in line with the pH value, it may be used as a tissue acidosis marker and a simple indicator of acid-base status, being more suitable than lactate plasma level to monitor the risk of lactic acidosis. The assessment of acid-base balance must therefore be obtained for each patient, in order to minimize the risk of acidosis development. Clinical reports of metformin-related lactic acidosis are still being published, which are very important, due to the associated high mortality which in some studies reaches 50%.17 In our group of patients, lactacidemia still presented a positive correlation with the daily dose of metformin, assuming a higher risk of hyperlactacidemia in patients with diabetes on higher therapeutic doses. However, when we adjusted for all described variables and in line with other studies18 the simple use of the drug, regardless of the dose, predicts the risk of hyperlactacidemia. We should remark that, in the event of an acute episode or hyperlactacidemia, metformin should be stopped, as a dose reduction probably would not be sufficient as a preventative measure.
The estimated glomerular filtration rate should not be applied in an emergency context19 and therefore the
creatinine level remains a more reliable and reproducible marker of kidney function. In our analysis, creatinine has represented the single independent factor capable of influencing lactate level in patients with diabetes treated with metformin, with a stepwise increase in lactacidemia according to the levels of creatinine. The ideal cut-off limit to indicate significant hyperlactacidemia is 1.145 mg/dl, with a 90% sensitivity and a 66% sensitivity, suggesting that lactate accumulation may occur before the development of severe renal dysfunction. Taking into account that these patients attended the Emergency Department, we cannot exclude the presence of previous unknown or undocumented renal
dysfunction. In fact, some studies have shown that the accumulation of metformin starts progressively in situations as renal failure when there is a failure to comply with current recommendations.20 Chronic drug accumulation associated with an acute triggering event could explain a higher predisposition to hyperlactacidemia in these patients, even in the absence of a strong increase in creatinine levels. Hyperlactacidemia represents an imbalance between production and use of lactate. Together with the presence of biological markers of infection or inflammation, as suggested by the CRP levels, it is an independent predictor of need for hospital admission or death, in patients attending the Emergency Department. This result is in line with other studies showing that high levels of lactate increase mortality and that the transition from a physiological to a pathological lactacidemia remained as a major risk marker. The lactate content as well as its course seems to influence critically-affected patient’s outcome.13 In our group of patients, we found that the patients with hyperlactacidemia presented longer hospital stays and higher mortality. Despite a reduced number of patients meeting these conditions presenting, in addition, with a higher number of co-morbidities, the patients with hyperlactacidemia at admission seemed to present a higher risk for adverse events, alerting for the need to search and treat other reversible causes.
Our study had a few limitations, including the fact that the patients were followed for a short time period and by several physicians. When the review of the clinical records was made, we found that most belonged to patients with no previous follow-up in our hospital and therefore some relevant clinical information was not available, namely disease duration, previous diabetes therapy, BMI precision and initial kidney function. Our study mainly included patients aged 60 to 80; a potential constraint regarding the generalisation of these results to most diabetic patients. Nevertheless, in the current social context, a large percentage of patients with type-2 diabetes are included in a similar age group as our group of patients. It may be useful to assess in the future the patients that present hyperlactacidemia and check if the lactate levels and if they keep their conditioning factors.
CONCLUSION
ARTIGO ORIGINAL
attending the Emergency Department, warranting its use as an adverse outcome marker.
ACKNOWLEDGEMENTS
The authors wish to acknowledge Isabel Fonseca,
as Director of the Emergency Room at Hospitais da
Universidade de Coimbra – Centro Hospitalar e Universitário de Coimbra for her availability and scientific cooperation, making this study possible.
CONFLICTS OF INTEREST
The authors declare there was no conflict of interests in writing this manuscript. Part of this study was
previously presented at the XIV Congresso Português de
Endocrinologia, 24-27 January 2013, Porto and at the 15th European Congress of Endocrinology, 27 April – 1 May 2013, Copenhagen.
FINANCIAL SOURCES
There were no financial sources for the writing of this manuscript.
REFERENCES
1. Qaseem A, Humphrey LL, Sweet DE, Starkey M, Shekelle P. Oral pharmacologic treatment of type 2 diabetes mellitus: a clinical practice guideline from the American College of Physicians. Ann Intern Med. 2012;156:218-31.
2. Inzucchi SE, Bergenstal RM, Buse JB, Diamant M, Ferrannini E, Nauck M, et al. Management of hyperglycaemia in type 2 diabetes: a patient-centered approach. Position statement of the American Diabetes As-sociation (ADA) and the European AsAs-sociation for the Study of Diabetes (EASD). Diabetologia. 2012;55:1577-6.
3. Standards of medical care in diabetes--2012. Diabetes Care. 2012;35:S11-63.
4. Rodbard HW, Jellinger PS, Davidson JA, Einhorn D, Garber AJ, Grun-berger G, et al. Statement by an American Association of Clinical En-docrinologists/American College of Endocrinology consensus panel on type 2 diabetes mellitus: an algorithm for glycemic control. Endocr Pract. 2009;15:540-59.
5. Viollet B, Guigas B, Sanz Garcia N, Leclerc J, Foretz M, Andreelli F. Cellular and molecular mechanisms of metformin: an overview. Clin Sci. 2012;122:253-70.
6. Kreisberg RA. Lactate homeostasis and lactic acidosis. Ann Intern Med. 1980;92:227-37.
7. Lalau JD. Lactic acidosis induced by metformin: incidence, manage-ment and prevention. Drug Saf. 2010;33:727-40.
8. Perrone J, Phillips C, Gaieski D. Occult metformin toxicity in three pa-tients with profound lactic acidosis. J Emerg Med. 2011;40:271-5. 9. Liu F, Lu JX, Tang JL, Li L, Lu HJ, Hou XH, et al. Relationship of plasma
creatinine and lactic acid in type 2 diabetic patients without renal dys-function. Chin Med J. 2009;122:2547-53.
10. Franzetti I, Paolo D, Marco G, Emanuela M, Elisabetta Z, Renato U. Pos-sible synergistic effect of metformin and enalapril on the development of hyperkaliemic lactic acidosis. Diabetes Res Clin Pract. 1997;38:173-6.
11. Chan NN, Fauvel NJ, Feher MD. Non-steroidal anti-inflammatory drugs and metformin: a cause for concern? Lancet. 1998;352:201.
12. Nichol AD, Egi M, Pettila V, Bellomo R, French C, Hart G, et al. Relative hyperlactatemia and hospital mortality in critically ill patients: a retro-spective multi-centre study. Crit Care. 2010;14:R25.
13. Kruse O, Grunnet N, Barfod C. Blood lactate as a predictor for in-hospi-tal morin-hospi-tality in patients admitted acutely to hospiin-hospi-tal: a systematic review. Scand J Trauma Resusc Emerg Med. 2011;19:74.
14. Cusi K, Consoli A, DeFronzo RA. Metabolic effects of metformin on glu-cose and lactate metabolism in noninsulin-dependent diabetes mellitus. J Clin Endocrinol Metab.1996;81:4059-67.
15. Crawford SO, Ambrose MS, Hoogeveen RC, Brancati FL, Ballantyne CM, Young JH. Association of lactate with blood pressure before and after rapid weight loss. Am J Hypertens. 2008;21:1337-42.
16. Pepper GM, Schwartz M. Lactic acidosis associated with Glucophage use in a man with normal renal and hepatic function. Diabetes Care. 1997;20:232-3.
17. Bruijstens LA, van Luin M, Buscher-Jungerhans PM, Bosch FH. Reality of severe metformin-induced lactic acidosis in the absence of chronic renal impairment. Neth J Med. 2008;66:185-90.
18. Davis TM, Jackson D, Davis WA, Bruce DG, Chubb P. The relation-ship between metformin therapy and the fasting plasma lactate in type 2 diabetes: The Fremantle Diabetes Study. Br J Clin Pharmacol. 2001;52:137-44.
19. Martin JH, Fay MF, Ungerer JP. eGFR--use beyond the evidence. Med J Aust. 2009;190:197-9.