ISSN: 2339-076X (p); 2502-2458 (e)
,
Volume 7, Number 2 (January 2020): 2059-2064
DOI:10.15243/jdmlm.2020.072.2059
www.jdmlm.ub.ac.id 2059
Research Article
Determination of cumulative rainfall threshold trigger of landslides in
Grindulu watershed as an early warning effort
Arina Miardini
*, Pranatasari Dyah Susanti
Watershed Management Technology Center, Jl. A. Yani- PO BOX 295, Pabelan, Surakarta, Indonesia *corresponding author: rinamiardini@gmail.com
Received 24 November 2019, Accepted 11 December 2019
Abstract:
Landslides are one of the natural disasters that cause severe damage to life. The frequency of landslide has increased with global climate change and population growth, so early warning efforts are needed. Rain is a trigger factor for landslides can be used as an approximate model for disaster prevention and mitigation through the estimation of rainfall threshold. The purpose of this study was to determine the characteristics and threshold of rainfall that triggered landslides in the Grindulu watershed. The method used is the Cumulative Rainfall Threshold (CT), this method compares the amount of rainfall for the last 3 days (72 hours) with rainfall 15 days before. In the Grindulu watershed, landslides occur during 3-day cumulative daily rains ranging from 23-464 mm, whereas in the 15 days before the events range between 67-756.5 mm. Estimates of lower threshold rainfall are determined linear so that the equation P3 = 0.4675 P15-46.9 is obtained with the value R2 = 0.5774The threshold value of rainfall triggers a landslide in the Grindulu watershed when the cumulative rainfall of 3 days is 40 mm and 15 days before the event is 320 mm. The determination of rain threshold is expected to increase community preparedness for landslides. Keywords: Grindulu watershed threshold, landslide, rain, triggerTo cite this article: Miardini, A. andSusanti, P.D. 2020. Determination of cumulative rainfall threshold trigger of landslides in Grindulu watershed as an early warning effort. J. Degrade. Min. Land Manage. 7(2): 2059-2064, DOI: 10.15243/jdmlm. 2020.072.2059.
Introduction
Natural disasters and related disasters such as landslides, floods, droughts and storms have increased in intensity and frequency (FAO, 2017) including several regions in Indonesia (Rusli and Ulya, 2018). Landslides are defined as the movement of slopes from soil, rocks, and organic matter under the influence of gravity and also the landforms produced by these movements (Highland and Bobrowsky, 2008). Landslides are influenced by several factors including land, geomorphological processes, physical processes and human factors (Parkash, 2012). According to Harjadi et al. (2016), there are three factors that cause landslides. Major factors consist of slopes, faults, texture, regolith depth, and geology, while minor factors consist of slope shape, aggregation, permeability, drainage and structure) as well as triggering factors namely nature (rainfall and soil
movement) and man-made (upright cliff cutting) and slope loads). Landslide is one of the natural disasters that can cause severe damage to life, the risk of landslides also tends to increase along with global climate change and population growth (Singh, 2015).
Journal of Degraded and Mining Lands Management 2060 cannot be obtained data (Polemio and Petrucci,
2000).
The purpose of this study was to determine the characteristics and threshold of rainfall that triggered landslides in the Grindulu watershed. A watershed can be used as a management unit in disaster risk management. According to FAO (2017), watershed management will have a greater influence if it combines disaster risk management actions such as hazard assessment, mapping and zoning, early warning systems, disaster risk reduction interventions and increased investment in disaster prevention.
Grindulu watershed is one of the watersheds that often experience landslides. The Grindulu watershed covers 3 districts, with the dominant district in Pacitan Regency. Landslides are the highest intensity disasters that occur in Pacitan Regency. Recorded in the period between 2010-2019 there have been 101 disasters in Pacitan
District, and 55 incidents have been landslides (National Disaster Management Agency, 2019. Through this research, it is expected to be able to identify the threshold values and characteristics of rain that triggered landslides in the Grindulu watershed as an early warning effort and to increase community preparedness for landslides.
Materials and Methods
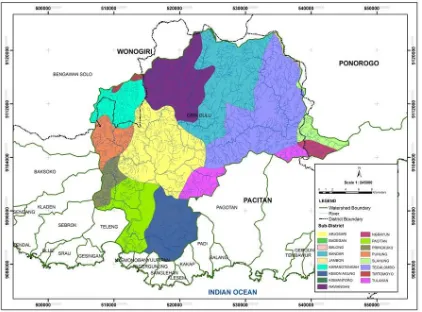
The study was conducted in the Grindulu watershed in 2019. The Grindulu watershed has an area of 71518.54 ha. Administratively the Grindulu watershed covers three regencies, namely, Pacitan Regency with an area of 64708.48 ha (90.48%), Ponorogo Regency with an area of 2715.46 ha (3.80%), and Wonogiri Regency with an area of 4094.60 ha (5, 73%). The research location can be seen in Figure 1.
Figure 1. Research location in the Grindulu watershed.
Climatic conditions in the Grindulu watershed are classified as type C, based on the Schmidt & Ferguson classification. The rainfall in the Grindulu watershed is 2165 mm / year with an average temperature of 27.4%. Topographical conditions in the Grindulu watershed are
Journal of Degraded and Mining Lands Management 2061 into three zones, namely: a) Myosine Sedimentary
Facies (Alluvium Plain). b) Structural hills (Andesite), and c) Sewu Mountains (limestone).
The materials used in this study included Grindulu watershed and DAS boundary maps, RBI map Scale 1: 25000, daily rainfall data BBWS Bengawan Solo for 2012-2019 obtained from 4 stations namely Slahung, Pacitan, Nawangan and Kebonagung. Landslide event data in the form of date and coordinates were obtained from BNPB, ESDM and BPDAS Solo. The tools used included Notebook, Arc GIS 10.2 Software and Microsoft Word and Excel. The rainfall data used at each
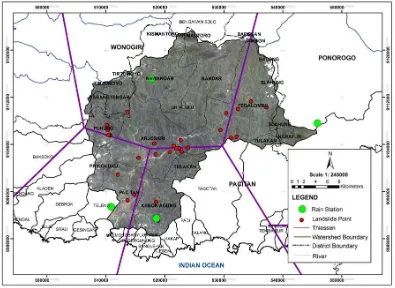
point of the landslide is adjusted to the nearest rain station to the area coverage using the Thiessen polygon. According to (Pratiwi and Hadiani, 2016) the use of this method can describe the weight at each rain station and can represent the area around the station. The location of the rain-typing station and the landslide point in the Grindulu watershed is shown in Figure 2. The landslide that occurred in the Grindulu watershed in 2012 to 2019 was recorded at 30 points. Rainfall data coverage is based on Thiessen polygons at Nawangan Station with 16 landslides, Slahung with 6 landslides, Pacitan and Kebonagung with 4 landslides each.
Figure 2. Location of a rain gauge and landslide point in the Grindulu watershed.
Daily rainfall data and landslide events were used to determine rainfall thresholds that triggered landslides as part of an early warning effort for landslides in the Grindulu watershed. According to Susanti and Miardini (2016), the main trigger for landslides is rainfall, so that daily rainfall information becomes very important information for areas prone to landslides.
Determination of cumulative rainfall threshold that triggers landslides was done using the Cumulative Rainfall Threshold (CT) method by (Chleborad et al., 2006). The concept of this method is to compare the amount of rainfall in the last 3 days (72 hours) with the rainfall of the previous 15 days. Determination of rainfall threshold values that trigger landslides was plotted
in a scatter chart with the x-axis, namely the cumulative rainfall value 15 days before 72 hours of occurrence (P15) and the y-axis of 72 hours cumulative rainfall (P3). The CT method is based on the historical analysis of rainfall data during landslides. Determination of cumulative rainfall threshold that triggers landslides is done with the following equation:
P3 = -aP15 + b where:
P3 = 72-hour cumulative rainfall P15 = cumulative rainfall 15 days before
72 hours
Journal of Degraded and Mining Lands Management 2062 The magnitude of P3 and P15 were plotted in a
scatter to obtain the regression equation so that the values of a and b can be identified which are then used to calculate the threshold value of rainfall that causes landslides. According to Sipayung et al. (2014), determining the prediction of potential landslides is obtained based on the value of the landslide potential index (P0) approached by the equation P0 = P3 - (- aP15 + b), if the value of P0> 0, then the potential for landslides and if P0 <0, then there is no potential for landslides.
Results and Discussion
Landslides and cumulative rain
The result of the tabulation of data and information on landslides and cumulative rainfall in the Grindulu watershed is presented in Table 1. Data presented in Table 1 show that there were 30
landslides with different locations in the period 2012-2019. The highest intensity of landslides was in 2014 with 7 events. Based on the monitoring of the cumulative amount of rainfall presented in Table 1 it can also be seen that the landslide event has accumulated 3 days and 15 days before the landslide event. In 3 days rainfall ranged from 23 to 464 mm, whereas in the 15 days before the event ranged from 67 to 756.5 mm.
Rainfall threshold
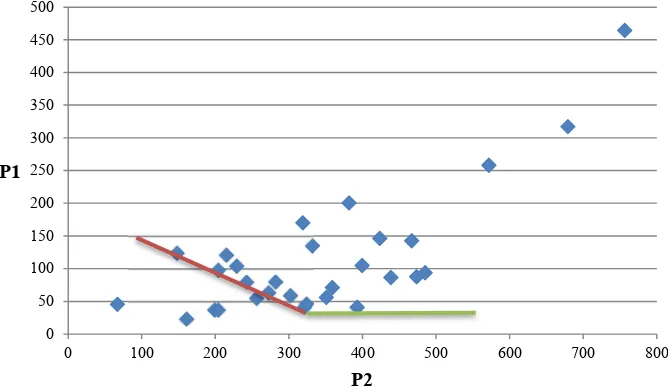
Based on the distribution of plots, the estimated lower threshold rainfall threshold was linearly determined so that the equation P3 = 0.4675 P15-46.9 was obtained with the value R2 = 0.5774. Determination of the threshold value that was determined based on the value of the meeting between the red and green lines is shown in Figure 3.
Table 1. The time of landslides and cumulative rain.
No Date x y Rainfall
station
Cumulative 3 days rainfall
Cumulative 15 days rainfall
Journal of Degraded and Mining Lands Management 2063
Figure 3. Empirical Equation of cumulative rainfall 3 days before landslide (P3) and 15 days before P3 (P15).
According to Chleborad et al. (2006), the intended rainfall threshold is that the estimated lower threshold of rainfall determined does not cause landslides, or rarely occur and over it can occur under certain conditions. The red line represents the lower threshold of landslides occurring when rainfall 15 days earlier was less than 320 mm, while the green line showed a lower threshold that might trigger landslides with rainfall intensity 15 days before the event exceeded 320 mm. The 3-day cumulative rainfall threshold value at 40 mm is a lower rainfall value which might trigger a landslide.
Research conducted by Irawan et al. (2019) in the Banjarmangu District of Banjarnegara Regency showed that the cumulative rainfall of 3 days was 40 mm and 15 days before the event was 200 mm was a threshold value that needed to be watched because it allowed landslides to occur. This shows that the threshold value of rainfall that triggers the occurrence of landslides is relatively different according to the characteristics of landslide vulnerability at the study site. Hidayat and Zahro (2018) reported that this trigger factor was highly dependent on the hydrological response, pore water pressure and water content at each location. According to Karimah et al. (2019), different characteristics of regions in Indonesia will cause different rainfall and extreme rainfall thresholds.
Landslides can occur due to the weakening of soil resilience due to increased pore water and ground water levels (Atikah et al., 2017). Increased pore water and ground water levels can occur
quickly or slowly. According to Hidayat and Zahro (2018), landslide events can occur not only when the intensity of rain is high, but can also occur when the intensity of rain has decreased. Based on this, the vigilance of the people living in areas with high landslide vulnerabilities should increase their vigilance when the rainy season arrives.
Conclusion
The threshold value of rainfall triggers a landslide in the Grindulu watershed when the cumulative rainfall of 3 days was 40 mm and 15 days before the event is 320 mm. The result of the threshold value that triggers the landslide is very dependent on the characteristics and the level of vulnerability of each area, so it is necessary to analyze the occurrence of landslides at different levels of vulnerability.
Acknowledgements
The authors thank to the Head of BPPTPDAS for the opportunity given to carry out this research. In addition, thanks are also expressed to fellow BPPTPDAS technicians who have helped carrying out this research.
References
Atikah, D., Juwono, P.T. and Hendrawan, A.P. 2017. The effect of rain at slope stability in Gempol - Pandaan road toll. Jurnal Teknik Pengairan 8(1): 79-88 (in Indonesian).
Chleborad, A.F., Baum, R.L. and Godt, J.W. 2006. Rainfall Thresholds for Forecasting Landslides in
0 50 100 150 200 250 300 350 400 450 500
0 100 200 300 400 500 600 700 800
P1
Journal of Degraded and Mining Lands Management 2064 the Seattle, Washington, Area - Exceedance and
Probability. Virginia: U.S. Geological Survey. FAO. 2017. Watershed Management in Action. Rome:
FAO.
Glade, T., Crozier, M. and Smith, P. 2000. Applying probability determination to refine landslide-triggering rainfall thresholds using an empirical antecedent daily rainfall model. Pure and Applied Geophysics 157(6-8): 1059–1079.
Harjadi, B., 2016. Disaster Mitigation Techniques (Flood and Landslide) in Java Island. Watershed Technology Management Center (in Indonesian). Hidayat, R. and Zahro, A. 2018. Rainfall Identification
of a Trigger for a Landslide in Serayu Hulu Watershed-Banjarnegara. Geography National Conference, Muhammadiyah Surakarta University IX 2018. Pp. 41-50. Surakarta (in Indonesian). Highland, L.M. and Bobrowsky, P. 2008. The Landslide
Handbook - A Guide to Understanding Landslides. Virginia: U.S. Geological Survey.
Irawan, A. M., Virgianto, R. H., Safril, A., Munawar, Gustono, S. T. and Putranto, N.D. 2019. Rainfall threshold and soil moisture indexes for the initiation of landslides in Banjarmangu sub-district, Central Java, Indonesia. IOP Conference Series:Earth and
Environmental Science 243 (2019) 012028,
doi:10.1088/1755-1315/243/1/012028.
Karimah, Y., Wigena, A.H. and Soleh, A. M. 2019. Determination of the threshold value of generalized Pareto distribution with a measure of surprise.
Indonesian Journal of Statistics and Its Applications
3(2): 161-168 (in Indonesian).
Kuo, H., Lin, G., Chen, C., Saito, H., Lin, C., Chen, H. and Chao, W. 2018. Evaluating critical rainfall conditions for large-scale landslides by detecting event times from seismic records. Natural Hazards and Earth System Sciences 18: 2877-2891.
National Disaster Management Agency. 2019. Indonesian Disaster Information Data (in Indonesian).
Parkash, S. 2012. Training Module on Comprehensive Landslides Risk Management (First). New Delhi: Chandu Press.
Polemio, M. and Petrucci, O. 2000. Rainfall as a Landslide Triggering Factor: an overview of recent international research. (E. Bromhead, N. Dixon, & M.-L. Ibsen, Eds.) (3rd ed.). London: Cardiff. Pratiwi, D. W. and Hadiani, R. 2016. Rain-Debit
Transformation based On Analysis of Tank Models and GR2M in Dengkeng Watershed. Sains and Technology National Conference 2016. Jakarta. The Faculty of Engineering, Muhammadiyah University, Jakarta (in Indonesian).
Rusli, and Ulya, A.F. 2018. The role of Malang City government to improve community preparedness in facing disaster (disaster management study). Jurnal Pendidikan Ilmu Pengetahuan Sosial 5(1): 1-13 (in Indonesian).
Singh, S.K. 2015. Landslide disaster: cause-effect and protective measures in India. Journal of Civil Engineering and Environmental Technology 2(15): 6-10.
Sipayung, S.B., Cholianawati, N., Susanti, I., Soni Aulia, R. Maryadi, E. 2014. Development of empirical equation model in predicting the occurrence of landslides at the watershed of Citarum (West Java) based on the TRMM satellite data. Jurnal Sains Dirgantara 12(1): 12-21 (in Indonesian).
Susanti, P.D. and Miardini, A. 2016. Vulnerability Analysis and Landslide Mitigation Techniques in the Merawu Sub-watershed. Geography National
Conference 2016, pp.139-150, Muhammadiyah