STUDIES ON THE TRANSPORT RELATED POLLUTANTS IN
THE AMBIENT ATMOSPHERE AND THEIR HEALTH
IMPACTS ON THE ROAD SIDE VENDERS OF THE INDIAN
CITY
A. Mani Prakash
[a]*, A.V.V.S. Swamy
[a], and R. Hema Krishna
[b]Keywords: transport emissions, air pollution, exposure assessment, roadside vendors, health hazards
The present study “on the transport related pollutants in the ambient atmosphere and their health impacts on the road side venders of the Indian city” has been carried out at Punjagutta station. The ambient air quality was measured in this traffic station and the monthly means were recorded. A 24 h cycle of hourly sampling was also carried out to assess the peak hour traffic concentrations of the ambient air quality parameters. The concentrations of Total Suspended Particulate Matter (TSPM), Respirable Suspended Particulate Matter (RSPM),
Sulphur Dioxide (SO2), Oxides of Nitrogen (NOx) and Carbon Monoxide (CO) were monitored and compared with the national standards.
The behaviour of the quality parameters of this station was described. It has been well established that the time of exposure and dose of the pollutants were positively correlated. The study included vendors who have been staying in the place for not less than three years. Monthly
mean concentrations of Respirable Suspended Particulate Matter (RSPM) were highest concentration of 154.16 µg m-3 at Punjagutta traffic
station during the study period. This concentrations have exceeded the prescribed National ambient air quality (NAAQ) standard for
RSPM i.e., 100 µg m-3.Monthly mean concentrations showed a maximum concentration of 6.49 µg m-3 of air of SO
2 at Punjagutta. The
monthly mean concentrations of oxides of nitrogen (NOx) were recorded at Punjagutta traffic station has shown maximum concentration of
40.16 µg m-3. Highest traffic volumes were recorded at Punjagutta station (44,954) The present study revealed that the pulmonary
functioning decreased among 61.5% of the roadside vendors and a considerable shift of the COHb levels in the blood to the higher side was observed in subject samples.
Corresponding Author: Tel: 001-647-502-6323 E-mail; [email protected]
[a]Department of Environmental Sciences, Acharya Nagarjuna
University, Nagarjuna Nager-522510, Guntur (Dist.), Andhra Pradesh, India.
[b]Department of Chemistry, University of Toronto, Ontario, Canada. M5S3H6
Introduction
Changes over recent decades in outdoor concentrations of air pollutants were well documented. Human exposure was defined by1 as ‘the event when a person comes into contact
with a pollutant of a certain concentration during a certain period of time’. This means that the exposure requires both the pollutant and the person to be present. Most of the epidemiological evidence of the health effects of relatively low concentrations of air pollutants, and in particular of fine particles, uses outdoor concentrations as a surrogate for human exposure. However, the impacts of air pollution on an individual’s health actually relate not to these outdoor concentrations but to their personal exposure in the different locations in which they spend time. Although the science of personal exposure assessment, with the associated measurement and modeling techniques, has developed to maturity in North America and Western Europe over the last 50 years, there is an urgent need to apply this science in other parts of the world where the effects of air pollution are now much more serious.2
The concentrations of ambient air pollutants which prevail in many urban areas were sufficiently high to cause increased mortality, morbidity, deficits in pulmonary function and cardiovascular and neurobehavioural effects.3-4
Ambient SPM of anthropogenic origin is emitted into the urban air by a whole host of sources and activities, or it is produced by photochemical processes that lead to the presence of fine aerosols less than 2.5 um in aerodynamic diameter. The anthropogenic SPM is much more toxic than the SPM of natural origin.5 Motor vehicles, certain
Figure 1. Satellite image of Pun jagutta traffic station
to monitor the ambient air quality at Punjagutta traffic station, by measuring the concentrations of TSPM, RSPM, SO2, NOx and Carbon Monoxide.
to ascertain the quality of air in the study area basing on the results of the monitoring and also to compare with the NAAQ Standards.
to correlate the concentrations of the quality parameters with the volume of the traffic and peak hour traffic.
to study the impact of traffic pollution on the health of roadside vendors, through pulmonary function test and carboxyhaemoglobin tests.
Experimental
Punjagutta: It is considered as the heart of the city. The roads were fully paved, and devoid of greenery. The vehicular mobility is high and continuous as this is a junction connecting all the four directions. This connects Khairatabad, Banjara hills, Jubilee hills, Hi-tech city, Secunderabad railway station and Bharat Heavy Electricals Limited (BHEL) was shown in Fig.1. Also many contract carriages to all corners of the state will have stopover at this station. There were good numbers of street vendors in this area. But the distribution of push carts like soda sellers, sugarcane juice sellers, fruit sellers and coconut sellers is sporadic because this junction has many radiating roads. As a very important hospital in the State of Andhra Pradesh i.e. Nizam Institute of Medical Sciences (NIMS), is located near to this station, the number of hotels, road side vendors were more.Location of the traffic stations selected for the present study shown in Table.1
Table 1. Location of the traffic stations selected for the present
study
Sl.No. Name of the
Traffic Station
Longitude Latitude
1 Punjagutta 170 25’ 36.08” N 780 27’ 08.84”E
Sampling of Suspended Particulate Matter (SPM)
The suspended particulate matter was collected in the six selected traffic stations using APM 460 Respirable Dust Sampler (Envirotech Pvt. Ltd., New Delhi). Monthly samples were collected from May 2006 to May 2008 in this station. Both Total Suspended Particulate Matter (TSPM) and Respirable Suspended Particulate Matter (RSPM) were collected and the values were expressed as µg/m3. The
RSPM was collected using glass fibre filter paper (Whatman GF/A Glass Microfiber Filter, Made in England). The TSPM was collected using the plastic cones supplied along with the sampler by Envirotech pvt. ltd., New Delhi, India. The cones were labelled with the sampling station and date of sampling.
The glass fibre filter paper which was pre-equilibrated for 24 h was taken after ensuring that there were no holes or other visible defects and placed on the mesh. The initial weight of the filter paper was recorded (W1) using an electronic balance (Dhona, 200 D). Final weight of the filter paper was also recorded (W2) after sampling. The initial weight of the cones used for collection of coarse particulates was recorded (C1) before inserting in the cyclone and final weight was recorded (C2) after the completion of the sampling.
Calculations
The concentrations of Respirable Suspended Particulate Matter (RSPM) and Total Suspended Particulate Matter (TSPM) in g m-3 were calculated using the formulas (1)
and (2)
PUNJAGUTTA SOURCE: Google Earth
(1)
3) 2 1 6
( g m W W *10
RSPM
Mr t
(2)
( ) ( )
3 2 1 2 1
( g m ) C C M M
TSPM
Mr t
where,
C1 initial weight of the cone (g)
C2 final weight of the cone (g)
W1 initial weight of the filter paper (g)
W2 final weight of the filter paper (g)
Mr manometer reading (lpm)
t total sampling time (minutes)
Sampling and Analysis of Sulphur Dioxide
Thirty ml of 0.04 M potassium tetrachloromercurate (TCM) absorbing solution was taken in a midget impinger and arranged in the gaseous sampling kit attached to the Respirable Dust Sampler. The sampler was allowed to run for 8 hrs (the rotameter set for 0.2 litre / minute) and then the contents of the impinger were transferred to a clean sampling bottle and it is clearly labeled with the date and time of the sampling. The impinger was again filled with 30 ml of TCM solution to continue the sampling procedure. The collected samples were immediately transferred to the laboratory for further analysis.
The contents of the sampling bottle were transferred to a 50 ml volumetric flask. A reagent blank was prepared by adding 25 ml of unexposed absorbing reagent in a 50 ml volumetric flask. To destroy the nitrates from oxides of nitrogen, 1 ml of 0.6% sulfuric acid was added and was allowed to react for 10 minutes. Two ml of 0.2% of formaldehyde and 5 ml Pararosaniline reagent were added. The contents were allowed to stabilize for 30 minutes then the absorbance was measured at a wavelength of 560 nm in a UV-Visible Spectrophotomer (ELICO Model No SL 177, Scanning SPEC).
Aliquots of diluted sodium sulphite solution was added to 0,1,2,3,4 and 5 ml were taken into series of 25 ml volumetric flasks. The contents were made up to 25 ml in the volumetric flask using 0.04 M TCM solution. The
absorbances were plotted against concentrations.
Concentrations of the SO2 in the unknowns were drawn
from the graph.
Calculations
The SO2 concentration can be expressed as (Eqn.3):
where
CSO2 SO2 concentration in µg m-3
A sample Absorbance
A0 reagent Blank absorbance
103 conversion litres to cubic meters
B calibration factor µg/absorbance
Va volume of air sampled in litres
Vs final volume of sampling solution
Vt aliquot taken for analysis
Sampling and Analysis of nitrogen oxide
Thirty ml of sodium hydroxide and sodium arsenite absorbing solution was taken in a midget impinger and arranged in the gaseous sampling kit attached to the Respirable Dust Sampler. After the sampling, the contents were taken to the laboratory in the amber colored bottle and subjected to further analysis.
1.5306 g of NaNO2 was dissolved in double distilled water and made up to 1l. 1 ml of this solution was equivalent to 1000 µg/ml of NO2. 10 ml of this solution was
diluted to 1 l. This contained 10 µg/ml of NO2. Again 10 ml
of this solution was diluted to 100 ml with absorbing solution; this contained 1 µg/ml of NO2.
25 ml of absorbing solution was taken in ten volumetric flasks and 0.5, 1, 3, 5, 7, 10, 15, 20, 25 ml of 1 µg/ml of NO2 was placed in each of the flask and made up to 25 ml
using absorbing solution. 1ml of H2O2, 10 ml of
Sulfanilamide solution and 1 ml of NEDA were added to each flask, the contents were thoroughly mixed and left for 30 min for colour development. Then absorbance at 550 nm was measured using a UV-Visible spectrophotometer (Model ELICO Model No SL 177, Scanning Mini SPEC). The absorbance was plotted against concentration to prepare a calibration curve. The concentration of the unknowns were drawn from this calibration curve.
Calculations
The NO
xconcentrations can be expressed
as:
cNO2
NO
2concentration in analyzed sample
(Graph factor x (samples absorbance –
blank absorbance)
Va
volume of air sampled in m
30.82
sampling efficiency
D
dilution Factor (D=1 for no dilution; D=2
for 1:1 dilution)
Vs
final volume of sampling solution
Vt
aliquot taken for analysis
Sampling of Carbon Monoxide (CO)
The concentrations of the Carbon Monoxide were recorded using an instrument (Make: Quest technologies)
3 ( 0) *10
(3) 2
A A B Vs
CSO
V Va t
2 (4)
0.82
cNO Vs
C D
NOx V V
a t
that directly gave the read out. The values were recorded exposing the instrument to the ambient condition for one minute. Series of values were recorded and the mean values were tabulated.
The respective concentrations of the ambient air quality parameters were compared at this station with the National Ambient Air Quality (NAAQ) standards.
Sampling and testing of street vendors
For the present study, the vendors were selected using judgment sampling and convenience sampling. The vendors were selected from each sampling station and were subjected to various tests. For all the tests, people who have been living in this area for a minimum of three years were selected. After preliminary interview the vendor was taken to Andhra Pradesh chest hospital, Hyderabad and tested for the parameters initially. The vendor was taken as the item in the sample only when they promised to attend to the tests for the second time. They were financially compensated for the loss of income on the days of tests.
The following tests were performed to the vendors, to identify the impacts of traffic on the health.
Blood pressure test
Pulse oxymetry
Pulmonary function test
Carboxy haemoglobin test
All these tests were performed after recording the age, height (in cm) and weight (in kg) of the vendors. A brief description of each test is given.
a) Blood pressure test
The systole and diastole pressure was measured using a sphygmomanometer. This test was performed only to ascertain the initial health status of the vendors as a cross checks for the information provided by the sample vendor.
b) Pulse oxymetry
The pulse oxymetry was performed for all the vendors to record percent saturation of oxygen in the blood and the pulse rate. The vendors’ finger was clipped connecting to the pulse oxymetry (BPL) apparatus. The instrument gave direct reading of percent saturation and the pulse rate of the vendor. The saturation percentage of the individual was compared to the standards available and accordingly the decrease of percent saturation was categorized as normal, mild, moderate and severe, in that order.
c) Pulmonary Function Test
PFT test is envisaged to detect whether the vendor has got any breathing problem. This test also helps to detect any
obstruction in the trachea of the vendor. The PFT besides tracing out the obstructions, also measures the volume of air that could be held by the lung.
The Pulmonary Function Test was performed to all the vendors. The Pulmonary Function was assessed through two components namely FEV1 and FVC. FEV1 was Forced Expiratory Volume in the first second. The total expiration was measured after a full breathe to record Forced Vital Capacity. The FEV1 and FVC were measured twice at an interval of 20 minutes. The first record of FEV1 and FVC were taken as the base volume and the second record generally was used to prescribe the drug dose basing on the difference. After six months all the vendors were tested for second time. The difference between the two base volumes was considered for the assessment of the impact. The difference between the first FEV1 and second FEV1 (after 6 months) was recorded in ml. The difference between first FVC and value after 6 months was also recorded in ml. The increase of value for FEV1 and FVC over the initial value (when the study was started) was taken as the improvement in the condition and a decrease over the first record was taken as the deterioration of the lung capacity which is referred in the study as ‘Affected’.
d) Carboxy haemoglobin test
The amount of carbon monoxide in the blood was recorded using a CO meter (Micro Medical CO meter, UK). The vendor was asked to inhale the air to full capacity and hold it for 15-20 seconds and then blow the air out through the mouth piece attached to the CO meter. The CO meter gave a direct read out in percentage COHb. The Carboxy haemoglobin (COHb) test was repeated after six months for all the vendors. The difference between the two records was used to assess the impact. An increase in the value at the second instance was considered to designate the vendor as affected and a decrease for improvement in the condition.
RESULTS AND DISCUSSION
Ambient air quality in the traffic stations
The study included monitoring of TSPM, RSPM, SO2,
NOx and CO at punjagutta station. The monthly means of
the ambient air quality parameters are discussed for this station. Basing on the number of ambient air quality parameters exceeding the standards, the traffic station was assigned a rank to denote the level of air pollution. The hourly means of 24 hours analysis was also made and the concentrations of ambient parameters during peak traffic hours was also determined. A brief description of various AAQ parameters at different traffic zones is furnished here under.
Monthly mean concentrations of ambient air quality parameters at Punjagutta traffic station
a) Total suspended particulate matter (TSPM)
was recorded in December 2006 (492.00 µg/m3), while the
mean concentration of the TSPM recorded for the study period was 405.68 µg/m3. The seasonal distribution of
TSPM was similar for the two years. The particles with less than 10 µm diameter were considered as respirable suspended particulate matter or PM10. The developed
countries since 1990s have further increased the resolution of this particle diameter to a finest size of PM2.5 and PM1.
However, the new millennium studies in the developed countries have been monitoring even the ‘ultra particulates’ or ‘nano particulates’. The prime source of these finest particles is the emissions from automobiles. There were supporting evidences by many authors for these sources 6-10
measured the particle size distribution in the range of 11 - 452 nm on the side of a busy Marylebone road in Central London and concluded that 11-30 nm size contained freshly nucleated particles formed as the exhaust gases diluted with ambient air. The summer seasons exhibited moderate concentrations of TSPM and the rainy seasons showed the lowest concentrations, while the highest concentrations of the TSPM were recorded during winter season (Table 2; Fig 2).
b) Respirable suspended particulate matter (RSPM)
The monthly means of respirable suspended particulate matter for the study period showed a wide range of concentrations. The minimum RSPM concentration was recorded in July 2007 (123.50 µg/m3) and the maximum was
recorded in December 2006 (196.80 µg/m3), while the mean
concentration of the RSPM recorded for the whole study period was 154.16 µg/m3.
The seasonal distribution of RSPM was same for the two years. The summer seasons showed moderate concentrations of RSPM and the rainy seasons showed the lowest concentrations, while the highest concentrations of the RSPM were recorded during winter season. The maximum attention among the traffic pollutants had been focussed on the particulate matter because of it’s potential threat to human health particularly in the pulmonary ailments. [11] examined the respirable suspended particulates at 72 locations in 6 urban districts of different land use types in Hong Kong and concluded that the problem of respirable suspended particulates in Hong Kong’s roadside environment is quite serious. (Table 2; Fig 2). c) Sulphur dioxide
The monthly means of sulphur dioxide for the study period showed a marginal range between 5.90 and 7.10 µg/m3. The mean concentration of sulphur dioxide for the
whole study period was 6.49 µg/m3. The seasonal variation
in the concentrations of sulphur dioxide was not high as there was only marginal difference between the lowest and highest concentrations during the study period. The concentrations of sulphur dioxide were considered as negligible because the recorded concentrations were less than 10% of the prescribed national standard. The sulphur dioxide coupled with particulate matter is known to increase the respiratory and cardio-pulmonary mortality 12. They
have made a study in Vienna, Linz and Graz cities on the effects before and after implementation of standards for TSP and SO2. (Table 2; Fig 2).
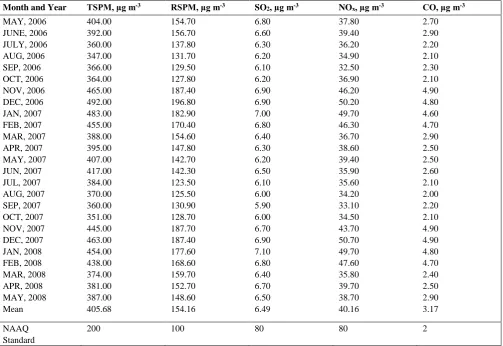
Table 2. Monthly mean concentrations of Ambient air quality parameters at Punjagutta traffic station during the study period.
Month and Year TSPM, µg m-3 RSPM, µg m-3 SO
2, µg m-3 NOx, µg m-3 CO, µg m-3
MAY, 2006 404.00 154.70 6.80 37.80 2.70
JUNE, 2006 392.00 156.70 6.60 39.40 2.90
JULY, 2006 360.00 137.80 6.30 36.20 2.20
AUG, 2006 347.00 131.70 6.20 34.90 2.10
SEP, 2006 366.00 129.50 6.10 32.50 2.30
OCT, 2006 364.00 127.80 6.20 36.90 2.10
NOV, 2006 465.00 187.40 6.90 46.20 4.90
DEC, 2006 492.00 196.80 6.90 50.20 4.80
JAN, 2007 483.00 182.90 7.00 49.70 4.60
FEB, 2007 455.00 170.40 6.80 46.30 4.70
MAR, 2007 388.00 154.60 6.40 36.70 2.90
APR, 2007 395.00 147.80 6.30 38.60 2.50
MAY, 2007 407.00 142.70 6.20 39.40 2.50
JUN, 2007 417.00 142.30 6.50 35.90 2.60
JUL, 2007 384.00 123.50 6.10 35.60 2.10
AUG, 2007 370.00 125.50 6.00 34.20 2.00
SEP, 2007 360.00 130.90 5.90 33.10 2.20
OCT, 2007 351.00 128.70 6.00 34.50 2.10
NOV, 2007 445.00 187.70 6.70 43.70 4.90
DEC, 2007 463.00 187.40 6.90 50.70 4.90
JAN, 2008 454.00 177.60 7.10 49.70 4.80
FEB, 2008 438.00 168.60 6.80 47.60 4.70
MAR, 2008 374.00 159.70 6.40 35.80 2.40
APR, 2008 381.00 152.70 6.70 39.70 2.50
MAY, 2008 387.00 148.60 6.50 38.70 2.90
Mean 405.68 154.16 6.49 40.16 3.17
NAAQ Standard
0.00 100.00 200.00 300.00 400.00 500.00 600.00 MAY, 2006 JUNE, 2006 JULY , 2006
AUG, 2006
SEP, 2006
OCT, 2 006
NOV, 2006
DEC , 200
6 JAN, 2
007 FEB,
2007 MAR
, 200 7 APR
, 200 7 MAY,
2007 JUN, 2
007 JUL, 2007 AUG, 2007 SEP, 2007 OCT, 2
007 NOV,
2007 DEC
, 200 7 JAN, 2
008 FEB,
2008 MAR
, 200 8 APR
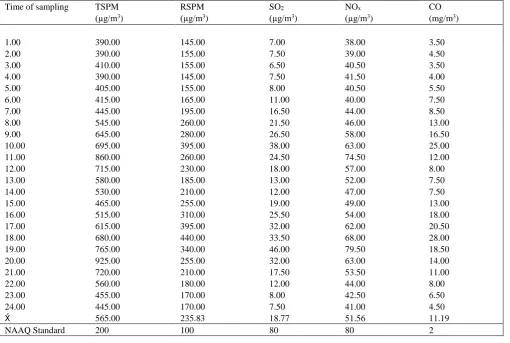
, 200 8 MAY, 2008 MONTHS C ON C E N TR A TI ON OF TS P M in µ g/ m 3 ; R S P M in µ g/ m 3 ) 0.00 10.00 20.00 30.00 40.00 50.00 C ON C E N TR A TI ON ( N ox i n µ g/ m 3 ; S O2 i n µ g/ m 3 ; C O in m g/ m 3 ) CO SO2 RSPM TSPM NOx Table 3. Hourly parameters at Punjagutta traffic station during the study period
Time of sampling TSPM
(µg/m3)
RSPM
(µg/m3)
SO2
(µg/m3)
NOx
(µg/m3)
CO
(mg/m3)
1.00 390.00 145.00 7.00 38.00 3.50
2.00 390.00 155.00 7.50 39.00 4.50
3.00 410.00 155.00 6.50 40.50 3.50
4.00 390.00 145.00 7.50 41.50 4.00
5.00 405.00 155.00 8.00 40.50 5.50
6.00 415.00 165.00 11.00 40.00 7.50
7.00 445.00 195.00 16.50 44.00 8.50
8.00 545.00 260.00 21.50 46.00 13.00
9.00 645.00 280.00 26.50 58.00 16.50
10.00 695.00 395.00 38.00 63.00 25.00
11.00 860.00 260.00 24.50 74.50 12.00
12.00 715.00 230.00 18.00 57.00 8.00
13.00 580.00 185.00 13.00 52.00 7.50
14.00 530.00 210.00 12.00 47.00 7.50
15.00 465.00 255.00 19.00 49.00 13.00
16.00 515.00 310.00 25.50 54.00 18.00
17.00 615.00 395.00 32.00 62.00 20.50
18.00 680.00 440.00 33.50 68.00 28.00
19.00 765.00 340.00 46.00 79.50 18.50
20.00 925.00 255.00 32.00 63.00 14.00
21.00 720.00 210.00 17.50 53.50 11.00
22.00 560.00 180.00 12.00 44.00 8.00
23.00 455.00 170.00 8.00 42.50 6.50
24.00 445.00 170.00 7.50 41.00 4.50
565.00 235.83 18.77 51.56 11.19
NAAQ Standard 200 100 80 80 2
d) Nitrogen oxide
The concentrations of the oxides of nitrogen for the whole study period ranged between 32.50 and 50.70 µg/m3, with a monthly mean of 40.16 µg/m3. The concentrations of oxides of nitrogen during summer were moderate. The rainy season exhibited less concentration while the concentrations were higher in winter season. However, the highest concentration recorded at Punjagutta (50.70 µg/m3) was a little above 50% of national standard value. The concentrations of NOx were
found to be higher in busy roads and areas with high density of buildings. A study made in Hong Kong on the daily variations of NO2 at 14 monitoring stations by 13 concluded
that the air pollution behaviour was in tune with the variations in the traffic volume and further the dispersion of these pollutants was hindered by the tall buildings and their high density. (Table 2; Fig 2).
e) Carbon monoxide
The carbon monoxide concentrations at Punjagutta ranged between 2.00 and 4.90 mg/m3. The mean concentration for the whole study period was 3.17 mg/m3. Though the difference between the lowest and highest records seemed to be less, a difference of 2.90 mg/m3 would be definitely considerable difference if we take into account the permissible limit for carbon monoxide which stood at 2.00 mg/m3 for 8 h averaging time. The seasonal march of the carbon monoxide was similar to that of any other parameter with trends following, moderate in summer, less in rainy and high in winter, pattern. The concentrations of CO vary widely in different parts of a city14 conducted a study in
Mexico city on in-vehicle carbon monoxide levels to identify the main factors affecting the variation in CO concentrations inside public and private transport vehicles during the winter of 1991. (Table 2; Fig 2).
Figure 2. Monthly mean concentrations of ambient air quality
parameters at Punjagutta during the study period
Hourly mean concentrations of ambient air quality parameters at Punjagutta traffic station
a) Total suspended particulate matter (TSPM)
The total suspended particulate matter at Punjagutta varied widely between 390.00 and 925.00 µg/m3. The TSPM
0.00 10.00 20.00 30.00 40.00 50.00 60.00 70.00 80.00 90.00
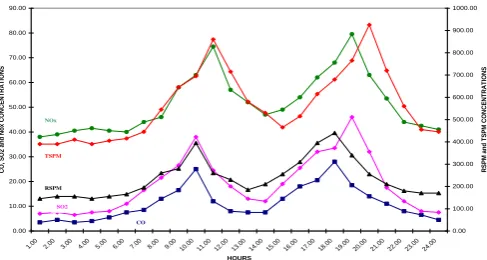
1.00 2.00 3.00 4.00 5.00 6.00 7.00 8.00 9.0010.0 0 11.0 0 12.0 0 13.0 0 14.0 0 15.0 0 16.0 0 17.0 0 18.0 0 19.0 0 20.0 0 21.0 0 22.0 0 23.0 0 24.0 0 HOURS CO , SO 2 a nd Nox CO NC ENTRA TI O NS 0.00 100.00 200.00 300.00 400.00 500.00 600.00 700.00 800.00 900.00 1000.00 RSPM a nd T SPM CO NC ENTRA TI O NS CO SO2 RSPM TSPM NOx the PTHs. The behaviour of the TSPM dwindled fast with
variations in the turbulence due to the traffic.
In a cycle of twenty four hours there was a gradual increase of TSPM concentration with sunrise and reached to the P1 (morning peak) at 11.00 h. Then the concentration of TSPM started to decrease up to 15:00 h followed by a slow increase to reach the P2 (evening peak) at 20:00 h. From 21:00 h in the evening, the concentrations showed a slow decrease till 07:00 h in the morning. The twenty four hour mean of the TSPM at Punjagutta was 565.00 µg/m3.
The ambient air quality standard specified that the TSPM should not exceed 200.00 µg/m3 for twenty four hour
weighted average for residential, rural and other areas, while for industrial areas, it was 500.00 µg/m3. The concentrations
in the present study have crossed the particular prescribed standards. The lowest values, twenty four hour mean ( 24 h = 565.00 µg/m3) were much higher than the national
standard. (Table 3; Fig. 3).
b) Respirable suspended particulate matter (RSPM)
The present study at Punjagutta showed a wide range of RSPM concentrations between 145.00 and 440.00 µg/m3.
However, the hourly mean of twenty four hour cycle was 235.83 µg/m3, which was well above the national standard.
Punjagutta experienced two PTHs during the day. It is interesting from the present study that the concentrations of each parameter reached the peaks independent of other parameters. In other words, the peak concentrations of the AAQ parameters of RSPM reached it’s peak at 10:00 h in the morning and at 18:00 h in the evening in a day. The achievement of peak concentration for other parameters was slightly delayed. This was perhaps due to the differences in “settling velocities” and the “diffusion coefficients”.
The RSPM was contributed by the automobile emissions as well as the fugitive dust. The highest value of RSPM was recorded at 10:00 h in the morning and at 18:00 h in the evening. As the traffic turbulence decreased, the concentrations of the RSPM also decreased in the night. During early hours the concentrations of RSPM started to increase with the increasing volume of the traffic. After the peak concentration at night, the RSPM concentrations consistently decreased from 21.00 h till 07.00 h. (Table 3; Fig. 3).
c) Sulphur dioxide
The concentrations of sulphur dioxide, in the hourly samples of a twenty four hour cycle revealed excessively high concentrations during the peak hours, 38.00 and 46.00 µg/m3 at P1 and P2, respectively. The concentrations in the
ambient air showed a positive correlation with the volume of traffic. The intensity of traffic was high in the evening compared to the morning times at all the traffic stations. The concentrations of sulphur dioxide also showed a decreasing trend throughout the night and again the concentrations started to rise with the increasing traffic and the hourly sample study recorded an hourly mean of 18.77 µg/m3. The
lowest concentration recorded was 6.50 µg/m3 at 03:00 h,
while the highest 46.00 µg/m3 was recorded at 19:00 h
(Table 3; Fig. 3).
d) Nitrogen oxide
The concentrations of oxides of nitrogen dwindled throughout the day from a minimum concentration of 38.00 µg/m3 to a maximum of 79.50 µg/m3. (Table 3; Fig. 3). The
traffic at Punjagutta was active from 07:00 h in the morning to 22:00 h. During this period the mobility of the vehicles was not uniform. The volume of traffic would be maximum at least, two times a day during morning and evening. The duration of this maximum volume is more or less consistent throughout the study period. The highest concentration recorded (79.50 µg/m3) at this place was during the peak traffic hour in the evening. In general, the concentrations during the diel peaks were higher and between the two peaks, the evening PTH showed higher values. In a cycle of twenty four hours the concentrations of oxides of nitrogen increased with increased traffic volume. From 23:00 h to 06:00 h the concentrations showed a decrease for nearly eight hours and with the starting of the civil traffic, at 07:00 h the concentrations went up steadily to reach a peak, at 11:00 h then again decreased from noon till 16:00 h. The concentrations then marched towards the evening PTH showed increased values to reach a peak at 19:00 h. The cycle was repeated every day. The national standard prescribed for oxides of nitrogen was 80.00 µg/m3 for residential and other areas, and 120.00 µg/m3 for industrial areas. The concentrations of oxides of nitrogen were very nearer to the maximum permissible limit during the PTH. However, the hourly mean for a twenty four hour cycle at this station, was much less than (51.56 µg/m3) the permissible limit. (Table 3; Fig. 3).
Figure 3. Hourly parameters at Punjagutta traffic station during the study period
e) Carbon monoxide
for 8 hourly average was 2.00 mg/m3 and for 1 hour averages it was 4.00 mg/m3. The CO concentrations continued to be higher during the day time and equal to maximum permissible limit during night time. (Table 3; Fig. 3).
Tests for health impact
The vendors were tested twice in a span of six months. The difference between the initial test and final test values were used to record whether the person was affected and if affected the intensity of the impact by comparing with the available standard values.
Blood pressure
The blood pressure of the vendors was initially measured to cross check the information provided by the respondents.. The vendors had normal blood pressure was shown in Table .4.
Table 4. Details of the blood pressure measurement in the beginning of the study for the subject vendors in the study area.
Pulse oxymetry
The pulse oxymetry was used to measure percent oxygen saturation in the blood., the vendors have been affected at varied intensities. However, 40.4% of the vendors had the saturation level between 93-95% which was designated as ‘mild impact’, another 38.5% were affected with moderate impact were shown in Table.5. In these cases the saturation level was between 87-92%. There was no case of ‘severe impact’. On the whole, 79% of the roadside vendors were affected and only 21% were normal. This decreased saturation level of oxygen could be taken as a forecasting tool for the future ailments or disorders.
Table 5. Measurement of the percentage oxygen saturation in
blood among the subject vendors through pulse oxymetry in the
beginning of the study.
Sl.No Name of the
Station
Normal Mild of
impact
Moderate of impact
1. Punjagutta 3 4 4
Pulmonary function test (PFT)
Pulmonary Function Test is generally considered as the clinical support test of the general health of an individual. The ‘Pulmonary Function’ varies with not only the bacterial lung infections but also with non bacterial lung infections. Exposure to a deteriorated ambient air quality also lead to the non bacterial lung infections. The periodical testing of lung function helps in prediction of the respiratory allergies, aggravation of already existing respiratory ailments such as
Asthma and Bronchitis and also the consistent decrease of lung function forecasts the Chronic Obstructive Pulmonary Disease (COPD). Hence, the pulmonary function test was considered in the present study as the primary indicator of the impact of traffic pollution on the health of roadside vendors.
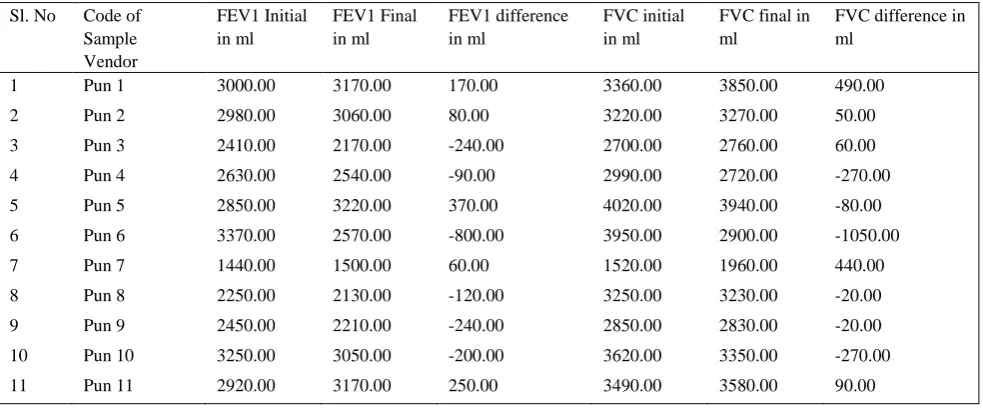
The Pulmonary function test reveal the air handling capacity of the lungs of an individual. This capacity was measured in two dimensions viz., FEV1 and FVC. The FEV1 was Forced Expiratory Volume in the first second of expiration which was expressed in ml. The FVC was Forced Vital Capacity measures the amount of air one can exhale with force after a full breath, the value of which was expressed in ml. FEV1 and FVC, both were measured to evaluate the pulmonary function of the roadside vendors, in the beginning of the study as well as after six months. The change of value over the first record i.e., in the beginning of the study was noted to denote the impact as “improved” when the second record was higher than the first and the impact was considered as “affected”, when the second record was lower than the first. After both the tests, the vendor was considered as “improved” when the second record was higher for both FEV1 and FVC. The vendor was considered as “affected” when the FEV1 and / or FVC have shown a decrease. These values were influenced by many factors such as volume of traffic, duration of exposure, age group, habits of the individual, etc.,
Out of the 11 roadside vendors tested at Punjagutta, six subject vendors have showed a decrease in the Forced Expiratory Volume in first second. The range of decrease of FEV1 from -90.00 to -800.00 ml. Five of the subject vendors showed an improved Forced Expiratory Volume in first second, and this improvement ranged from 60.00 to 370.00 ml. The group which showed improvement included the people shifted their residence to a non traffic zone and some were never smokers. However, this improvement was attributed to shifting to a new place and the resistance capacity of the individual Decreased FEV1 indicated development of obstructions in the respiratory tract of the subject vendors 15 conducted a study to test a hypothesis that
children living close to busy roads may have impaired respiratory health. Study concluded that the relation between symptoms and measures of exposure to traffic related air pollution were almost entirely restricted to children with bronchial hyper responsiveness and/or sensitization to common allergens, indicating that these are a sensitive subgroup among all children for these effects.
The Forced Vital Capacity (FVC) indicates total air handling capacity of the lungs, revealed a decrease in six vendors from -20.00 to -1050.00 ml. The decrease in FVC over a period, indicate reduced lung capacity which is a sign of vendor’s susceptibility to future infections. Five vendors showed an increase in lung capacity of whom two vendors showed substantial improvement. Among the vendors who showed substantial improvement, one vendor had very less was shown in Table .6, vital capacity in the beginning of the study, later improved health resulted in the overall efficiency and she possessed the lowest vital capacity among the subject samples at Punjagutta. This must be due to a ‘recovery’ from an ailment.
Station Sample size Normal B.P. High B.P.
Table 6. FEV1 and FVC values – Punjagutta
Sl. No Code of
Sample Vendor
FEV1 Initial in ml
FEV1 Final in ml
FEV1 difference in ml
FVC initial in ml
FVC final in ml
FVC difference in ml
1 Pun 1 3000.00 3170.00 170.00 3360.00 3850.00 490.00
2 Pun 2 2980.00 3060.00 80.00 3220.00 3270.00 50.00
3 Pun 3 2410.00 2170.00 -240.00 2700.00 2760.00 60.00
4 Pun 4 2630.00 2540.00 -90.00 2990.00 2720.00 -270.00
5 Pun 5 2850.00 3220.00 370.00 4020.00 3940.00 -80.00
6 Pun 6 3370.00 2570.00 -800.00 3950.00 2900.00 -1050.00
7 Pun 7 1440.00 1500.00 60.00 1520.00 1960.00 440.00
8 Pun 8 2250.00 2130.00 -120.00 3250.00 3230.00 -20.00
9 Pun 9 2450.00 2210.00 -240.00 2850.00 2830.00 -20.00
10 Pun 10 3250.00 3050.00 -200.00 3620.00 3350.00 -270.00
11 Pun 11 2920.00 3170.00 250.00 3490.00 3580.00 90.00
Conclusion
Exposure assessment and epidemiologic studies in the developing world are important and have advantages. On the one hand, increasing exposure data of traffic-related air pollution will provide scientific basis for pollution control in local areas. On the other hand, in-depth human health studies in these countries are necessary for assessing the degree of health outcomes of the public and for setting priorities in taking environmental control measures. In addition, epidemiologic investigations in regions with different metrological and socioeconomic backgrounds are helpful in strengthening scientific evidence about the association or causative relationships between these traffic-generated pollutants and various health endpoints.
In recent years, an increasing number of traffic-related pollution exposure studies and epidemiologic investigations have been reported, many of which are under the collaboration of researchers from developed countries and developing countries. Though the volume of scientific investigation on traffic-related air pollutants is increasing, exposure assessment and epidemiologic data are still not abundant. The differences among measuring methods and a lack of strict quality control in carrying out exposure assessment make it difficult for the findings to be generalized and the comparisons to be made between studies, which is especially true in exposure assessment research on particulate matter. Many of the existing epidemiologic investigations conducted in these underdeveloped regions suffer from inaccurate exposure assessment and insufficient control for potential confounders.
Therefore, future research in the developing world should emphasize the sharing of technical resources and communications between different countries and the use of standard measuring methods. Source-specific exposure assessment studies and studies using source-specific exposure data need to be more widely carried out since this serves directly as the basis for exposure regulations and
public health measures. Source-specific studies are particularly crucial for particulate matter for an additional reason: different sources of particulate matter have different physiochemical compositions and thus different biological and environmental potentials.
Acknowledgement
The authors would like to thank to Prof.Z. Vishnuvarthan, Dean and Board of the Studies ,Department of environmental sciences Acharya Nagarjuna University, India., for his co-operation and encouragement. Our special thanks also reserved for our family members and friends who stand always by our side in all our endeavors.
References
1Ott, W. Environ Int., 1982, 7, 179-196.
2Ashmore, M. R. and Dimitroulopoulou, C. Personal exposure of
children to air pollution. Atmospheric Environment., 2009,43 (1): 128-141.
3World Health Organization,’ ‘Air Quality Guidelines for Europe’,
WHO Regional Publications, European Series No. 23, 1987,WHO Regional Office for Europe, Copenhagen.
4J., Douglas W. Dockery and Frank E. Speizer., Am. J. Respiratory
Crit. Care Med., 2006, 173, 667- 672.
5Beck, B. D and Brain, J. D., Prediction of the pulmonary toxicity
of respirable combustion products from residential wood and
coal stoves. In: Residential Wood and Coal Combustion,
1982, 264-280. Air Pollution Control Association, Louisville, Kentucky.
6Roorda-Knape, M.C.R., Nicole A.H. Janssen, Jeroen J. De Hartog,
Patricia H.N. Vliet, Hendrik Harssema and Bert Brunekreef.,
Atm. Environ., 1998, 32(11), 1921-1930.
7Kumar, A. V., Patil R. S. and Nambi, K. S. V., Atm. Environ.,
2001, 35(25), 4245-4251.
8Saksena, S., Joshi V. and Patil, R. S., J. Environ. Monit.,2003,
9Fenger, J., J. Environ. Monit., 2009,43(1), 13-22.
10Charron, A., and Harrison, R. M., Atm. Environ., 2003, 37(29),
4109-4119.
11Leung, S. N and Lam, K. C., Environ. Monitor. Assessment, 2001,
72(3), 235-247.
12Neuberger, M. A, and Moshammer, H., Occupational Environ.
Med., 2004, 61, 157-162.
13Lau, J., Hung, W.T. and Cheung, C. S., Atm. Environ., 2009,
43(4), 769-777.
14Bremauntz, A. A. F and Ashmore, M. R., Atm. Environ..1995,
29(4), 525-532.
15Janssen, N. A. H., Brunekreef, B., van Viiet, P., Aarts, F.,
Meliefste, K., Harssema H. and Fisher, P., Environ. Health
Persp. 2003, 111(12), 1511-1518.