PICTORIAL REVIEW
Cancer therapy related complications in the liver, pancreas,
and biliary system: an imaging perspective
Danny Ngo1&Jemianne Bautista Jia2&Christopher S. Green2& Anjalie T. Gulati2&Chandana Lall2
Received: 26 June 2015 / Revised: 14 September 2015 / Accepted: 18 September 2015 / Published online: 6 October 2015
#The Author(s) 2015. This article is published with open access at Springerlink.com
Abstract
Awareness of cancer therapy-induced toxicities is important for all clinicians treating patients with cancer. Cancer therapy has evolved to include classic cytotoxic agents in addition to newer options such as targeted agents and catheter-directed chemoembolisation. Several adverse affects can result from the wide array of treatments including effects on the liver, pancreas, and biliary system that can be visualised on imag-ing. These complications include sinusoidal obstruction syn-drome, fatty liver, pseudocirrhosis, acute hepatitis, pancreati-tis, pancreatic atrophy, cholecystipancreati-tis, biliary sclerosis, and bil-iary stasis. Many of these toxicities are manageable and re-versible with supportive therapies and/or cessation of cancer therapy. The objective of this review is to discuss the imaging findings associated with cancer therapy-induced toxicity of the liver, biliary system, and pancreas.
Teaching Points
•Cancer therapy can have adverse effects on the hepatobiliary system and pancreas.
• Cancer therapy-induced toxicities can be visualised on imaging.
•Knowledge of imaging changes associated with cancer therapy complications can improve treatment.
Keywords Cancer therapy . Drug-associated adverse effects . Hepatic toxicity . Pancreatic toxicity . Biliary toxicity
Introduction
Chemotherapy is an essential component in the treatment of cancer. Systemic cancer therapy has evolved from the classic cytotoxic agents to now include newer classes of molecularly targeted therapy. Classic cytotoxic agents tar-get rapidly proliferating cells by interfering with their cell division and growth. Newer therapies target specific cancer molecules involved in regulating cancer cell growth and differentiation. Additionally, the use of chemoembolisation, a minimally invasive procedure used to locally administer chemotherapeutic agents directly to tumours, continues to grow and is predominantly used in the treatment of liver cancers.
While these therapies aim to inhibit cancerous tissue growth, both systemic and localised therapies are known to have adverse effects on normal tissues. With the vary-ing mechanisms of action, it is not surprisvary-ing that the side effects of different anticancer agents and treatment modalities are diverse, affecting nearly every organ sys-tem. Many of the adverse effects of cancer therapy on the liver, pancreas, and biliary system can be detected on imaging (Table 1). These include sinusoidal obstruction syndrome (SOS), fatty liver, pseudocirrhosis, hepatitis, pancreatitis, pancreatic atrophy, cholecystitis, biliary scle-rosis, and biliary inflammation. The objective of this article is to review and discuss the imaging findings associated with cancer therapy-related changes in the liv-er, pancreas, and biliary system and to provide didactic cases.
* Danny Ngo ngod@evms.edu
1
Eastern Virginia Medical School, 700 W Olney Road, Norfolk, VA 23507, USA
2 Department of Radiological Sciences, University of California,
Effects of systemic therapy
Liver
Fatty liver
Fatty infiltration of hepatic tissue as well as buildup of fat globules in hepatocytes is considered hepatic steatosis while
steatohepatitis is a more severe form of fatty liver disease with hepatocyte degeneration. Steatohepatitis is often asymptomatic; however, it can often manifest through ele-vations of alanine transaminase (ALT) and aspartate trans-aminase (AST). Fatty changes have been linked to the chemotherapeutic agents oxaliplatin, irinotecan, 5-FU, and methotrexate with initial steatotic appearance occurring from 2 weeks to 2 months after therapy [1, 2].
Table 1 Table summarising adverse effects visible on imaging and most commonly associated cancer therapies
Adverse effect Associated therapy Laboratory findings Radiologic findings
Fatty liver Oxaliplatin, irinotecan, fluorouracil, methotrexate
↑ALT
↑AST
US: increased echogenicity and beam attenuation
CT: reduced liver attenuation
MR: reduced liver signal intensity in out-of-phase imaging
Sinusoidal obstruction syndrome (SOS)
Oxaliplatin, fluorouracil, mercaptopurine, dacarbazine, azathioprine
↑Bilirubin US: ascites, gallbladder wall thickening, hepatosplenomegaly
CT: ascites, decreased right hepatic vein diameter (<0.45 cm), perioesophageal varices, hepatosplenomegaly, and recanalisation of the umbilical vein
Pseudocirrhosis Gemcitabine None US, CT, MR: segmental volume loss,
capsular retraction, fibrosis, enlargement of caudate lobe
Acute hepatitis Anastrozole, lapatinib ↑ALT
↑AST
US:Bstarry sky^sign
CT: Hepatosplenomegaly, thickened gallbladder wall, periportal oedema, decreased liver enhancement
Hepatic abscess TACE ↑Alkaline phosphatase
Hypoalbunaemia
CT: hypoattenuating lesion with peripheral rim enhancement
Hepatic failure TACE Thrombocytopenia
↑PT, INR
↑ALT
↑AST
↑Bilirubin
US: increased echogenicity, ascites, nodularity, segmental hypertrophy/atrophy
CT: surface and parenchymal nodularity, segmental hypertrophy/atrophy
Pancreatitis L-asparaginase, carboplatin, cisplatin, cytarabine, ifosfamide, paclitaxel, tretinoin, vinorelbine, TACE
↑Amylase
↑Lipase
US: peripancreatic fluid collection, hypoechoic lesions
CT: areas of low attenuation, diffuse pancreatic oedema
Pancreatic atrophy Sorafenib, sunitinib None CT: reduced pancreatic volume
Acute acalculous cholecystitis Everolimus, sunitinib, bevacizumab ↑Alkaline phosphatase
↑Bilirubin
US: gall bladder wall thickening, gallbladder distension, pericholecystic fluid collection CT: gallbladder distension, fat stranding,
hyperaemia, pericholecystic fluid Biliary inflammation L-asparaginase, doxorubicin, epirubicin,
paclitaxel
None CT: biliary epithelial thickening and enhancement
Biliary sclerosis HAIPC w/ floxuridine ↑Alkaline phosphatase
↑Bilirubin
CT: thickened/enhanced bile duct wall, bile duct stricture with lumen <3 mm, periductal oedema
ERCP: dilatation and stricture of biliary tree Biliary stasis Tamoxifen, doxorubicin ↑Alkaline phosphatase
↑Gamma-glutamyl transpeptidase
US: biliary dilatation CT: tumefactive sludge
Bile duct injury TACE ↑Alkaline phosphatase
↑Gamma-glutamyl transpeptidase
↑Bilirubin
CT: main bile duct dilatation, extrabiliary collection of bile
Chemotherapy-associated steatohepatitis (CASH) may be diffuse or focal and can be seen on ultrasound (US) as in-creased parenchymal echogenicity and beam attenuation [3]. Steatosis may also be visualised on computed tomography (CT) and is characterised by decreased parenchymal attenua-tion (Fig.1) [4]. On magnetic resonance (MR) imaging, fatty liver can be detected by a drop in signal intensity on opposed-phase images compared with in-opposed-phase images. This is partic-ularly useful in the diagnosis of focal hepatic steatosis (Fig.2) [5,6]. Detecting and reporting fatty changes on imaging in the chemotherapy patient is meaningful as it may prompt changes in treatment, especially in metastatic colorectal cancer patients who are planned for hepatic metastasectomy as underlying steatosis may increase the risk for post-operative complica-tions [7]. Steatotic changes may be reversible with cessation of therapy and severe cases of CASH may require adjustment of surgical plans as there is increased hepatopathy, liver failure
(5.8 % vs. 0.8 %), and mortality rate (14.7 % vs. 1.6 %) in these patients following partial hepatectomy [8,9].
Sinusoidal obstruction syndrome
Hepatic sinusoidal obstruction syndrome (SOS) is an injury to the hepatic venous endothelium causing deposition of fibrous material within the venule walls and liver sinusoids; this de-position leads to obstruction of small intrahepatic vessels [10]. Clinical presentation of SOS includes hepatosplenomegaly, jaundice, abdominal pain, and ascites and can be characterised histologically by sinusoidal fibrosis, sinusoid dilation and congestion, and necrosis of pericentral hepatocytes [11,12]. SOS is associated with systemic cancer therapies such as oxaliplatin, fluorouracil (5-FU), mercaptopurine (6-MP), and dacarbazine and may present as early as 1 to 3 weeks after initiation of therapy [13–15].
US findings of chemotherapy-induced SOS include ascites, gallbladder wall thickening, and hepatosplenomegaly as well as decreased flow through the portal vein on Doppler US [7]. CT reveals similar findings of hepatosplenomegaly, ascites, perioesophageal varices, and recanalisation of the umbilical vein [4]. Post-contrast enhancement CT and MR imaging commonly reveal patchy liver enhancement and narrowing of the main hepatic veins [16]. With detection of ascites, it is important to confirm the diagnosis of SOS as opposed to ma-lignant ascites associated with peritoneal spread or metastasis [17]. Malignant ascites account for approximately 10 % of ascites cases; thus, the distinction between the two is crucial so that the appropriate treatment steps can be taken [17].
Pseudocirrhosis
Pseudocirrhosis describes changes in hepatic contour, such as the development of diffuse hepatic nodularity, in patients fol-lowing chemotherapy treatment for hepatic metastases [18]. Pseudocirrhosis is most commonly found following chemo-therapy with gemcitabine in patients treated for metastatic breast cancer [19]. While the majority of the clinical features associated with cirrhosis are absent in pseudocirrhosis, portal hypertension may be present [4]. Qayyum reports hepatic con-tour changes in 75 % of patients being treated for breast cancer metastasis, with 9 % of patients showing signs and symptoms of portal hypertension [20].
The morphologic changes characteristic of pseudocirrhosis are initially detected between 4 and 8 months after therapy, may be diffuse or focal, and mimic liver cirrhosis, causing segmental volume loss, capsular retraction, fibrosis, and en-largement of the caudate lobe on US, CT, and MR imaging (Fig. 3) [18,19,21]. Additionally, the imaging findings of portal hypertension such as ascites, portosystemic venous col-laterals, and splenomegaly may also be present [22]. CT is generally the modality of choice for detecting the features of
pseudocirrhosis; however, MRI is more sensitive than CT for the follow-up of liver metastases and is recommended in these patients. While the exact mechanism underlying pseudocirrhosis is not fully understood, it has been linked with complications of hepatic encephalopathy, variceal bleeding, and portal hypertension [4]. Discontinuation of chemotherapy may be warranted if pseudocirrhotic compli-cations cannot be managed conservatively [19].
Acute hepatitis
Recent literature has demonstrated an association between acute hepatitis and several targeted therapies such as anastrozole and lapatinib [8]. Additionally, reactivation of hepatitis B has been
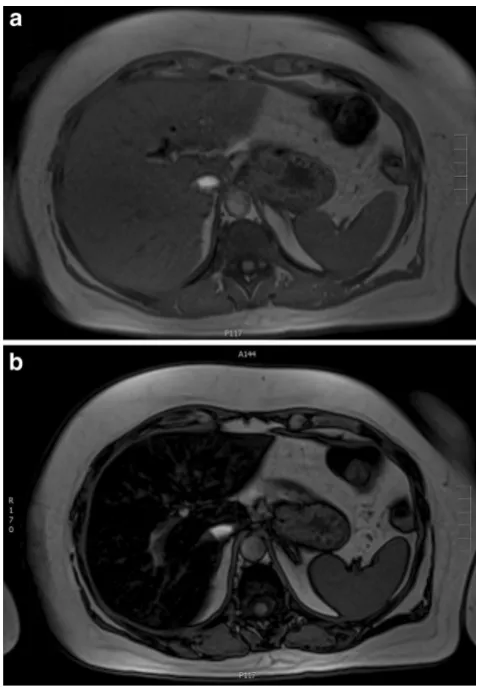
Fig. 2 A 60-year-old female with colorectal cancer currently being treated with irinotecan.a,bAxial T1-weighted MR images in and out of phase, respectively, show significant signal drop in the liver consistent with steatosis
observed following treatment with rituximab, alemtuzumab, and infliximab [23]. Reactivation of hepatitis C has been ob-served with rituximab, alemtuzumab, and gemcitabine [24]. The presentation of acute hepatitis may range from asymptom-atic to severe with nausea, poor appetite, vomiting, right upper quadrant pain, and jaundice with elevated AST and ALT. In the majority of patients, hepatitis is improved and reversible with temporary cessation of cancer therapy [2].
In patients with acute hepatitis, ultrasound demonstrates multiple echogenic foci within a relatively hypoechoic liver parenchyma, the so-calledBstarry sky^sign (Fig.4) [25]. CT findings of acute hepatitis are nonspecific and include hepatosplenomegaly, thickened gallbladder wall, periportal oedema, and decreased liver enhancement (Fig.5) [26].
Pancreas
Pancreatitis
Chemotherapy-induced pancreatitis is well documented in the literature and is associated with several chemothera-peutic agents. These chemotherachemothera-peutic agents include L-asparaginase, carboplatin cisplatin, cytarabine, ifosfamide, paclitaxel, tretinoin, and vinorelbine [27, 28]. The onset of pancreatitis is variable and may range from hours to 1 month after drug administration [27].
Among the listed agents, chemotherapy-induced pancrea-titis is most closely associated with asparaginase therapy with a prevalence of 2–16 % [7,29]. L-asparaginase is a cytotoxic chemotherapeutic agent commonly used in the treatment of acute lymphocytic leukaemia. Additionally, a correlation
between the targeted tyrosine kinase inhibitors sorafenib and sunitinib and pancreatitis has been described in recent literature [29]. Motzer et al. examined the effects of suni-tinib in patients with metastatic renal cell carcinoma and reported elevated serum lipase in 30 % of patients without any other clinical signs of pancreatitis [30]. In another study, clinical pancreatitis was found in 3 of 451 patients on sorafenib with several other documented case reports of sorafenib-induced pancreatitis that resolved with discontin-uation or reduction in sorafenib dosing [31–33].
For detecting and grading the severity of acute pancreatitis, multi-detector computed tomography (MDCT) is the modality of choice. Chemotherapeutic agents first cause acute intersti-tial pancreatitis, which may further progress to acute necrotising pancreatitis. On CT, acute interstitial pancreatitis may be characterised by fluid collections, peripancreatic fat stranding, focal areas of decreased attenuation, or diffuse
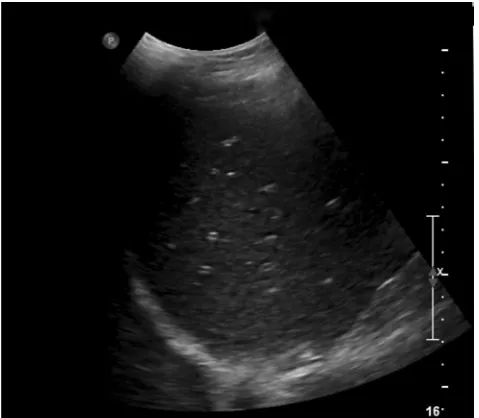
Fig. 4 A 63-year-old female with metastatic breast cancer undergoing treatment with a drug regimen that includes lapatinib. Longitudinal US of the liver reveals diffuse starry sky appearance consistent with diffuse hepatic oedema and acute hepatitis
oedema within the pancreas (Fig. 6) [34]. Similarly, necrotising pancreatitis is best seen on CT and has features of pancreatic inflammation and fluid collection in addition to the appearance of necrotic tissue (Fig.7) [35]. Areas of de-creased enhancement on CT and MR imaging can indicate necrosis of pancreatic tissue [36]. MRI can be helpful in grad-ing the severity of acute pancreatitis, determingrad-ing the presence and extent of necrosis, and may be more sensitive in the char-acterisation of peripancreatic collections [37,38]. Visualisa-tion of the pancreas via US imaging is often difficult because of patient body habitus and overlying bowel gas [39]. Thus, US evaluation of pancreatitis is often limited to the identifica-tion of peripancreatic fluid collecidentifica-tion as well as hypoechoic lesions indicating necrotic changes [39].
Pancreatic atrophy
Pancreatic atrophy is a possible adverse effect of cancer ther-apy. In the literature, it has been reported that long-term use of sorafenib is correlated with pancreatic atrophy [40]. Ganten et al. explored the relationship between extended sorafenib therapy and pancreatic atrophy and reported a mean pancreatic volume loss of 25 % in hepatocellular carcinoma patients being treated with long-term sorafenib [40]. Hescott examined the pancreatic volume of two patients undergoing long-term sorafenib treatment and reported similar findings of 20 and 35 % irreversible reduction in pancreatic volume [41]. Atrophy is detectable as soon as 3 months after initiation of sorafenib therapy but may not present until as late as 2–3 years following treatment [40, 41].
Pancreatic atrophy can be best detected using CT and is often accompanied by fatty infiltration of the pancreas [42]. Measurement of pancreatic volume can be used to quantita-tively monitor progression and/or improvement of atrophy and is commonly obtained by the Bsummation-of-areas^ method in which the pancreatic tissue area from each CT slice is calculated and multiplied by slice thickness [43]. The volume of all the pancreatic slices is combined to yield the total pancreatic volume. Additionally, pancreatic size can also be evaluated by measuring the linear dimensions, such as the anteroposterior diameter, of the pancreatic head, body, and tail (Fig.8) [44].
Other pancreatic changes
Other pancreatic changes that have been observed include fatty replacement of pancreatic tissue over the course of cancer therapy and cystic changes in the pancreas (Figs.9 and 10). The evidence of the relationship of these findings to specific agents is lacking in the literature; however, these changes have been observed in our institution in patients following cancer therapy with no predisposing factors for the discussed findings.
Biliary system
Acute acalculous cholecystitis
Cholecystitis is inflammation of the gallbladder. Symptoms include right upper quadrant abdominal pain, fever, nausea, and vomiting. There is growing evidence in the literature as-sociating the use of targeted therapeutic agents with acute acalculous cholecystitis, particularly everolimus and sunitinib [45, 46]. Tirumani et al. examined the use of molecular-targeted therapies (sunitinib, bevacizumab, everolimus, and sorafenib) and associated gallbladder complications and found acute cholecystitis in 66 % of patients with variable onset between 2 weeks and 5 months [47]. These patients ultimately
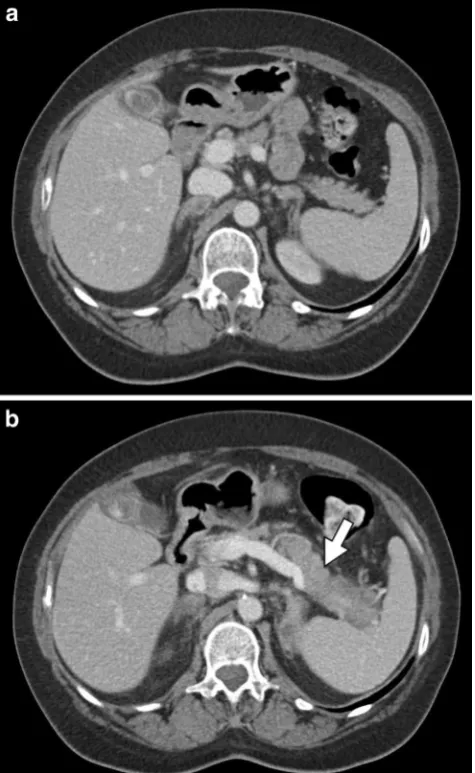
Fig. 6 A 59-year-old female patient with stage IV non-small cell lung carcinoma (NSCLC) and known metastatic disease to the adrenal glands treated with carboplatin, premetrexed, and bevacizumab.a Axial contrast-enhanced CT shows a normal pancreas prior to chemotherapy.
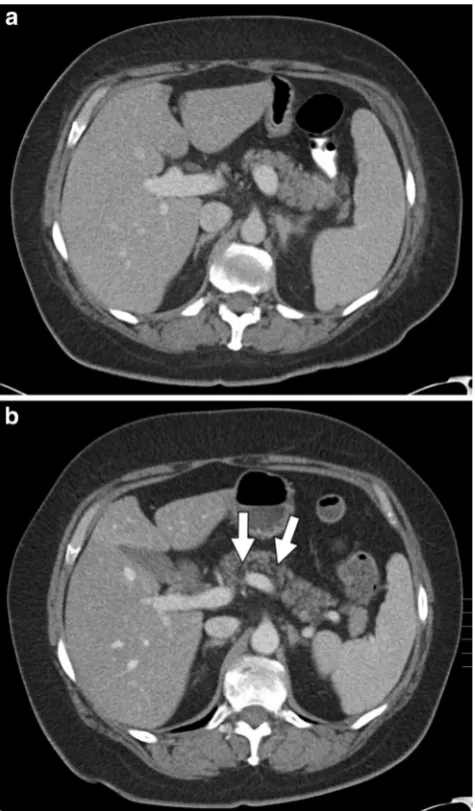
Fig. 7 An 11-year-old male with acute lymphoblastic leukaemia on combination therapy that includes L-asparaginase.a,bAxial and coronal CT images, respectively, show“walled-off”necrosis (arrows) of the pancreas
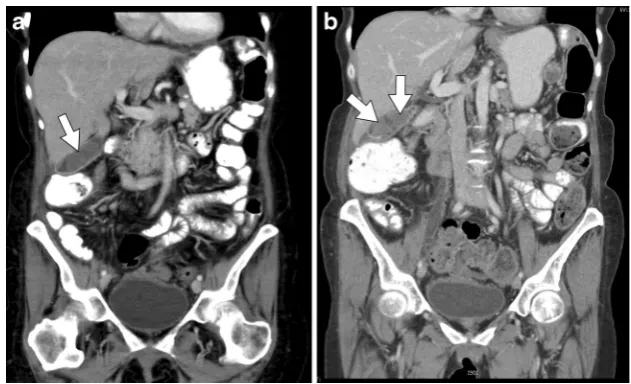
Fig. 8 A 51-year-old female with stage IIIc ovarian cancer treated with bevacizumab.a Axial contrast-enhanced CT of the pancreas pre-chemotherapy with normal findings (arrow).bRepeat axial contrast-enhanced CT 11 months after initiation of chemotherapy shows marked pancreatic atrophy as well as fatty replacement (arrow)
required dose reduction, temporary discontinuation of the therapy, or permanent discontinuation of the therapy with 50 % requiring either cholecystectomy or cholecystotomy [47]. US is the imaging modality of choice to diagnose acute acalculous cholecystitis. Sonographic findings of therapy-induced acalculous cholecystitis include gallbladder wall thick-ening (>3 mm), gallbladder distension, and pericholecystic fluid in the absence of cholelithiasis [48]. Findings associated with cholecystitis on CT include gallbladder distension (>40 mm), fat stranding, hyperaemia, and pericholecystic free fluid (Fig.11) [48].
Biliary inflammation
Oncologic agents are mainly excreted through the kidneys or the bile. Biliary excretion of certain oncologic agents may
cause changes in the biliary epithelium leading to biliary en-hancement on imaging. Common chemotherapeutic agents that are excreted through the bile include L-asparaginase, doxorubicin, epirubicin, and paclitaxel [49]. Common targeted therapeutics excreted through the bile include soraf-enib and sunitinib [49]. Excretion of these therapeutic agents may have adverse effects on the epithelium causing irritation, thickening, and inflammation, which can be visualised as en-hancement on CT and MR imaging (Figs.12and13).
Biliary sclerosis
Chemotherapy-induced biliary sclerosis (CIBS) is a well-known toxicity associated with hepatic arterial infusion pump chemotherapy (HAIPC) with floxuridine [50]. Chemothera-peutic agents can cause CIBS through adverse toxicity on the biliary system or ischaemic changes to the pericholangitic venous plexus, leading to stricture of the biliary ducts [7]. Ito et al. examined the incidence of CIBS following HAIPC with floxuridine and found 5.5 % incidence in patients receiving HAIPC after hepatectomy and 2 % incidence in patients re-ceiving HAIPC for unresectable disease [51]. CIBS can be managed with alternating infusion of an intrahepatic steroid or reduction in the chemotherapeutic dose while some cases may require stenting or dilatation [7].
The imaging findings of biliary sclerosis resemble those of primary sclerosing cholangitis and include a thickened and enhanced bile duct wall, bile duct stricture with the lumen measuring less than 3 mm, and periductal oedema [7,52]. The gold standard imaging modality for detecting biliary sclerosis is endoscopic retrograde choloangiopancreatography (ERCP) [52]. ERCP is excellent for visualising the biliary tree and has high sensitivity for detecting dilatations and strictures of the biliary tree. Magnetic resonance cholangiopancreatography (MRCP) is non-invasive and offers similar imaging advantages as ERCP, but without the risks that ERCP has such as infection and bleeding [52]. The use of ERCP allows for interventional steps to be taken if necessary such as stenting and biliary stric-ture dilatation while MRCP reduces the risk of complications because of its non-invasive nature [52].
Biliary stasis
In addition to the biliary enhancement, biliary stasis has been noted in our practice after initiation of tamoxifen and doxoru-bicin. Biliary stasis is a condition in which bile cannot be excreted from the liver into the duodenum and causes subse-quent formation of biliary sludge and biliary dilatation [53]. Cholestasis may present with a number of symptoms includ-ing scleral icterus and pruritis; however, drug-induced chole-stasis may be asymptomatic with elevated alkaline phospha-tase as the only manifestation [54]. US is the primary modality used for diagnosing biliary stasis and is characterised by
Fig. 10 A 75-year-old male with lung adenocarcinoma receiving tarceva chemotherapy.aAxial contrast-enhanced CT image performed prior to initiation of chemotherapy treatment shows normal pancreatic features.b
dilatation of the common bile duct (>7 mm) [53]. CT, cholan-giography, and MR may be used to confirm biliary dilatation as well as the presence of tumefactive sludge (Fig.14) [53]. Additionally, MR imaging is the modality of choice for non-invasive visualisation of the biliary tree and is useful in the diagnosis of many biliary conditions [53].
Effects of localised therapy
Transcatheter arterial chemoembolisation (TACE) is a widely used treatment for hepatocellular carcinoma. TACE is a pro-cedure that involves transarterial administration of a mixture of anticancer agents, such as doxorubicin or cisplatin, and
Fig. 11 A 54-year-old male with stage IV non-small cell lung cancer status post chemotherapy treatment with cisplatin and premetrexed.a,bAxial and sagittal contrast-enhanced CT images, respectively, show a distended gallbladder with diffuse gallbladder wall thickening (arrows) consistent with acute acalculous cholecystitis
Fig. 12 An 81-year-old female with stage IV recurrent squamous NSCLC treated with carboplatin, gemcitabine tarceva, and abraxane.a,
bAxial and coronal contrast-enhanced CT images, respectively, demonstrate a mildly dilated common bile duct (arrows) with thickened enhancing walls consistent with biliary epithelial irritation
iodised oil followed by embolising particles [55]. This allows for local administration of chemotherapeutic agents directly to tumours.
There are a number of imaging appearance changes that present following TACE. On CT, portions of the tumour that retain and accumulate iodised oil are necrotic and appear as non-enhancing foci while enhancing foci indicate viable tissue that may require additional treatment [55]. Kim et al. evaluat-ed the value of the unenhancevaluat-ed phase in assessing HCC after TACE and found that the use of the unenhanced phase could improve the detection of viable tumour tissue with viable HCC appearing hyperattenuating or isoattenuating on the he-patic arterial phase and hypoattenuating on the unenhanced phase [56]. However, accumulation of iodised oil may gener-ate considerable beam-hardening artefacts on CT that are not present on MRI [57]. In cases where there is a significant amount of iodised oil, MR imaging plays a vital role because of the artefact that appears on CT, resulting in difficulty de-tecting tumours using this modality [57]. On MRI, necrotic tissue will not demonstrate contrast enhancement while resid-ual tumours will appear as hyperintense lesions [58].
Awareness of the normal imaging findings after TACE will allow for better recognition of pathologic changes associated with post-TACE complications. The adverse effects of TACE have been well documented in the literature and include hepatic abscess, hepatic failure, pancreatitis, and bile duct injury [59].
Hepatic abscess
Hepatic abscess is a rare complication that can occur after TACE and may develop secondary to bacterial seeding of bilomas or from the necrotic core of an embolised hepatic tumour [60]. Marelli et al. found liver abscess formation in only 1.3 % of patients with VanderWalde reporting that pa-tients with a history of bilioenteric anastomosis or biliary
reconstruction are at greatest risk for developing abscesses [61, 62]. Woo et al. performed a study observing liver abscess formation after the TACE procedure with doxoru-bicin, iopamidol, and absorbable gelatin sponge embolisa-tion in patients with bilioenteric anastomoses and found that abscesses formed in 12 of 25 patients, significantly higher than the 1.3 % reported for the general patient population [63]. Moreover, Woo et al. reported that particulate embolisation or oily portogram significantly elevated the incidence of liver ab-scess [63]. Hepatic abab-scess formation may appear at 2 weeks post TACE and most can be treated successfully with a combi-nation of percutaneous drainage and antibiotic therapy [60,62]. Hepatic abscesses can be diagnosed with the highest sen-sitivity on CT imaging and present as hypoattenuating lesions with peripheral rim enhancement; however, imaging of the post-TACE liver commonly reveals gas formation within the areas of embolisation, which may confound hepatic abscess diagnosis and require aspiration for accurate diag-nosis [60, 64]. Additionally, MRI may play a helpful role in the detection, characterisation, and evaluation of liver abscesses because of its multiplanar capability and sensi-tivity to small differences in tissue composition [65].
Hepatic failure
Hepatic failure following TACE is dependent on the baseline hepatic function, with a higher incidence of liver failure in patients with Child C liver disease compared with B and A [60]. Due to the increased risk of complications, most individ-uals with Child C liver disease will not be accepted for TACE. Huang et al. conducted a prospective study finding acute liver failure in 13.4 % of patients with HCC following TACE per-formed with doxorubicin, Lipiodol, and Gelfoam cube embo-lisation [66] Acute liver failure was previously established as increased bilirubin≥2 mg/dl, increased Child-Pugh score≥2, or ascites within 14 days of the procedure [66]. Additionally,
Lu et al. investigated liver function damage following superselective TACE with low-dose versus conventional-dose anticancer drugs in HCC patients. Patients either re-ceived low or conventional dose mitomycin C, epirubicin, and carboplatin [66]. Anticancer drugs were administered with Lipiodol followed by either gelatin sponge or polyvinyl alcohol (PVA) particle embolisation [66]. Lu et al. found that both doses worsened liver function, which was evaluated with Child-Pugh scores, total bilirubin, albumin, and alanine ami-notransferase [66]. However, the conventional dose caused more severe impairment of liver function, suggesting that he-patic failure from TACE may be dependent on chemothera-peutic agent dosing [66].
Acute hepatic failure is primarily diagnosed clinically and confirmed with laboratory testing. Prolonged PT/INR, elevated aminotransferases, elevated bilirubin, and decreased platelet count are among the abnormalities that may be detected with laboratory tests [67]. Although the role of imaging is often limited, signs suggestive of hepatic failure can be seen on US, CT, and MR imaging. On US, liver failure presents as increased hepatic echogenicity, ascites, nodularity, and segmental hyper-trophy or ahyper-trophy [68]. Similarly, CT and MR can reveal asci-tes, surface and parenchymal nodularity, heterogeneous liver parenchyma, and segmental hypertrophy or atrophy [60,68].
Pancreatitis
Pancreatitis is an uncommon but severe complication of TACE. The incidence of this complication is rare, reported in only 1.7 % of TACE patients, and may occur because of reflux of chemoembolic agents to the pancreas [69, 70]. López-Benítez et al. investigated acute pancreatitis following TACE and found acute pancreatitis 24 h after the procedure in 15.2 % of patients with non-selected embolisation. The num-ber of procedures and volume of embolic material were found to be the most significant factors associated with incidence [71]. TACE-induced pancreatitis can be treated in the same manner as pancreatitis from other causes [70].
Awareness of this complication following TACE warrants routine monitoring of serum amylase and lipase and com-plaints of abdominal pain may raise suspicions of acute pan-creatitis related to TACE. As mentioned previously, pancrea-titis may be characterised on CT by fluid collections, peripancreatic fat stranding, or diffuse oedema within the pan-creas. Areas of low attenuation within the pancreas can indi-cate necrosis of pancreatic tissue.
Bile duct injury
Bile duct necrosis, biliary stricture, and biloma development can occur following TACE because of ischaemic injury to the biliary plexus [60]. Sakamoto et al. examined 972 patients to investigate the incidence of biloma formation after TACE
[72]; 3.6 % patients developed intrahepatic biloma following TACE therapy with the main risk factors being injection of a suspension of anticancer drugs versus a mixture, bile duct dilatation, and repeated chemoembolisations with a frequency of less than 3 months [72]. Miyayama et al. found main bile duct stricture with subsequent develop-ment of bile duct dilatation in 4 % of HCC patients after TACE performed with Lipiodol, epirubicin, and mitomycin C followed by gelatin sponge particles [73]. The main risk factor identified by Miyayama for development of main bile duct stricture following TACE is selective TACE of the caudate arterial branch and/or the medial segmental artery of the liver [73].
Biliary strictures and bilomas commonly require endoscop-ic or percutaneous drainage [60]. CT and MR can be used to diagnose bile duct complications and portal vein obliteration following TACE [74]. Bile duct injury can be seen as bile duct dilatation and areas of decreased attenuation, which is indica-tive of extrabiliary collection of bile [75]. MRCP allows for excellent evaluation of the biliary tree and fluid collections. When combined with a biliary contrast agent, MRCP is also able to detect and localise bile duct leaks [76].
Conclusion
Cancer therapy includes a wide array of different types of treat-ment, which includes chemotherapy, targeted therapy, and catheter-directed chemoembolisation. The intrinsic toxicity of these therapies contributes to their efficacy in combating tumour growth, but also to the adverse effects they have on healthy tissues. These toxic agents commonly affect the liver, pancreas, and biliary system. The different treatment modalities and anticancer agents can cause sinusoidal obstruction syn-drome, fatty liver, pseudocirrhosis, pancreatitis, pancreatic atro-phy, cholecystitis, biliary sclerosis, and biliary inflammation. These changes may result in severe complications for patients and even death. It is important to note that the imaging findings associated with the cancer therapy complications discussed are often similar to the findings seen with other causes of compli-cations unrelated to cancer therapy, making clinical information crucial when formulating treatment plans. Awareness and familiarisation with the imaging features associated with these cancer therapy-induced changes will allow for early detection of these complications and improved patient management and outcomes.
References
1. Robinson SM, Scott J, Manas DM SA White (2013) The assess-ment and manageassess-ment of chemotherapy associated liver injury, hepatic surgery. Prof. Hesham Abdeldayem (ed) ISBN: 978-953-51-0965-5. INTECH, doi:10.5772/53915
2. King PD, Perry MC (2001) Hepatotoxicity of chemotherapy. Oncologist 6:162–176
3. Robinson PJ (2009) The effects of chemotherapy on liver imaging. Eur Radiol 19:1752–1762
4. Sharma A, Houshyar R, Bhosale P, Choi J, Gulati R, Lall C (2014) Chemotherapy induced liver abnormalities: an imaging perspective. Clin Mol Hepatol 20:317–326
5. Hamer OW, Aguirre DA, Casola G, Lavine JE, Woenckhaus M, Sirlin CB (2006) Fatty liver: imaging patterns and pitfalls. Radiographics 26(6):1637–1653
6. Décarie PO, Lepanto L, Billiard JS, Olivié D, Lavallée JM, Kauffmann C et al (2011) Fatty liver deposition and sparing: a pictorial review. Insights Imaging 2(5):533–538
7. Torrisi JM, Schwartz LH, Gollub MJ, Ginsberg MS, Bosl GJ, Hricak H (2011) CT findings of chemotherapy-induced toxicity. Radiology 258:41–56
8. Maor Y, Malnick S (2013) Liver injury induced by anticancer che-motherapy and radiation therapy. Int J Hepatol 2013, Article ID 815105. doi:10.1155/2013/815105, 8 pages
9. Kalil AN, Coral GP, Santos FA, Gonzalez MC, Neutzling CB (2014) The association between preoperative chemotherapy and the prevalence of hepatic steatosis in hepatectomy for metastatic colorectal cancer. Arq Bras Cir Dig 27(2):120–125
10. Mohty M, Malard F, Abecassis M, Aerts E, Alaskar AS, Aljurf M et al (2015) Sinusoidal obstruction syndrome/veno-occlusive dis-ease: current situation and perspectives—a position statement from the European Society for Bone and Marrow Transplantation (EBMT). Bone Marrow Transplant
11. Ikezoe T, Togitani K, Komatsu N, Isaka M, Yokoyama A (2010) Successful treatment of sinusoidal obstruction syndrome after he-matopoietic stem cell transplantation with recombinant human sol-uble thrombomodulin. Bone Marrow Transplant 45:783–785 12. DeLeve LD, Shulman HM, McDonald GB (2002) Toxic injury to
hepatic sinusoids: sinusoidal obstruction syndrome (veno-occlusive disease). Semin Liver Dis 22:27–42
13. Seo AN, Kim H (2014) Sinusoidal obstruction syndrome after oxaliplatin-based chemotherapy. Clin Mol Hepatol 20:81–84 14. Stoneham S, Lennard L, Coen P, Lilleyman J, Saha V (2003)
Veno-occlusive disease in patients receiving thiopurines during mainte-nance therapy for childhood acute lymphoblastic leukemia. Br J Haematol 123:100–102
15. Fan CQ, Crawford JM (2014) Sinusoidal obstruction syndrome (hepatic veno-occlusive disease). J Clin Exp Hepatol 4(4):332–346 16. Zhou H, Wang Y, Lou H, Xu X, Zhang M (2014) Hepatic sinusoidal obstruction syndrome caused by herbal medicine: CT and MRI features. Korean J Radiol 15(2):218–225
17. Sangisetty SL, Miner TJ (2012) Malignant ascites: a review of prognostic factors, pathophysiology, and therapeutic measures. World J Gastrointest Surg 4(4):87–95
18. Jeong WK, Choi SY, Kim J (2013) Pseudocirrhosis as a complica-tion after chemotherapy for hepatic metastasis from breast cancer. Clin Mol Hepatol 19:190–194
19. Lee SM, Chang ED, Na SJ, Kim JS, An HJ, Ko YH et al (2014) Pseudocirrhosis of breast cancer metastases to the liver treated by chemotherapy. Cancer Res Treat 46:98–103
20. Qayyum A, Lee GK, Yeh BM, Allen JN, Venook AP, Coakley FV (2007) Frequency of hepatic contour abnormalities and signs of portal hypertension at CT in patients receiving chemotherapy for breast cancer metastatic to the liver. Clin Imaging 31:6–10
21. Jha P, Poder L, Wang ZJ, Westphalen AC, Yeh BM, Coakley FV (2010) Radiologic mimics of cirrhosis. Am J Roentgenol 190:993–999
22. Lee SL, Chang ED, Na SJ, Kim JS, An HJ, Ko YH et al (2014) Pseudocirrhosis of breast cancer metastases to the liver treated by chemotherapy. Cancer Res Treat 46(1):98–103
23. Lau GK (2008) Hepatitis b reactivation after chemotherapy: two decades of clinical research. Hepatol Int 2(2):152–162
24. Mahale P, Kontoyiannis DP, Chemaly RF, Jiang Y, Hwang JP, Davila M et al (2012) Acute exacerbation and reactivation of chronic hepatitis C virus infection in cancer patients. J Hepatol 57:1177–1185
25. Abu-Judeh HH (2002) TheBstarry sky^liver with right-sided heart failure. AJR Am J Roentgenol 178:78
26. Park SJ, Kim JD, Seo YS, Park BJ, Kim MJ, Um SH et al (2013) Computed tomography findings for predicting severe acute hepati-tis with prolonged cholestasis. World J Gastroenterol 19(16):2543– 2549
27. Morgan C, Tillett T, Braybrooke J, Ajithkumar T (2011) Management of uncommon chemotherapy-induced emergencies. Lancet Oncol 12:806–814
28. Singh V, Devata S, Cheng YC (2010) Carboplatin and docetaxel-induced acute pancreatitis: brief report. Int J Clin Oncol 15(6):642–644
29. Viswanathan C, Truong MT, Sagebiel TL, Bronstein Y, Vikram R, Patnana M (2014) Abdominal and pelvic complications of nonop-erative oncologic therapy. RadioGraphics 34:941–961
30. Motzer RJ, Rini BI, Bukowski RM, Curti BD, George DJ, Hudes GR et al (2006) Sunitinib in patients with metastatic renal cell carcinoma. JAMA 295(21):2516–2524
31. Saadati H, Saif MW (2010) Sorafenib-induced acute pancreatitis. JOP 11(3):283–284
32. Kobayashi Y, Kanemitu T, Kamoto A, Satoh M, Mori N, Yoshioka T et al (2011) Painless acute pancreatitis associated with sorafenib treatment: a case report. Med Oncol 28(2):463–465
33. Li M, Srinivas S (2007) Acute pancreatitis associated with sorafe-nib. South Med J 100(9):909–911
34. Ganeshan DM, Salem U, Viswanathan C, Balachandran A, Garg N, Silverman P et al (2013) Complications of oncologic therapy in abdomen and pelvis: a review. Abdom Imaging 38:1–21 35. Calculli L, Pezzilli R, Casadi R, Fiscaletti M, Gavelli G (2005)
Imaging techniques for acute necrotizing pancreatitis: multidetector computed tomography. 7:104–109
36. Shyu JY, Sainani NI, Sahni VA, Chick JF, Chauhan NR, Conwell DL et al (2014) Necrotizing pancreatitis: diagnosis, imaging, and intervention. RadioGraphics 34:1218–1239
37. Miller FH, Keppke AL, Dala K, Ly JN, Kamler VA, Sica GT (2004) MRI of pancreatitis and its complications: part 1, acute pancreatitis. Am J Roentgenol 183(6):1637–1644
38. Xiao B, Zhang XM (2010) Magnetic resonance imaging for acute pancreatitis. World J Radiol 28(8):298–308
39. O’connor OJ, McWilliam S, Maher MM (2011) Imaging of acute pancreatitis. Am J Roentgenol 197:221–225
40. Ganten MK, Schuessler M, Bruckner T, Ganten TM, Koschny R (2015) Pancreatic atrophy in hepatocellular carcinoma patients re-ceiving long-term treatment with sorafenib. Oncology
41. Hescot S, Vignaux O, Goldwasser F (2013) Pancreatic atrophy—a new late toxic effect of sorafenib. N Engl J Med 369:1475–1476 42. Stratton A, Murphy T, Laczek J (2012) Atrophic-appearing
pan-creas on magnetic resonance cholangiopancreatography as initial presentation of cystic fibrosis. Hawaii J Med Public Health 71(6):151–154
and relationship with the gender, age, and body constitution. Surg Radiol Anat 34:811–817
44. Syed AB, Mahal RS, Schumm LP, Dachman AH (2012) Pancreas size and volume on computed tomography in normal adults. 41(4): 589–595
45. Cetin B, Coskun U, Yildiz R, Buyukberber S, Baykara M, Benekli M (2010) Acute cholecystitis in a patient with metastatic renal cell carcinoma treated with everolimus: a case report. J Oncol Pharm Pract 17(3):274–278
46. Gomez-Abuin G, Karam AA, Mezzadri NA, Bas CA (2009) Acalculous cholecystitis in a patient with metastatic renal cell car-cinoma treated with sunitinib. Clin Genitourin Cancer 7:62–63 47. Tirumani SH, Krajewski KM, Shinagare AB, Jagannathan JP,
Ramaiya NK (2014) Gallbladder complications associated with molecular targeted therapies:clinical and imaging features. Clin Imaging 38:50–55
48. O’Connor OJ, Maher MM (2011) Imaging of cholecystitis. Am J Roentgenol 196(4):367–374
49. Superfin D, Iannuci AA, Davies AM (2007) Oncologic drugs in patients with organ dysfunction: a summary. Oncologist 12:1070– 1083
50. Hohn D, Melnick J, Stagg R, Altman D, Friedman M, Ignoffo R et al (1985) Biliary sclerosis in patients receiving hepatic arterial infusions of floxuridine. J Clin Oncol 3(1):98–102
51. Ito K, Ito H, Kemeny NE, Gonen M, Allen PJ, Paty PB et al (2012) Biliary sclerosis after hepatic arterial infusion pump chemotherapy for patients with colorectal cancer liver metastasis: incidence, clinical features, and risk factors. Ann Surg Oncol 19:1609–1617 52. Enns R (2008) The use of ERCP versus MRCP in primary
scleros-ing cholangitis. Gastroenterol Hepatol 4(12):852–854
53. Rogoveanu I, Ghenoea DI, Saftoiu A, Ciurea T (2006) The role of imaging methods in identifying the causes of extrahepatic cholesta-sis. Clin Imaging 15:265–271
54. Padda MS, Sanchez M, Akhtar AJ, Boyer JL (2011) Drug induced cholestasis. Hepatology 53:1377–1387
55. Agnello F, Salvaggio G, Cabibbo G, Maida M, Lagalla R, Midiri M et al (2013) Imaging appearance of treated hepatocellular carcino-ma. World J Hepatol 5(8):417–424
56. Kim HC, Kim AY, Han JK, Chung JW, Lee JY, Park JH et al (2002) Hepatic arterial and portal venous phase helical CT in patients treat-ed with transcatheter arterial chemoembolization for hepatocellular carcinoma: added value of unenhanced images. Radiology 225(3): 773–780
57. Kloeckner R, Otto G, Biesterfeld S, Oberholzer K, Dueber C, Pitton MB (2010) MDCT versus MRI assessment of tumor response after transarterial chemoembolization for the treatment of hepatocellular carcinoma. Cardiovasc Intervent Radiol 33(3):532–540
58. Yaghmai V, Besa C, Kim E, Gatlin JL, Siddiqui NA, Taouli B (2013) Imaging assessment of hepatocellular carcinoma response to locoregional and systemic therapy. AJR Am J Roentgenol 201: 80–96
59. Poggi G, Pozzi E, Riccardi A, Tonini S, Montagna B, Quaretti P et al (2010) Complications of image-guided transcatheter hepatic chemoembolization of primary and secondary tumours of the liver. Anticancer Res 30:5159–5164
60. Clark T (2006) Complications of hepatic chemoembolization. Semin Interv Radiol 23:119–125
61. Marelli L, Stigliano R, Triantos C, Senzolo M, Cholangitas E, Davies N et al (2007) Transarterial therapy for hepatocellular
carcinoma: which techinique is more effective? a systematic review of cohort and randomized studies. Cardiovasc Intervent Radiol 30(1):6–25
62. VanderWalde A (2009) Liver abscess as a complication of hepatic transarterial chemoembolization: a case report, literature review, and clinical recommendations. Gastrointest Cancer Res 3(6): 247–251
63. Woo S, Chung JW, Hur S, Joo SM, Kim HC, Jae HJ et al (2013) Liver abscess after transarterial chemoembolization in patients with bilioenteric anastomosis: frequency and risk factors. AJR Am J Roentgenol 200(6):1370–1377
64. Wang CL, Guo XJ, Qui SB, Lei Y, Yuan ZD, Dong HB et al (2007) Diagnosis of bacterial hepatic abscess by CT. Hepatobiliary Pancreat Dis Int 6:271–275
65. Elsayes KM, Narra VR, Yin Y, Mukundan G, Lammle M, Brown JJ (2005) Focal hepatic lesions: diagnostic value of enhancement pat-tern approach with contrast-enhanced 3D gradient-echo MR imag-ing. Radiographics 25(5):1299–1320
66. Huang YS, Chiang JH, Wu JC, Chang FY, Lee SD (2002) Risk of hepatic failure after transcatheter arterial chemoembolization for he-patocellular carcinoma: predictive value of monoethylglycinexylidide test. Am J Gastroenterol 97:1223–1227
67. Larson AM (2010) Diagnosis and management of acute liver failure. Curr Opin Gastroenterol 26(3):214–221
68. Romero M, Palmer SL, Kahn JA, Ihde L, Lin LM, Kosco A et al (2014) Imaging appearance in acute liver failure: correlation with clinical and pathology findings. Dig Dis Sci 59(8):1987–1995 69. Bae SI, Yeon JE, Lee JM, Kim JH, Lee HJ, Lee SJ et al (2012) A
case of necrotizing pancreatitis subsequent to transcatheter arterial chemoembolization in a patient with hepatocellular carcinoma. Clin Mol Hepatol 18(3):321–325
70. Ozçinar B, Güven K, Poyanli A, Ozden I (2009) Necrotizing pan-creatitis after transcathether arterial chemoembolization for hepato-cellular carcinoma. Diagn Interv Radiol 15(1):36–38
71. López-Benítez R, Radeleff BA, Barragán-Campos HM, Noeldge G, Grenacher L, Richter GM et al (2007) Acute pancreatits after embolization of liver tumors:frequency and associated risk factors. Pancreatology 7:53–62
72. Sakamoto I, Iwanaga S, Nagaoki K, Matsuoka Y, Ashizawa K, Uetani M et al (2003) Intraheptaic biloma formation (bile duct necrosis) after transcatheter arterial chemoembolization. Am J Roentgenol 181:79–87
73. Miyayama S, Yamashiro M, Okuda M, Yoshie Y, Nakashima Y, Ikeno H et al (2010) Main bile duct stricture occurring after trans-catheter arterial chemoembolization for hepatocellular carcinoma. Cardiovasc Intervent Radiol 33(6):1168–1179
74. Pelletier AL, Hammel P, Zappa M, Bedossa P, Rebours V, Hentic O et al (2008) Fatal bile duct necrosis: a rare complication of trans-catheter arterial chemoembolization in a patient with endocrine he-patic metastasis. Case Rep Gastroenterol 2:356–362
75. Yu JS, Kim KW, Park MS, Yoon SW (2001) Bile duct injuries leading to portal vein obliteration after transcatheter arterial chemoembolization in the liver: CT findings and initial observa-tions. Radiology 221:429–436