COMPREHENSIVE ANNUAL
FINANCIAL REPORT
For the Fiscal Years Ended
September 30, 2009 and 2008
Bureau of State Lottery
An Enterprise Fund of the State of Michigan
B
U R E A U O F
S
T A T E
L
O T T E R Y
An Enterprise Fund of the State of Michigan
C o m p r e h e n s i v e A n n u a l F i n a n c i a l R e p o r t
F o r t h e F i s c a l Y e a r s E n d e d S e p t e m b e r 3 0 , 2 0 0 9 a n d 2 0 0 8
Bureau of State Lottery, State of Michigan Comprehensive Annual Financial Report
for the fiscal years ended September 30, 2009 and 2008
TABLE OF CONTENTS
Page
INTRODUCTORY SECTION
Letter of Transmittal……….……….1
GFOA Certificate of Achievement……….……...9
Organization Chart and Principal Officials……….……….10
FINANCIAL SECTION Independent Auditors’ Report……… 11
Management’s Discussion and Analysis………. 13
Basic Financial Statements Statement of Net Assets………. 24
Statement of Revenues, Expenses and Changes in Net Assets…….……….25
Statement of Cash Flows……….26
Notes to Financial Statements……… 28
Supplementary Information Supplementary Schedule of Revenues and Expenses September 2009……...42
Supplementary Schedule of Revenues and Expenses September 2008……...44
Supplementary Schedule of Other Operating Expenses……….………...46
STATISTICAL SECTION Index……….. 47
Michigan Statistics Financial Trends……….. 49
Revenue Capacity………52
Debt Capacity………...54
Demographic and Economic Information……….55
Operating Information………..59
U.S. Lottery Statistics Industry Comparative Information……… 62
Compliance Information……….64 Independent Auditors’ Report on Internal Control Over Financial
Reporting and on Compliance and Other Matters Based on an Audit of Financial Statements Performed in Accordance with Government Auditing Standards
INTRODUCTORY SECTION
Lottery contributions to the School Aid Fund help
support our state public school programs and ensure
our kids receive a quality education.
JENNIFER M. GRANHOLM
GOVERNOR
STATE OF MICHIGAN
BUREAU OF STATE LOTTERY
LANSING
M. SCOTT BOWEN
COMMISSIONER
December 10, 2009
The Honorable Jennifer M. Granholm, Governor Members of the Legislature
Citizens of the State of Michigan
We are pleased to present to you the Comprehensive Annual Financial Report (CAFR) of the Bureau of State Lottery (Lottery) for the fiscal years ending September 30, 2009 and 2008. Lottery management is responsible for the accuracy of the financial data and the completeness of the contents of this report.
The Lottery is an enterprise fund within the State of Michigan and its financial statements are included in the State’s Comprehensive Annual Financial Report. This report presents only the activity of the Lottery as a single enterprise fund and is an overview of the Lottery’s operations.
The mission statement of the Lottery is as follows:
To maximize net revenues to supplement state education programs.
To provide fun and entertaining games of chance.
To operate all games and bureau functions with nothing less than total integrity.
Within the financial section of this CAFR, the Lottery’s Management Discussion and Analysis (MD&A) provides a detailed narrative of activities that occurred over this time period. This letter of transmittal is intended to complement the MD&A and should be read in conjunction with the MD&A.
The enabling legislation of the Lottery requires biannual and special post audits of all accounts and transactions of the Lottery by the Auditor General or by an independent public accounting firm appointed by the Auditor General. The Auditor General has contracted with an independent public accounting firm for these audits. The financial statements have been audited in accordance with auditing standards generally accepted in the United States of America and the standards applicable to financial audits contained in Government Auditing Standards, issued by the Comptroller General of the United States.
1
-All Lottery Profits support K-12 public education in Michigan 101 E. HILLSDALE z P.O. BOX 30023 z LANSING, MICHIGAN 48909
Profile of the Lottery
History
The Lottery was established under the authority of Public Act 239 of 1972 to generate funds to support Michigan’s public school system. The first lottery ticket was the Green Ticket which went on sale on November 13, 1972. On October 7, 1975, the first instant game ticket was sold. Online sales began June 6, 1977 with the introduction of the Daily 3 game. The first multi-state ticket sales for the Lottery were on August 31, 1996 for The Big Game (now called Mega Millions). Since its inception, more than $15.2 billion has been contributed to the School Aid Fund.
Lottery Products
The Lottery offers a variety of games in several styles of play: instant also known as “scratch” games; online games, where daily or more frequent drawings are conducted to select winning numbers; and Pull Tabs, which are similar to instant games but players pull a perforated tab instead of scratching off the ticket. These games are available to the playing public through close to 11,000 licensed Lottery retailers.
Instant Games
Instant games are played by scratching latex covering on each ticket to reveal prize symbols. A variety of games with different themes, play styles, price points and prize structures are available with an ongoing product offering of over 70 new games a year. The games offered are priced between $1 and $20 and prizes range from $1 to $2 million dollars.
Online Games
Online game tickets are generated by a terminal connected to a central system and drawings are conducted to determine the winning numbers. Drawings are every four minutes, twice a day, daily, or twice a week, depending on the game. Online games currently offered are Mega Millions, Classic Lotto 47, Fantasy 5, Daily 3, Daily 4, Keno, Raffle, and Club Keno and are played as follows:
Mega Millions
Mega Millions is a multi-state online game, formerly known as The Big Game. Players select from two pools of numbers: five numbers between 1 and 56 and one number between 1 and 46 for a chance to win a multi-million dollar jackpot prize. The jackpot starts at $12 million. This game offers nine ways to win with guaranteed prize amounts on lower prize levels. Drawings are conducted twice a week.
A total of 12 states participate in the Mega Millions game with Michigan, including California, Georgia, Illinois, Maryland, Massachusetts, New Jersey, New York, Ohio, Texas, Virginia and Washington.
Classic Lotto 47
Classic Lotto 47 is an in-state Lotto game. It was introduced May 15, 2005 and replaced the Winfall game. Players select 6 of 47 numbers in twice weekly drawings. Jackpots start at $1 million. Classic Lotto 47 offers four ways to win, with guaranteed prize amounts at the lower prize levels.
Fantasy 5
Fantasy 5 was introduced September 12, 2004, replacing the Rolldown game. Players pick 5 of 39 numbers, with rolling jackpots starting at $100,000 and daily drawings. Jackpots increase a minimum of $5,000 per draw and roll until a player matches all five numbers in a drawing. This game offers four ways to win with guaranteed prize amounts at the lower prize levels.
Daily 3 & 4 Games
The Daily 3 & 4 games are the Lottery’s longest running and most consistently popular games, representing 29% of total sales. Drawings are conducted twice a day, seven days a week. These games offer a wide variety of winning combinations and fixed prizes. The top prize for Daily 3 is $500; for Daily 4, $5,000.
Keno!
Keno! is another long-running game which started in 1990. Although the sales are less than 1% of total sales, it has a very strong and loyal player base. In this game, players chose 10 numbers from a pool of 80. The Lottery draws 22 numbers and if the player matches 10 of those 22 numbers, they win the jackpot prize of $250,000. There are also five other ways to win by matching combinations of the numbers drawn. Drawings are conducted daily.
Raffle Games
The first online Raffle game, introduced on November 12, 2006, was Millionaire Raffle and Super Raffle was added in April 2007. In 2009, two new Raffle games were introduced into the lineup. Lucky 7’s Raffle, the first $10 game, and Win for Life Raffle which offers a chance to win $1,000 a week for life. Each Raffle has a defined and limited pool of tickets available for sale. Each ticket purchased contains a unique raffle number issued sequentially across the on-line gaming system network. When the last raffle number is issued, the game will close and no additional tickets will be available for purchase. The prizes range from $70 to $2 million.
Club Games
Club Games were introduced in October 2003. Club Games are played by patrons of bars, restaurants and bowling centers. Club Games consist of an online Club Keno game, Lucky Streak and Pull Tab games. To play Club Keno, players select up to 10 numbers from a pool of 80. The Lottery draws 20 numbers and the more numbers the player matches, the more he or she wins. Results of the drawings, which are conducted every four minutes, are displayed on TV monitors located in the retailers’ establishments. Wagers can be placed from $1 to $20 and the top prize is $2 million. The Kicker option allows players to multiply their Club Keno prizes as much as 10 times. A new addition to Club Games in 2009 is The Jack. The Jack is a progressive jackpot game that grows with every four minute drawing. A player wins the progressive jackpot by matching all seven of their numbers with the Club Keno numbers for that drawing. Pull Tab games are similar to instant tickets but players pull a perforated tab instead of scratching off the ticket. A variety of different Pull Tab games are offered at one time. Bar-coding was added to Pull Tab tickets in 2009, allowing players to redeem their winning tickets at any Club Games retailer. Bar-coding has enhanced accountability and control of the tickets for the retailers. Ticket prices are 50 cents, $1 and $2 and top prizes range from $50 to $2,000.
Player City Internet Club
In June 2005 the Lottery introduced an Internet-based VIP club for players called Player City. Player City offers a variety of on-site activities in which players can participate. Points are earned for participation in surveys and other activities and these points are redeemable for entry into drawings for event tickets and other prizes. In addition, players who become members receive many benefits such as special prize drawings, exclusive offers only for Player City members, anniversary rewards redeemable for exclusive members-only rewards, and email alerts for jackpots and winning numbers. Membership in Player City is free.
Highlights of Fiscal Year 2009
Contribution to the School Aid Fund
The Lottery disbursed $724.5 million to the School Aid Fund. Lottery represents a steady source of revenue for our children’s schools.
Sales
Sales for 2009 surpassed $2.3 billion for the year.
Retailers Win Big with Commissions
Retailer commissions totaled $174.2 million in 2009.
Conversion of Retailer Gaming System Network
The new system brought a state of the art gaming system to the Lottery and its retailers and included new retailer terminals, new communications network, and all new computer systems. With the implementation of the new system retailers sell online and instant/pull tab products. There are no longer instant-only retailers.
Instant Game $2 Million Dollar Drawings
The Lottery conducted three separate instant game $2 million grand prize drawings in December, March, and June of fiscal 2009. Players who win $1,000 on any $20 instant game are entered in the drawings automatically. The $2 million drawings are held at special events such as Detroit Pistons basketball games or the Detroit Freedom Festival and create a great deal of excitement.
Budgetary System and Controls
The Lottery works with the Department of Management and Budget, Office of the Budget and the Legislature to create an annual appropriated budget for the administrative costs for the Lottery. The proposed appropriated budget is approved by the Legislature annually. This approved budget becomes a spending cap for administrative expenses and ticket revenues provide funding for operations. Revenue and net income forecasts are prepared throughout the fiscal year comparing estimates and forecasts to actual sales and expenses. This information is provided to the Office of the Budget and other state agencies in order to ensure Lottery projections are accurately reflected in state budget planning.
Economic Condition and Financial Information
Local Economy
The severe national economic recession is having negative repercussions in all major areas: personal consumption, business investment, employment, and foreign economies. Changes have been initiated by the Federal Reserve and U.S. Treasury to increase the flow of credit and stabilize the financial markets, but it will take time for the effects of these changes to be felt throughout the U.S. economy. Michigan’s economy and state revenue continues to be significantly affected by the national recession, weakened level of motor vehicle sales, tight credit conditions, poor housing market, high foreclosure rates, and the financial condition (or bankruptcy) of General Motors (GM), Chrysler, and Ford – and their suppliers. Significant restructuring, in the form of employment losses and plant closings, is expected to continue to occur in the Michigan motor vehicle sector. In September 2009, Michigan had the highest unemployment rate in the nation at the rate of 15.3% well above the national average of 9.8%.
Economists forecast job losses to slow during the balance of 2009 and expect that slow progress to continue through 2010. Jobs will continue to contract for the next two years, but only by 2.5% in the first quarter of 2010, with reductions moderating to 0.7% by the end of the year. Unemployment in Michigan is forecast to peak in 2010 at 15.8% falling to 15.1% by the end of 2011.
These issues and uncertainties in the economy will impact spending patterns and could impact Lottery sales.
Financial Information
The sale of Lottery tickets provides all funding for operations and the net income is disbursed to the School Aid Fund for K-12 education.
The operations involve sale of tickets, determination of winning tickets, payment of prizes, compensation to retailers, and administrative functions. The Lottery also provides $1 million a year to the Department of Community Health for gambling addiction programs.
The Lottery’s Commissioner is responsible to the Governor, Legislature and the citizens of the State for Lottery operations.
The Lottery’s goals and objectives ensure there is an ongoing effort to achieve operational efficiencies to not only maximize revenues but maximize profits for the School Aid Fund. Operational results are included in the Financial and Statistical Sections.
The Charitable Gaming Division’s net proceeds are dedicated to the state’s General Fund. These activities are discussed in the MD&A.
Accounting Systems and Policies
As an enterprise fund of the State of Michigan, the Lottery operates as a business within state government structure. The Lottery uses the accrual basis of accounting, following generally accepted accounting principles (GAAP) and governmental accounting standards board (GASB) pronouncements.
Internal Controls
The Michigan Lottery and the State of Michigan policies and procedures tightly control assets, inventory, computer systems, drawing studios and accounting. Separation of duties, internal controls, ongoing monitoring and evaluation of information as well as stringent employee, retailer and contractor standards all minimize risk of loss or theft. All employees, retailers and contractor employees must pass a security background check prior to being hired.
Debt Administration
Long-term liabilities for the Lottery are for payments owed to Lotto, Mega Millions, Raffle and Instant Game grand prize installment winners. These prize liabilities are funded by investments in U. S. Treasury zero-coupon bonds and State of Michigan general obligation capital appreciation bonds which are held to maturity.
Cash Management
Cash due from retailers for Lottery transactions is collected weekly by automated clearing house (ACH) electronic funds transfer. Monthly net income from Lottery operations is transferred to the School Aid Fund. Any excess cash is maintained in an account managed by the Michigan Department of Treasury. Short-term cash in the common cash fund is invested by Treasury following its policies and guidelines.
Risk Management
The Michigan Department of Management and Budget (DMB) controls risk management through two internal service funds administratively established during fiscal year 1989-1990.
These funds are self-insured for most general liability, property losses, portions of employee insurance benefit, employee bonding programs, employee theft, workers compensation and unemployment compensation claims. The Lottery is assessed annual premiums by DMB for risk management.
Long-term Financial Planning
The Lottery continues to work on new ways to attract players and increase sales. A marketing plan is developed each year. New games as well as variations of play on existing games are being researched.
Promotions, ongoing retailer recruitment, and retailer incentive promotions for the Club Games segment will continue in the next fiscal year.
Promotions through the online player community Player City encourage new membership and player awareness. Instant game variety, promotion of base games and retailer sales incentive bonus are all part of the strategy to grow sales.
Two new games to be introduced in 2010 are Powerball and Lucky Lines. Powerball is a multi-state game currently available in 33 lotteries and will be cross-sold in Mega Millions states beginning in early 2010. According to sales projections provided by GTECH, the Lottery can expect a major boost in revenue from the addition of a second high-jackpot game. Lucky Lines, an instant-win online game, is planned to launch in spring of 2010. Data from focus groups for the Lucky Lines game supports an overall increase in lottery spending and not a mere reallocation of dollars from existing games.
Because of current economic conditions and generally unfavorable retail climate in Michigan, only modest sales gains are anticipated for the next fiscal year.
Awards and Acknowledgements
Awards
The Government Finance Officers Association of the United States and Canada (GFOA) awarded a Certificate of Achievement for Excellence in Financial Reporting to the Lottery for its comprehensive annual financial report for the fiscal year ended September 30, 2008. This was the fourth consecutive year that the Lottery has achieved this prestigious award. In order to be awarded a Certificate of Achievement, a government must publish an easily readable and efficiently organized comprehensive annual financial report. The report must satisfy both generally accepted accounting principles and applicable legal requirements.
A Certificate of Achievement is valid for a period of one year. We believe that our current comprehensive annual financial report continues to meet the Certificate of Achievement Program’s requirements and we are submitting it to the GFOA to determine its eligibility for another certificate.
Acknowledgements
Preparation of this report would not be possible without the efficient and dedicated efforts of the Accounting Division of the Lottery. Their teamwork has greatly contributed to the success of this informative document.
Respectfully submitted,
Anita S. Wooton
Deputy Commissioner for Administration
M. Scott Bowen
Commissioner
-Bureau of State Lottery
Organization Chart and Principal Officials
September 2009
COMMISSIONER M. Scott Bowen
EXECUTIVE DIVISION
Vacant
ADMINISTRATION DIVISION Anita Wooton EXECUTIVE
SECRETARY MARKETING DIVISION
Thomas Weber INFORMATION
SECURITY
CHARITABLE GAMING DIVISION Mike Petersen
PLANNING & OPERATIONS
DIVISION Connie Roblee
SECURITY & INVESTIGATIONS
PUBLIC RELATIONS
ACCOUNTING
DEPARTMENT SERVICES
ADMINISTRATIVE SUPPORT
INSTANT GAME DEVELOPMENT
ADVERTISING & PROMOTIONS
CLUB GAME DEVELOPMENT
DRAWING UNIT
INFORMATION MANAGEMENT
GAMING
INSPECTION
GAMING CONTROL
DEPARTMENT OF INFORMATION TECHNOLOGY
APPLICATIONS & PROGRAMMING
COMPUTER OPERATIONS
TECHNICAL SUPPORT
STANDARDS & INTERNAL
AUDIT
HUMAN RESOURCES
SALES DIVISION Terry Bunting
REGIONAL OFFICES
SALES DEVELOPMENT
RETAILER SERVICES
DATABASE
-FINANCIAL SECTION
By selling or buying lottery products our retailers and
winners help to strengthen our business community and
reinvest in our state’s economy.
6639 Centurion Drive, Suite 170 Lansing, MI 48917 Phone (517) 323-9500 Fax (517) 323-8360
Independent Auditors’ Report
Mr. M. Scott Bowen, Commissioner Bureau of State Lottery, State of Michigan
and
Mr. Thomas H. McTavish, Auditor General State of Michigan
We have audited the accompanying financial statements of the business-type activities of the Bureau of State Lottery, State of Michigan (the “Lottery”), a proprietary fund of the State of Michigan, as of and for the six month periods and years ended September 30, 2009 and 2008, which collectively comprise the Lottery’s basic financial statements as listed in the accompanying table of contents. These financial statements are the responsibility of the Lottery’s management. Our responsibility is to express opinions on these financial statements based on our audits.
We conducted our audits in accordance with auditing standards generally accepted in the United States of America and the standards applicable to financial audits contained in
Government Auditing Standards, issued by the Comptroller General of the United States. Those standards require that we plan and perform the audit to obtain reasonable assurance about whether the financial statements are free of material misstatement. An audit includes examining, on a test basis, evidence supporting the amounts and disclosures in the financial statements. An audit also includes assessing the accounting principles used and significant estimates made by management, as well as evaluating the overall financial statement presentation. We believe that our audits provide a reasonable basis for our opinions.
As discussed in Note 1, the financial statements of the Bureau of State Lottery, State of Michigan, and are intended to present the financial position and the changes in financial position and cash flows of only that portion of the business-type activities of the State of Michigan that is attributable to the Bureau of State Lottery. They do not purport to, and do not, present fairly the financial position of the State of Michigan as of September 30, 2009 and 2008, and the changes in its financial position or where applicable, its cash flows for the years then ended in conformity accounting principles generally accepted in the United States of America.
In our opinion, the financial statements referred to above present fairly, in all material respects, the financial position of the business-type activities of the Lottery as of September 30, 2009 and 2008, and the changes in its financial position and its cash flows for the six month periods and years then ended in conformity with accounting principles generally accepted in the United States of America.
In accordance with Government Auditing Standards, we have also issued our report dated December 4, 2009, on our consideration of the Lottery’s internal control over financial reporting and our tests of its compliance with certain provisions of laws, regulations, contracts, and grant agreements and other matters. The purpose of that report is to describe the scope of our testing of internal control over financial reporting and compliance and the results of that testing, not to provide an opinion on the internal control over financial reporting or on compliance. That report is an integral part of an audit performed in accordance with
Government Auditing Standards and should be considered in assessing the results of our audit.
The management’s discussion and analysis presented on pages 13 through 22 is not a required part of the basic financial statements, but is supplementary information required by accounting principles generally accepted in the United States of America. We have applied certain limited procedures, which consisted principally of inquiries of management regarding the methods of measurement and presentation of the required supplementary information. However, we did not audit the information and express no opinion on it. The introductory section on pages 1 through 10 and the statistical section on pages 47 through 63 have been furnished to us and have not been subjected to the audit procedures applied in the audit of the financial statements. Accordingly, we do not express an opinion on the introductory or statistical sections.
Our audit was conducted for the purpose of forming opinions on the financial statements that collectively comprise the Lottery’s basic financial statements. The accompanying supplementary schedules, as listed in the accompanying table of contents, are presented for the purpose of additional analysis and are not a required part of the basic financial statements. The supplementary schedules have been subjected to the auditing procedures applied in the audit of the basic financial statements, and in our opinion, are fairly stated in all material respects in relation to the basic financial statements taken as a whole.
Lansing, Michigan
December 4, 2009
Management’s Discussion and Analysis
The following discussion of the Michigan Bureau of State Lottery’s (Lottery’s) financial performance provides an overview of the Lottery’s financial activities for the fiscal year ended September 30, 2009. Please read it in conjunction with the financial statements, which begin on page 24.
Using This Report
The Lottery is accounted for as an enterprise activity/proprietary fund, reporting on all of the activity’s assets and liabilities using the accrual basis of accounting, much like a private business entity. As such, this semi-annual report consists of a series of financial statements, along with explanatory notes to the financial statements and supplementary schedules. The Statement of Net Assets on page 24 and the Statement of Revenues, Expenses and Changes in Net Assets on page 25, report the Lottery’s net assets and changes in them.
By law, the Lottery is required to deposit all of its net income each fiscal year to either the State School Aid Fund (for income related to Lottery gaming activities) or the General Fund (for income related to Charitable Gaming activities). As a result, the net assets of the Lottery consist largely of capital assets (leasehold improvements and equipment) and investments held to fund future payments due on Lottery prizes that are annuities. To assess the Lottery’s financial position and financial health, the reader of these statements should pay particular attention to changes in the components of assets and liabilities as set forth in the Statement of Net Assets, and in changes in operating revenues, expenses, and disbursement expenses to other funds as set forth in the Statement of Revenues, Expenses, and Changes in Net Assets. In addition the reader should also refer to the accompanying notes to the financial statements.
Financial Highlights
• Operating revenues for Lottery gaming activities increased by $48.0 million, or 2.0%. Ticket sales, the primary operating revenue, strengthened during 2009 increasing by $47.4 million.
• Total revenues for all activities (including non-operating) increased $24.8 million or 1.0%.
• Non-operating revenues decreased by $23.2 million. The decrease is attributable to the changing market values during 2009.
• Total operating expenses for 2009 increased $86.5 million, or 5.4%. Of this increase, prize awards (net of unclaimed prizes) related to operating revenues from gaming activities increased by $84.3 million, or 6.4%, retailer and vendor commissions decreased $6.2 million, or 2.9%, while other operating expenses increased by $9.7 million, or 20.6%.
• Total expenses (including non-operating) for all activities increased $58.9 million or 2.5%.
• Disbursements to the School Aid Fund were $740.7 million in 2008 and $724.5 million in 2009, a decrease of $16.2 million or 2.2%. Net income disbursed to the General Fund related to Charitable Gaming activities increased by $1.2 million or 11.3%.
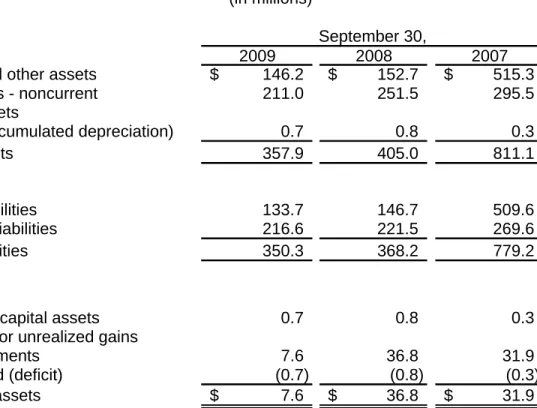
Net Assets
A summary of the Lottery’s net assets is presented below: Table 1 - Net Assets
(in millions)
September 30,
2009 2008 2007
Current and other assets $ 146.2 $ 152.7 $ 515.3
Investments - noncurrent 211.0 251.5 295.5
Capital assets
(net of accumulated depreciation) 0.7 0.8 0.3
Total assets 357.9 405.0 811.1
Current liabilities 133.7 146.7 509.6
Long-term liabilities 216.6 221.5 269.6
Total liabilities 350.3 368.2 779.2
Net assets
Invested in capital assets 0.7 0.8 0.3
Restricted for unrealized gains
on investments 7.6 36.8 31.9
Unrestricted (deficit) (0.7) (0.8) (0.3)
Total net assets $ 7.6 $ 36.8 $ 31.9
As shown in Table 1 above, the Lottery’s net assets decreased from $31.9 million in September 2007 to $7.6 million in September 2009. The State Treasurer, the Lottery’s delegated investment fiduciary, initiated the sale of investments of U. S. Treasury zero-coupon bonds in the amount of $249.4 million and the purchase of State of Michigan general obligation capital appreciation bonds in the amount of $249.4 million during 2009. The decrease in net assets is attributable to the sale and repurchase of the bonds and the changes in market value of those investments that the Lottery holds to fund future payments due on annuitized lottery prizes. Additional detailed information on investments may be found in Note 3 in the accompanying financial statements.
Capital assets consist of equipment and leasehold improvements. During fiscal year 2009, net capital assets decreased by approximately $.1 million since September 2008 and increased approximately $.4 million from September 2007. Information technology equipment was purchased during 2009. Additional detailed information on capital assets may be found in Note 4 in the accompanying financial statements.
Accounting principles dictate that the Lottery record in the financial records the gain or loss related to the change in market value of investments. U. S. Treasury zero-coupon bonds and State of Michigan general obligation capital appreciation bonds have been purchased for the payment of installment prize awards and are generally held to maturity. Therefore, the difference between the market value of these investments and the amortized book value is recorded as a restriction for unrealized gains on investments. The unrealized gain on investments is not available for disbursement to the School Aid Fund.
A detail of the Lottery’s liabilities is presented in Table 2 below: Table 2 - Liabilities
(in millions)
September 30,
2009 2008 2007
Current:
Warrants authorized and warrants outstanding $ 10.7 $ 11.4 $ 10.5
Accounts payable and other liabilities 5.1 4.7 4.8
Due to School Aid Fund - 11.7 10.9
Obligation for security lending - - 364.6
Prize awards payable (net of discount) 117.8 118.9 118.8
Total current 133.6 146.7 509.6
Non-current:
Prize awards payable (net of discount) 215.3 220.0 267.7
Compensated absences 1.4 1.5 1.9
Total non-current 216.7 221.5 269.6
Total liabilities $ 350.3 $ 368.2 $ 779.2
Non-current liabilities consist principally of prize liability for prizes paid in installments over several years. Long-term prize liability decreased by $4.7 million or 2.1% from 2008 to 2009 and decreased $52.4 million or 19.6% from 2007 to 2009. The decrease is attributable to the maturing of some long-term prize liabilities as well as minimal additions to the pool of annuitized installment prizes in all three years. Most prize winners eligible for annuity payments chose to have their payment in a lump sum rather than paid in installments. Refer to Note 6 in the accompanying financial statements for more information.
On September 30, 2008, Lottery’s participation in the security lending program was terminated by the State Treasurer.
The amount due to School Aid Fund decreased by $11.7 million between 2008 and 2009. In 2008 and 2007, there was a timing issue and those amounts represent funds not yet disbursed to the School Aid Fund. In 2009, there was no timing issue therefore cash was available and all funds were disbursed.
A summary of the Lottery’s change in net assets is presented in Table 3 below:
Table 3 - Changes in Net Assets (in millions)
September 30,
2009 2008 2007
Operating revenues $ 2,399.0 $ 2,351.0 $ 2,363.0
Operating expenses:
Prizes and direct game expenses
Prizes less unclaimed prizes (1,407.6) (1,323.3) (1,329.1) Commissions and game related expenses (228.0) (235.5) (235.7) Total prizes and direct game expenses (1,635.6) (1,558.8) (1,564.8) Income before other operating
expenses 763.4 792.2 798.2
Other operating expenses (56.7) (47.0) (45.3)
Operating income 706.7 745.2 752.9
Non-operating revenues and (expenses):
Investment and interest revenues 19.8 43.0 48.3
Investment and interest expenses (18.4) (31.0) (44.7)
School Aid Fund disbursement (724.5) (740.7) (748.9)
General Fund disbursement (11.8) (10.6) (10.8)
Community Health disbursement (1.0) (1.0) (1.0)
Net non-operating revenue (expense) (735.9) (740.3) (757.1)
Change in net assets (29.2) 4.9 (4.2)
Total net assets beginning of period 36.8 31.9 36.1
Total net assets end of period $ 7.6 $ 36.8 $ 31.9
Because the Lottery is required by law to deposit all of its net income (excluding the unrealized gain or loss on investments discussed above) to the School Aid Fund or General Fund, change in net assets does not reflect the result of the Lottery’s operating activities. The $724.5 million disbursement to the School Aid Fund reflects the Lottery’s operating activities for the fiscal year 2009. There was a decrease of $16.2 million or 2.2% from 2008 and a decrease of $24.4 million or 3.3% over 2007. The disbursement to the General Fund reflects Charitable Gaming activities. Charitable Gaming activities experienced an increase in net revenue for the fiscal year 2009 compared to 2008 and 2007. Charitable Gaming net income is disbursed annually to the General Fund.
Disbursements to other funds are detailed in Table 4 below: Table 4 - Disbursements to Other Funds
(in millions)
September 30,
2009 2008 2007
School Aid Fund $ 724.5 $ 740.7 $ 748.9
General Fund 11.8 10.6 10.8
Community Health 1.0 1.0 1.0
Total Disbursements to Other Funds $ 737.3 $ 752.3 $ 760.7
Revenues
The following chart shows the major sources and the percentages of operating revenues for the fiscal year ended September 30, 2009:
A detail of the Lottery’s revenues is presented in Table 5 below: Table 5 - Revenues
(in millions)
September 30,
2009 2008 2007
Operating revenues:
Instant tickets $ 749.1 $ 734.2 $ 717.8
Daily games 686.9 672.4 704.2
Mega Millions 222.7 184.8 218.1
Club games 548.0 563.9 529.7
Other games 170.8 174.8 172.8
Other operating revenue 21.5 20.9 20.4
Total operating revenues 2,399.0 2,351.0 2,363.0
Non-operating revenues:
Unrealized gain (loss) on investments (29.1) 4.9 (4.2)
Amortization on bonds 17.0 22.0 26.4
Other income 31.9 16.1 26.1
Total non-operating
revenue 19.8 43.0 48.3
Total revenues $ 2,418.8 $ 2,394.0 $ 2,411.3
Operating revenues for the fiscal year 2009, primarily Lottery ticket sales, increased over 2008 and 2007. The overall revenues increase in fiscal year 2009 over 2008 was $48.0 million or 2.0% and in fiscal year 2009 over 2007 by $36.0 million or 1.5%.
Instant game ticket sales increased by $14.9 million or 2.0% for fiscal year 2009 compared to fiscal year 2008. The new “spotlight” games are “Million Dollar Mega Play”, “Wild Time Mania” and “Casino Game Book”. A stronger marketing effort with more retailer involvement and an increase in advertising has been devoted to these games. This effort and several second chance drawing promotions has brought new excitement to the entire product line thus resulting in increased sales.
Mega Millions is a multi-state game offering larger jackpots with an occasional “mega-jackpot”. The states participating in Mega Millions with Michigan are California, Georgia, Illinois, Maryland, Massachusetts, New Jersey, New York, Ohio, Texas, Virginia and Washington. Sales for the fiscal year ended 2009 increased by $37.9 million or 20.5% compared to the fiscal year ended 2008. Sales in 2009 were $4.6 million more than in 2007. This increase is primarily due to more frequent large jackpot rolls (i.e. greater that $100 million) in 2009 compared to 2008 and 2007.
Club Games include Club Keno, Club Keno Kicker, Pull Tabs, and The Jack. The Jack, a new addition to Club Keno in June 2009, is a progressive jackpot game that grows with every drawing. Pull Tab games changed in April 2009 to bar-coded tickets that allow players to redeem their winning tickets at any Club Games retailer. The Club Games sales decreased in 2009 by $15.9 million or 2.8% from 2008, and increased by $18.3 million or 3.5% over 2007. Club Games were introduced October 27, 2003.
-Currently there are approximately 2,478 active Club Games retailers. Club Games are primarily sold in bars and restaurants licensed for on-premise alcohol consumption. Recruitment is ongoing to continue retailer expansion into this market.
Other games consist of Classic Lotto 47, Fantasy Five, Keno and Raffle. Classic Lotto 47 enjoyed increased sales due to large jackpot rolls during 2009. Keno sales also increased slightly over 2008. Raffle consists of one Super Raffle drawing, a $50 game and one Millionaire Raffle drawing, a $20 game. In 2009, two new variations of Raffle were introduced. The first is Lucky 7’s Raffle, a $10 game, introduced in early March 2009 and because of its success was again back in the lineup in July 2009. The second is Win for Life, a $20 game, introduced in May 2009 offering a top prize of $1,000 a week for life.
The decrease in non-operating revenues from 2008 to 2009 resulted from the reduction in unrealized gain on investments and bond amortization. As previously discussed, the unrealized gain or loss on investments is a reflection of the market value of the investments and does not impact the disbursement to the School Aid Fund. The reduction in bond amortization is due to a decreasing bond portfolio from maturing investments as well as the fact that most prize winners have elected the cash option, instead of installment payments. Other income increased from 2008 to 2009 due to the sale and purchase of investments. Additional detailed information on investments may be found in Note 3 in the accompanying financial statements.
Expenses
The following chart shows prizes, game costs and other operating expenses as a percentage of total operating expenses for the fiscal year ended September 30, 2009:
A detail of the Lottery’s expenditures is presented in Table 6 below: Table 6 - Expenses
(in millions)
September 30,
2009 2008 2007
Prizes:
Instant prizes $ 503.1 $ 482.0 $ 465.7
Online prizes 577.1 501.5 545.1
Club game prizes 356.1 367.2 344.5
Total prizes 1,436.3 1,350.7 1,355.3
Less: unclaimed prizes 28.7 27.4 26.2
Net prize awards 1,407.6 1,323.3 1,329.1
Direct game expenses:
Retailer commissions 174.2 172.1 172.7
Vendor commissions 35.4 43.7 43.9
Game related expenses 18.4 19.7 19.1
Total direct game expenses 228.0 235.5 235.7
Other operating expenses:
Salaries, wages and benefits 16.1 15.5 14.3
Other professional services 5.9 5.6 5.3
Printing and supplies 2.3 2.1 2.2
Other general and administrative 5.4 6.2 6.0
Promotion and advertising 27.0 17.6 17.5
Total other operating expenses 56.7 47.0 45.3
Total operating expenses 1,692.3 1,605.8 1,610.1 Non-operating expenses:
Security lending expenses - 10.3 19.8
Amortization of prize discount 18.4 20.7 24.9
School Aid Fund disbursement 724.5 740.7 748.9
General Fund disbursement 11.8 10.6 10.8
Community Health disbursement 1.0 1.0 1.0
Total non-operating expenses 755.7 783.3 805.4
Total expenses $ 2,448.0 $ 2,389.1 $ 2,415.5
The Daily Games prize payout increased overall in 2009 compared to 2008. The Daily 3 prize payout had an increase to 54.6% in 2009, compared to 48.9% in 2008 and 48.5% in 2007. The Daily 4 payout increased to 54.4% in 2009, compared to 44.9% in 2008 and 50.5% in 2007. Daily games are designed to yield an average prize payout of 50.0% and combined the games averaged a payout of 54.5% in 2009, compared to 47.0% in 2008 and 49.5% in 2007.
The Club Games prize payout percentage decreased to 64.7% in 2009, compared to 65.1% in 2008 and 65.0% for 2007. The higher Club Games payout is an important part of the appeal of this style of game in this market. The other online games have an anticipated payout between 50% and 62%.
Instant games had an overall payout of 67.2% in 2009, compared to 65.7% in 2008 and 64.9% in 2007. The games vary in payout percentage depending on selling price of a ticket for a game. Instant game prize payouts range from 60% for a $1 game to 74% for a $20 game. The increase in overall payout is related to increases in the prize structure in the various price payouts. The increase in instant game prize expense of 4.4% is related to the instant games sales increase and an increase in the overall payouts.
Retailer commissions have increased commensurate with higher overall sales. Vendor commissions and game related expenses have decreased due to the new vendor contract rates effective January 20, 2009.
Other operating expenses have increased by $9.7 million or 20.6% in 2009 due to additional marketing support promotions and advertising during the year.
Unclaimed Prizes
By law, Lottery prizes not claimed within one year of their drawing date are to be disbursed to the state School Aid Fund.
The Lottery recognizes the value of unclaimed prizes using an allowance methodology. Under the method, historical averages are utilized to estimate the amount of prizes awarded during the current year that will not be paid out due to claims not being filed for those prizes. The amounts estimated under the allowance method are recorded as a reduction of current year prize expense to match true prize expense to related sales.
Unclaimed prizes increased by $1.3 million from 2008 to 2009.
Charitable Gaming
Table 7 - Charitable Gaming Revenue, Expense, and Net Income (in millions)
2009 2008
September 30,
2007
Gross revenue $ 20.7 $ 18.9 $ 19.0
Operating expenses Net income
(8.9) 11.8 $
(8.3) (8.2) 10.6
$ $ 10.8
Charitable Gaming activities overseen by the Lottery include the licensing and regulation of charitable and certain other not-for-profit organizations that conduct bingo games, millionaire parties and raffles for fund-raising purposes. Charitable Gaming revenues increased by $1.8 million or 9.5% for fiscal year 2009 compared to fiscal year 2008. This increase is in license revenue and is attributable to the increased popularity of millionaire parties such as Texas Hold’em. The Lottery also oversees the distribution and sale of break-open tickets, (also for fund-raising purposes), to these same organizations.
The mission of the Lottery with respect to charitable gaming activities is to ensure that only qualified organizations are licensed to conduct fund-raising activities and that said activities are conducted in accordance with existing laws, rules and regulations. Revenues received through the issuance of licenses and from the distribution of break-open tickets are intended to cover the costs of overseeing the program activities and are not intended as a primary goal to generate revenue for the State. Any revenue in excess of program costs is disbursed annually to the state’s General Fund.
Other Potentially Significant Factors Impacting Next Year
Management anticipates an increase in Lottery sales in 2010 with the introduction of two new online games, Powerball and Lucky Lines. As a result of an agreement between the Mega Millions consortium of 12 states and the Multi-State Lottery Association representing Powerball, both tickets will be cross-sold in all U.S. lottery jurisdictions. Powerball will be introduced early next year and is drawn on Wednesday and Saturday nights. Lucky Lines is an online instant win game that will be introduced in late spring.
Contacting the Lottery’s Financial Management
This financial report is designed to provide the Legislature and the executive branch of government, the public, and other interested parties with an overview of the financial results of the Lottery’s activities and to show the Lottery’s accountability for the money it receives. Percentages presented in the Management’s Discussion and Analysis are based on the rounded figures presented in the tables. If you have questions about this report or need additional financial information, contact the Deputy Commissioner for Administration at the Michigan Lottery, P.O. Box 30023, Lansing, Michigan, 48909.
Bureau of State Lottery, State of Michigan
Statement of Net Assets
September 30, 2009 and 2008
2009 2008
Assets
Current assets
Equity in State Treasurer's Common Cash Fund $ 23,174,823 $ 3,509,734
Investments, at fair value 60,286,789 69,508,381
Accounts receivable including retailers - net 57,481,009 75,682,913
Inventory 5,263,188 3,851,009
Other current assets - 163,458
Total current assets 146,205,809 152,715,495
Noncurrent assets
Investments, at fair value 211,024,177 251,479,279
Capital assets
Leasehold improvements and equipment 4,355,093 4,194,250
Accumulated depreciation (3,629,992) (3,404,644)
Total capital assets 725,101 789,606
Total noncurrent assets 211,749,278 252,268,885
Total assets 357,955,087 404,984,380
Liabilities
Current liabilities
Warrants outstanding 2,027,290 1,936,579
Warrants authorized 8,706,323 9,454,337
Accounts payable and other liabilities 5,105,156 4,730,903
Due to School Aid Fund - 11,735,156
Prize awards payable - net of discount 117,821,647 118,845,722
Total current liabilities 133,660,416 146,702,697
Noncurrent liabilities
Prize awards payable - net of discount 215,301,727 220,001,247
Accrual for compensated absences, less current portion 1,357,222 1,507,937
Total noncurrent liabilities 216,658,949 221,509,184
Total liabilities 350,319,365 368,211,881
Net assets
Invested in capital assets 725,101 789,606
Restricted for unrealized gains on investments 7,635,722 36,772,499
Unrestricted (deficit) (725,101) (789,606)
Total net assets $ 7,635,722 $ 36,772,499
See Accompanying Notes to Financial Statements 24
Bureau of State Lottery, State of Michigan
Statement of Revenues, Expenses and Changes in Net Assets For the Six Months and Years Ended September 30, 2009 and 2008
Six Months Ended Years Ended
Operating revenues
Ticket sales
Charitable gaming and other
$ 2009 1,175,949,739 10,877,668 $ 2008 1,137,781,588 11,196,652 $ 2009 2,377,437,183 21,557,466 $ 2008 2,330,198,475 20,883,326
Total operating revenues 1,186,827,407 1,148,978,240 2,398,994,649 2,351,081,801
Operating expenses
Prize awards
Less - unclaimed prizes
715,172,412 (14,206,536) 656,055,161 (13,046,116) 1,436,372,709 (28,730,205) 1,350,734,965 (27,393,536)
Net prize awards 700,965,876 643,009,045 1,407,642,504 1,323,341,429
Retailer and vendor commission Game related expenses
Depreciation expense Other operating expenses
100,555,694 9,472,665 114,147 26,387,126 105,750,950 9,909,900 74,064 22,581,073 209,625,888 18,383,054 225,348 56,432,599 215,860,214 19,651,039 133,693 46,909,467
Total operating expenses 837,495,508 781,325,032 1,692,309,393 1,605,895,842
Operating income 349,331,899 367,653,208 706,685,256 745,185,959
Non-operating revenues
Investment revenue Interest on equity in State
Treasurer's Common Cash Fund Revenue from security lending
(786,931) 439,837 -582,490 1,271,932 4,485,267 18,729,006 1,081,202 -26,963,645 3,063,361 13,008,323
Total non-operating revenues (347,094) 6,339,689 19,810,208 43,035,329
Non-operating expenses
Security lending expenses Amortization of prize award obligation discount (3,752) (8,821,966) (3,470,292) (9,853,702) (6,592) (18,401,696) (10,261,883) (20,700,446) Total non-operating expenses
before disbursements (8,825,718) (13,323,994) (18,408,288) (30,962,329)
Disbursement to School Aid Fund Disbursement to General Fund Disbursement to Community Health
(372,432,868) (5,832,314) (495,000) (364,435,619) (5,566,185) (495,000) (724,469,621) (11,764,332) (990,000) (740,735,155) (10,638,365) (990,000)
Total disbursements (378,760,182) (370,496,804) (737,223,953) (752,363,520)
Total non-operating expenses (387,585,900) (383,820,798) (755,632,241) (783,325,849)
Net non-operating revenue
(expense) (387,932,994) (377,481,109) (735,822,033) (740,290,520)
Change in net assets (38,601,095) (9,827,901) (29,136,777) 4,895,439
Total net assets at beginning
of period 46,236,817 46,600,400 36,772,499 31,877,060
Total net assets at end of
period $ 7,635,722 $ 36,772,499 $ 7,635,722 $ 36,772,499
See Accompanying Notes to Financial Statements 25
Bureau of State Lottery, State of Michigan
Statement of Cash Flows
For the Six Months and Years Ended September 30, 2009 and 2008
Six Months Ended Years Ended
2009 2008 2009 2008
Cash Flows From Operating Activities
Cash collections from customers Payments to employees
Payments to suppliers Payments to prize winners Payments for retailer and
vendor commissions
$ 1,213,952,810 (7,905,827) (36,071,409) (725,866,573)
(100,555,694)
$ 1,149,427,842 (7,699,745) (27,764,198) (682,038,130) (105,750,950)
$ 2,416,861,480 (15,898,979) (60,518,257) (1,431,767,794)
(209,625,888)
$ 2,341,729,756
(15,194,996) (51,558,690) (1,391,665,568) (215,860,214) Net cash provided by
operating activities 343,553,307 326,174,819 699,050,562 667,450,288
Cash Flows From Noncapital Financing Activities
Disbursement to School Aid Fund Disbursement to General Fund Disbursement to Community Health
(444,469,621) (11,764,332) (990,000) (429,000,000) (10,638,365) (990,000) (736,204,776) (11,764,332) (990,000) (739,900,644) (10,638,365) (990,000) Net cash used for noncapital
financing activities (457,223,953) (440,628,365) (748,959,108) (751,529,009)
Cash Flows From Capital and Related Financing Activities
Acquisition of capital assets (146,235) (488,190) (160,843) (582,947)
Cash Flows From Investing Activities
Proceeds from the sale and maturity of investment securities Purchase of investments
Interest received
Security lending proceeds Security lending payments
252,701,117 (193,694,878) 673,561 -(3,752) 39,490,028 -2,207,263 4,714,893 (3,470,292) 286,056,130 (217,650,431) 1,081,202 163,458 (6,592) 76,870,089 -3,063,361 13,008,741 (10,261,883) Net cash provided by
investing activities 59,676,048 42,941,892 69,643,767 82,680,308
Net increase (decrease) in cash
and cash equivalents (54,140,833) (71,999,844) 19,574,378 (1,981,360)
Cash and cash equivalents at
beginning of period 75,288,366 73,572,999 1,573,155 3,554,515
Cash and cash equivalents at
end of period $ 21,147,533 $ 1,573,155 $ 21,147,533 $ 1,573,155
Continued
See Accompanying Notes to Financial Statements 26
Bureau of State Lottery, State of Michigan
Statement of Cash Flows
For the Six Months and Years Ended September 30, 2009 and 2008
Six Months Ended Years Ended
Reconciliation of net operating income to net cash provided by operating activities
Operating income Adjustments to reconcile operating income to net cash
provided by operating activities Depreciation expense
Bad debt expense
Amortization of prize award obligation discount
Net changes in assets and liabilities:
Inventory
Receivables from retailers Warrants authorized,
compensated absences, accounts payable, other
liabilities
Prize awards payable
2009
$ 349,331,899
114,147 166,263 (8,821,966) (956,667) 27,125,403 (7,327,041) (16,078,731) $ 2008 367,653,208 74,064 69,461 (9,853,702) 223,840 449,602 (3,266,271) (29,175,383) $ 2009 706,685,256 225,348 335,072 (18,401,696) (1,412,179) 17,866,831 (524,476) (5,723,594) $ 2008 745,185,959 133,693 119,861 (20,700,446) 197,558 (9,352,045) (510,599) (47,623,693)
Net cash provided by
operating activities $ 343,553,307 $ 326,174,819 $ 699,050,562 $ 667,450,288
Reconciliation of cash Reconciliation of cash and cash equivalents
Cash and cash equivalents at beginning of period Equity in State Treasurer's
Common Cash Fund $ 77,806,035
Warrants outstanding (2,517,669)
$ 74,720,953
(1,147,954)
$ 3,509,734 (1,936,579)
$ 4,586,019
(1,031,504)
Net cash and cash equivalents
at beginning of period $ 75,288,366 $ 73,572,999 $ 1,573,155 $ 3,554,515 Cash and cash equivalents at end of period
Equity in State Treasurer's
Common Cash Fund $ 23,174,823
Warrants outstanding (2,027,290)
$ 3,509,734
(1,936,579)
$ 23,174,823 (2,027,290)
$ 3,509,734
(1,936,579)
Net cash and cash equivalents
at end of period $ 21,147,533 $ 1,573,155 $ 21,147,533 $ 1,573,155
Schedule of noncash investing, capital, and financing activities
Increase (decrease) in fair value of
investments $ (7,822,688) $ (9,827,900) $ 1,641,631 $ 4,895,439
Disbursements to other funds (accrual)
Total noncash investing, capital,
and financing activities $
-(7,822,688) $
(11,735,156)
(21,563,056) $
-1,641,631 $
(11,735,156)
(6,839,717)
Concluded Concluded
See Accompanying Notes to Financial Statements See Accompanying Notes to Financial Statements
27 27
Bureau of State Lottery, State of Michigan
Notes to Financial Statements
NOTE 1 - SUMMARY OF SIGNIFICANT ACCOUNTING POLICIES Reporting Entity
The Bureau of State Lottery (the “Lottery”) was established by Michigan Compiled Laws Section 432.5 under authority of Article 5, Section 4, of the State Constitution.
Public Act 95 of 1996 allows the Lottery to participate in joint enterprises, such as multi-state lotteries, with other sovereignties. Michigan participates in Mega Millions, a jointly operated multi-state lottery comprised of 12 states: California, Georgia, Illinois, Maryland, Massachusetts, Michigan, New Jersey, New York, Ohio, Texas, Virginia and Washington. Net income from Mega Millions is disbursed to the School Aid Fund.
Basis of Presentation
The Lottery is classified as an enterprise fund of the State of Michigan. Accordingly, the Lottery’s financial statements are included in the State’s Comprehensive Annual Financial Report. The accompanying financial statements are not intended to present the financial position and results of operations of the State of Michigan or its enterprise funds.
Basis of Accounting
The financial statements are reported using the economic resources measurement focus and the accrual basis of accounting. The Lottery distinguishes operating revenue and expenses from non-operating items. The principal operating revenue of the Lottery is primarily comprised of sales from instant and online tickets. Operating expenses mainly consist of payments to instant and online prize winners and commissions to retailer agents and vendors. Excess revenue over expenses is designated for payment to the State School Aid Fund, except for the excess of revenue over expenses from charitable gaming activities, which is designated for payment to the State General Fund. All other revenues and expenses are reported as non-operating.
In accordance with Governmental Accounting Standards Board (GASB) Statement 20,
Accounting and Financial Reporting for Proprietary Funds and Other Governmental Entities That Use Proprietary Fund Accounting, the Lottery has elected not to apply Financial Accounting Standards Board statements and interpretations issued after November 30, 1989, to its financial statements.
Revenue Recognition
Revenue is recognized for instant games when tickets are activated by retailers. For online games, revenue is recognized and the related direct expenses of ticket sales are accrued based upon the known relationship of the amount of ticket sales to the amount of prizes for each game. This method of measuring revenue is necessary in order to properly match revenues and expenses.
Bureau of State Lottery, State of Michigan
Notes to Financial Statements
Statement of Cash Flows
For the purposes of the statement of cash flows, the Lottery considers equity in the State Treasurer’s Common Cash pool, net of warrants outstanding, to be cash equivalents.
Use of Estimates
The preparation of financial statements in conformity with accounting principles generally accepted in the United States (U. S.) of America requires management to make estimates and assumptions that affect the reported amounts of assets and liabilities and disclosure of contingent assets and liabilities at the date of the financial statements and the reported amounts of revenues and expenses during the reporting period. Actual results could differ from those estimates.
Equity in State Treasurer’s Common Cash Fund
The State Treasurer manages the State’s Common Cash pool, which is used by the Lottery. The pooling of cash allows the Treasurer to invest monies not needed to pay immediate obligations so that investment earnings on available cash are maximized. Investments of the pool are not segregated by fund; rather, each contributing fund’s balance is treated as equity in the pool and presented in this report as “Equity in State Treasurer’s Common Cash.”
Investment policies and risk categorization are included in the State of Michigan’s comprehensive annual financial report.
Investments
Investments are reported at fair value. Investments are in U. S. Treasury zero-coupon bonds and State of Michigan General Obligation Capital Appreciation bonds, Series 2009B. These investments are purchased to meet future installment payments to prize winners. Gains and losses are generally not realized on investments, as it is the Lottery’s and State Treasurer’s policy to hold the Lottery’s investments to maturity or liquidation. The difference between the fair value and the amortized cost is reflected as a restriction of Net Assets for unrealized gains on investments.
Inventory
Inventory consists of instant game tickets, pull tab game tickets and charity game tickets on hand and for sale at year end as well as merchandise prizes for games that have not started as of September 30, 2009 and 2008. The inventory is valued at cost, primarily using the weighted average method.
Provision for Doubtful Accounts
The Lottery establishes an allowance for bad debt for any retailer accounts receivable greater than 90 days old. A bad debt expense is recorded when the allowance is set up for these receivables. The amount of the allowance for doubtful accounts totaled $1,417,419 for the year ended September 30, 2009 and $1,144,529 for the year ended September 30, 2008.
Bureau of State Lottery, State of Michigan
Notes to Financial Statements
Capital Assets
The Lottery has established a $5,000 threshold for capitalization of purchases of assets, which include equipment and leasehold improvements, and they are reported in the Statement of Net Assets. Such assets are recorded at historical cost. Depreciation of equipment is computed using the straight-line method over five years, the estimated useful life of the assets. Information technology equipment is depreciated over three years, the estimated useful life of the assets. Building leasehold improvements are depreciated over eight years, the estimated useful life of the improvements. The costs of normal maintenance and repairs that do not add to the value of assets or materially extend asset lives are not capitalized.
Advance Wagers
All on line games may be played on an advance wager basis. An associated liability is recognized for all wagers received for drawings to be conducted after the end of the reporting period.
Warrants Authorized and Warrants Outstanding
Most of the Lottery’s disbursements are made through warrants issued by the State. Warrants requested by the Lottery are charged to the Lottery’s equity in the State Treasurer’s Common Cash Fund as they clear the State Treasurer’s account. Therefore, warrants outstanding represent drafts issued against the State Treasurer’s account, which have not cleared. Warrants requested by the Lottery, but not yet issued by the State, are reported as warrants authorized.
Unclaimed Prizes
Prizes not claimed within one year after the drawing date or after the expiration date indicated on the back of the instant game tickets are forfeited by the ticket holder. The Lottery estimates the amount of winning online and instant tickets which will not be claimed within one year after the drawing date for online tickets or after the expiration date for instant and pull tab tickets. All unclaimed prizes are disbursed to the state School Aid Fund as provided by state statute. Unclaimed prizes amount to $28,730,205 and $27,393,536 for the fiscal years ended September 30, 2009 and 2008, respectively.
Net Assets
Net assets represent the difference between assets and liabilities. Net assets invested in capital assets consist of equipment and leasehold improvements. The difference between the fair value of investments and the amortized book value of investments is reported as restricted for unrealized gains on investments and is not available for disbursement to the School Aid Fund.