Risk Adjustment
Introduction
Risk adjustment is a statistical process used to identify and adjust for variation in patient
outcomes that stem from differences in patient characteristics (or risk factors) across health care organizations. Depending on the presence of risk factors at the time of health care encounters, patients may experience different outcomes regardless of the quality of care provided by the health care organization. Comparing patient outcomes across organizations without appropriate risk adjustment can be misleading. By adjusting for the risks associated with outcomes of interest, risk adjustment facilitates a more fair and accurate inter-organizational comparison. Below is a general outline of the risk adjustment process being applied to selected national hospital quality measures:
• Measurement systems must prepare data for risk adjustment by first identifying the measure population for which risk adjustment is to be used.
• Relevant binary risk factors must be identified for the measure and recoded to indicate the presence or absence of the risk factor. However, for continuous risk factors, the actual value of the risk factor is used with some modifications.
• If required risk factors such as sex, age, or admission source are blank or missing, the measurement system must provide an estimated value for each of these missing risk factors. The measurement system is to keep a record of the number of missing values and report this information to the Joint Commission (via the data element Number of Cases with Missing or Invalid Risk Adjustment Data – note: this data element is being retired as of 10/1/2008 discharges).
• The measurement system must then apply the Risk Models included in the Risk Model Information File, provided by the Joint Commission, to their data to calculate predicted values for each episode of care in the measure population (i.e., numerators and
denominators) for risk adjusted measures. These are the predicted values that are transmitted to The Joint Commission as part of the hospital clinical data in XML format for each of the participating health care organizations.
• The system must then calculate aggregate each hospital’s risk adjustment data elements for the measure (e.g., Risk-Adjusted Rate) and transmit them to the Joint Commission in the aggregate HCO-level data file (X12) for each of the participating health care
organizations. Refer to the Aggregate Technical Implementation Guide for further details.
The risk model information files will be provided to measurement systems that have successfully embedded a national hospital quality measure set that requires risk adjustment for one or more measures. The Joint Commission reserves the right to update or modify risk models as necessary to provide the best and most current models available. It is strongly recommended that
modifications to existing risk factor coefficients as well as the addition and/or deletion of risk factors. Modifications may also include changes to risk factor definitions.
National hospital quality measures currently requiring risk adjustment: • AMI Inpatient Mortality (AMI-9)
• VBAC (PR-1)
• Inpatient Neonatal Mortality (PR-2) • Third or Fourth Degree Laceration (PR-3)
Since these four risk adjusted measures are proportion-type measures, the risk adjustment process will be similar for these measures. The following section describes in more detail the risk adjustment process that the performance measurement systems must implement. For illustration purposes, AMI-9 and PR-2 are referenced throughout this section.
Note: As more risk adjusted national hospital quality measures are added, this section will be updated.
Risk Model Application Steps
Measurement systems must complete the following steps in order to properly risk adjust and submit risk-adjusted data to the Joint Commission:
Step 1 -- Identify the measure population through Measure Category Assignments.
• Risk adjusted rate-based measure: Identify the numerator (Measure Category Assignment
= E) and the denominator (Measure Category Assignment = D) cases using the information provided in the Measure Information Form (MIF).
• Risk adjusted continuous variable measure: Identify the number of cases in the measure population (Measure Category Assignment = D). At this time, there are no risk adjusted continuous outcome measures in any of the national hospital quality measure sets. Note: Do not calculate a Predicted Value for a case if it is rejected by front-end edits or is rejected because one or more measures in the measure set evaluates to a Measure Category Assignment = X.
Step 2 -- Create risk factors for the measure.
Using the Risk Model Information File provided by the Joint Commission, identify all applicable EOC record data elements and the associated risk factor values for each of the EOC records identified in step 1.
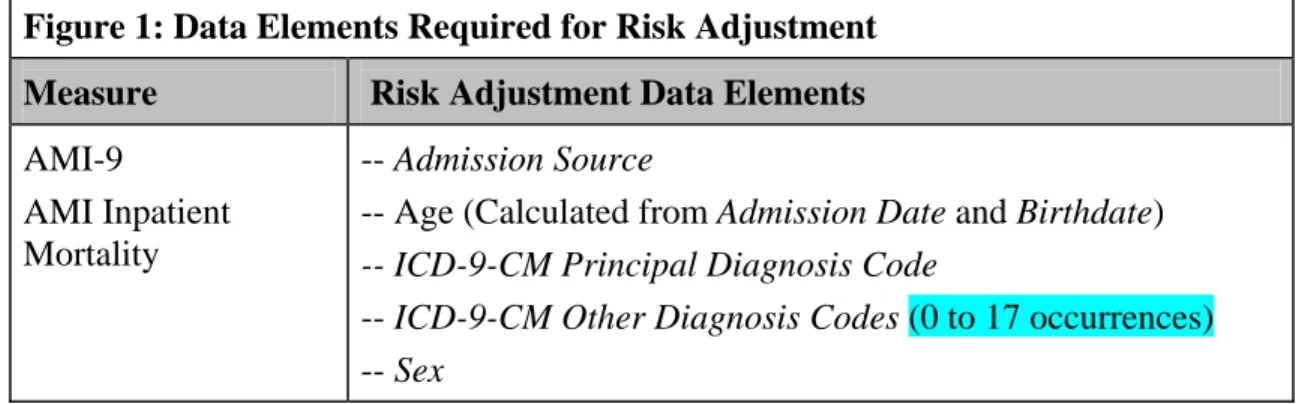
Risk factors include patient demographic and/or clinical factors, which can influence outcomes of care. Some examples of risk factors include age, sex, and comorbidities – such as diabetes or a history of hypertension. As an example, Figure 1 lists the data elements required for risk adjustment of AMI-9. Using the AMI-9 data set, the performance measurement system must identify the risk factors at the EOC record-level, and create data subsets for each participating hospital.
Note: Do not round the individual risk factors when calculating the Predicted Value. Rounding does not occur until the after the Predicted Value is calculated.
Figure 1: Data Elements Required for Risk Adjustment Measure Risk Adjustment Data Elements
AMI-9
AMI Inpatient Mortality
-- Admission Source
-- Age (Calculated from Admission Date and Birthdate) -- ICD-9-CM Principal Diagnosis Code
-- ICD-9-CM Other Diagnosis Codes (0 to 17 occurrences) -- Sex
A comprehensive list of the risk factors and corresponding definitions is provided in the
“Risk Factor Definition” section of this manual. In addition, an Excel spreadsheet that contains the specific diagnosis and procedure codes for each risk factor will be provided to performance measurement systems when the risk model information file is distributed. Overtime, new patient risk factors may be identified. Both the “Risk Factor Definition” section of this manual and the Excel spreadsheet will be updated when this occurs.
Risk factors can be classified into two types: binary (dichotomous) or continuous.
Binary risk factors are assigned a numerical value of one (1) to depict the occurrence or presence of a specific risk factor, or a zero (0) to depict the non-occurrence or absence of the risk factor in the EOC record. For example, binary risk factors can be constructed from the national hospital quality data elements Sex, Admission Source or ICD-9-CM Other Diagnosis Codes. The logic for creating a binary risk factor is illustrated in the following example.
Example: “RF05M” is the variable name assigned to Diabetes in Pregnancy.
Perform the following logic for each EOC record: If one or more diagnosis codes (ICD-9-CM Principal Diagnosis Code or ICD-9-CM Other Diagnosis Codes) are one of the identified codes, then RF05M = 1 (occurrence); else RF05M = 0 (non-occurrence).
Note: Use only the principal and 0 to 17 other diagnosis codes that are sent to The Joint Commission to evaluate the measure. Do not include additional diagnosis codes that may be available in the medical record but are not transmitted in the XML file to The Joint Commission.
Continuous risk factors can take on an infinite number (∞) of values, from -∞ to +∞.
They can be entered directly or created from other data elements. For example, the risk factor age is derived from national hospital quality measure data elements Admission Date and Birthdate.
Example: “AGEINT” is the variable name assigned to Integer Age.
Perform the following logic for each EOC record: Calculate the integer value of age. Use the month and day portion of Admission Date and Birthdate to yield the most accurate age. Once calculated, use the age in years, expressed as an integer. Do not round up.
Risk factor interactions may be used to explain the joint effect of two or more independent variables (risk factors) on a dependent variable (outcome of interest). Interactions occur when two or more risk factors not only have separate effects but also have combined effects on the outcome of interest. In other words when an interaction is significant, it is implied that the effect on the outcome interest of one factor depends on the level of another factor. For example the rate of AMI mortalities increases with age, however this rate is increased more if the patient is male. This implies a two-way interaction of age and sex.
In the measure risk adjustment process, the interaction will be depicted by two or more risk factors connected by an underscore as in AGEINT_SEXR, indicates an interaction of integer value of age and sex. For calculation purposes, the risk factor AGEINT is multiplied by the variable SEXR.
Example: If an interaction between age and sex has a coefficient of –0.0134 and the age is given as 55 and the sex is female, then the calculation for this interaction would be:
AGEINT = 55 and SEXR = 1 (female)
AGEINT_SEXR = (coefficient * AGEINT * SEXR) = (-0.0134 * 55 * 1) = 0.737
Step 3 -- Managing missing risk factor data.
Risk adjusting national hospital quality measures without assessing the extent of missing data for risk factors may result in the transmission of biased data. In particular, if missing data occur in a non-random fashion, the data analysis can be misleading. Several statistical methods exist that can be used to handle missing risk factor data.
Performance measurement systems are required to replace any missing risk factor data with estimated (or imputed) data using the procedures described below, regardless of the missing risk factor percentages.
If an EOC is a member of multiple measures, the missing risk factor data may be assigned a different estimated value for each measure. Replacement of missing risk factors occurs after each EOC’s Measure Category Assignment has been determined.
1. Missing data percentage: Calculate the number of EOC records per measure per hospital per month, that include one or more missing risk factors (i.e., contained in the Risk Model Information File) for the measure. Submit this number to the Joint Commission using the data element, Number Cases With Missing or Invalid Risk-Adjustment Data (note: this data element is being retired as of 10/1/2008 discharges). Performance measurement systems need to refer to the ORYX® Data Quality Manual
and Aggregate Technical Implementation Guidefor additional information.
2. Continuous risk factor: Calculate an estimated value using the arithmetic average (rounded to six decimal places) of all organizations’ denominator data (i.e. category Ds and Es) available for the measure.
• Age: calculate and retain only the integer portion. This estimated value should be inserted for all missing data occurrences of that risk factor for all hospitals. • Birth Weight: If birth weight is missing, then the ICD-9 codes should be used to
code the Birth Weight risk factors for PR-2. If a valid birth weight is present and it disagrees with the ICD-9 code for the birth weight risk factor, then the birth weight should be used to code the risk factor.
3. Binary risk factor: The estimated value used is the most frequently occurring response (or mode) for all organizations’ data available for the measure. This estimated value should be inserted for all missing data occurrences of the risk factor in question for all hospitals. When a tie occurs in the frequencies, use the baseline of 0 as the estimated value. It is very important to note that missing value replacements do not apply to clinical risk factors because these are derived from ICD-9-CM Codes. If an ICD-9-CM Other Diagnosis Code field, used to identify risk factor is not populated, it is assumed that no risk factor was associated with the patient in that field. It is therefore not likely at all that every ICD-9-CM Other Diagnosis Code data element field will be populated.
Step 4 -- Calculate the EOC predicted valuesusing risk model information file
Calculate the Predicted Values (case-level risk-adjusted data) for each EOC record using the risk model information provided by the Joint Commission.
The Joint Commission will specify the risk model equation type in the Risk Model Information File. Performance measurement systems must use the risk model equation to calculate predicted values. For example, AMI-9 uses logistic regression as the risk model equation type, since it is a rate-based proportion measure. Continuous variable measures (to be considered in the future) will utilize linear regression methods. Additionally, the Risk Model Information File will contain the measure’s risk factor variables and related regression coefficients. See Figure 2 for information concerning the layout of the Risk Model Information File. See Figure 3 for an example of a Risk Model Information File later in this section.
• Regression coefficients are a common component of risk models and are defined as a weight or number that indicates the associated relationship between a dependent variable (outcome of care) and an independent variable (risk factor).
• All calculations of Predicted Values are computed at the EOC record-level using measure population data (such as the AMI-9 data set).
• The Predicted Values are calculated by first multiplying regression coefficients by an appropriate risk factor value. If the risk factor is binary, then the value indicates the presence or absence of a factor. If the risk factor is continuous, then the risk factor is an appropriate value specifying a level of the variable. A more detailed explanation of this calculation process is given below.
• For each risk adjusted measure the Predicted Value is transmitted along with the EOC record to The Joint Commission in the Hospital Clinical Data XML File.
The following equation calculates the Predicted Value (y) [i.e., probability], rounded to 8 decimal positions, for rate-based measures:
e + 1 1 = (y) Value Predicted ) X * B + ... + X * B + B
Where:
o eV is the exponential function [also may be written as exp(V)] that is the value of the intercept parameter generated by each model;
o B0...Bn are the Joint Commission provided regression coefficients; and o X1...Xn are the calculated risk factor values.
The exponential value (e) is truncated to 8 decimal points for calculation purposes. The exponential value (e) is an irrational number that is a universal constant and is the base of natural logarithms. The exponential value should be used in the calculations rather than the exponential function.
e1=exp(1)=2.71828182
Step 5 -- Calculate the HCO-level aggregate risk adjustment data elements.
By aggregating the Predicted Value for each EOC, calculate each hospital’s risk adjusted data elements (e.g., Risk-Adjusted Rate) that are transmitted to The Joint Commission in the HCO-level data file (X12). Performance measurement systems need to refer to the ORYX Data
Quality Manual and Aggregate Technical Implementation Guidefor additional details, formulas, and transmission specifications.
Examples of Calculating Predicted Values
The following examples demonstrate steps used to calculate the Predicted Value (y) for an EOC record in a rate-based measure population.
Example 1: AMI Inpatient Mortality (AMI-9)
Suppose an AMI patient has the following risk factors. This patient’s predicted mortality probability can be calculated using a hypothetical risk model.
EOC Record
Data Element Value
Risk Factor Name
(Risk factors included in the model)
Risk Factor Value
Sex = female SEXR (male = 0; female = 1) X1 =1
Admission Date – Birthdate = 75 (age)
AGEINT = 75 X2 =75
Point of Origin for Admission or Visit = 5
ADMSRC56 = 5 or 6
(Admission Source =5 or 6; Yes = 1, No = 0)
X3 =1
ICD-9-CM Principal Diagnosis Code = 410.71
PRF203S (Yes=1, No=0) X4 =1
ICD-9-CM Other Diagnosis Code = 648.01
RF05M (Yes=1, No=0) X5 =1
ICD-9-CM Other Diagnosis Code = 305.1
RF06C (Yes=1, No=0) X6 =1
ICD-9-CM Other Diagnosis Code = V15.82
RF06HX (Yes=1, No=0) X7 =1
ICD-9-CM Other Diagnosis Code = 572.8
CRF414 (Yes=1, No=0) X8 =1
ICD-9-CM Other Diagnosis Code = 491.21
RF17 (Yes=1, No=0) X9 =0
ICD-9-CM Other Diagnosis Code = V45.82
RF207 (Yes=1, No=0) X10 =1
Example Regression Coefficients Provided by the Joint Commission for AMI-9: B0 = - 6.2596
B1 = + 0.1352
B2 = + 0.0573
B3 = + 0.5435
B4 = - 1.0815
B5 = + 0.2671
B6 = - 0.5340
B7 = - 0.3999
B8 = + 1.4786
B9 = + 0.5011
B10 = - 0.2424
Intercept Constant
Coefficient for SEXR (X1)
Coefficient for AGEINT (X2)
Coefficient for ADMSRC56 (X3)
Coefficient for PRF203S (X4)
Coefficient for RF05 (X5)
Coefficient for RF06C (X6)
Coefficient for RF06HX (X7)
Coefficient for CRF414 (X8)
Coefficient for RF17 (X9)
Using the risk factor values X1, X2, X3 ... X10 in the example EOC record, the Predicted Value
(y) and the regression coefficients from the example above can be calculated as follows:
Predicted Value (y) = V
e−
+ 1
1 ,
Where V= B0 + B1X1 + . . . + BnXn
Therefore, V in this example is calculated to be the sum of the following operations: V = - 6.2596 + 0.1352*(1) + 0.0573*(75) + 0.5435*(1) - 1.0815*(1) + 0.2671*(1) - 0.5340*(1) - 0.3999*(1) + 1.4786*(1) + 0.5011*(0) - 0.2424*(1)
= -1.7955
The Predicted Value (y) for the EOC in this example calculates to:
(y) = ( 1.7955) 1
1
− −
+e = 1.7955
) 71828182 .
2 ( 1
1
+ = 0.1422399730956, which rounded
to 8 digits is 0.14223997 After the predicted value is calculated for every EOC record in the measure population, the HCO-level risk-adjusted data elements (e.g., Risk-Adjusted Rate)can be calculated by aggregating EOC-level predicted values for each hospital.
Example 2: Inpatient Neonatal Mortality (PR-2)
Suppose a newborn’s birth weight was 1,400 grams (in this example captured by ICD-9-CM code). The predicted mortality probability can be calculated using a hypothetical risk model.
EOC Record
Data Element Value
Risk Factor Name
(Risk factors included in the model)
Risk Factor Value
Sex = female SEXR
(male = 0; female = 1)
X1 =1
ICD-9-CM Other Diagnosis Code = 765.21
RF351 (Yes=1, No=0) X2 =1
ICD-9-CM Other Diagnosis Code = 765.01
RF322 (Yes=1, No=0) X3 =1
ICD-9-CM Other Diagnosis Code = 765.21 and 765.01
RF351_RF322 (X2 * X3) X4=1
Example Regression Coefficients Provided by The Joint Commission for Inpatient Neonatal Mortality (PR-2):
B0 = - 3.545
B1 = - 0.2714
B2 = + 1.5223
B3 = + 0.9024
B4 = + 2.2064
Intercept Constant
Coefficient for SEXR (X1)
Coefficient for RF351 (X2)
Coefficient for RF322 (X3)
Coefficient for RF351_RF322 (X4)
Using the risk factor values X1, X2, X3 … X16 in the example EOC record, the Predicted Value (y)
and the regression coefficients from the example above can be calculated as follows:
Predicted Value (y) = V
e−
+ 1
1 ,
Therefore, V in this example is calculated to be the sum of the following operations: V = - 3.545 - 0.2714*(1) + 1.5223*(1) + 0.9024*(1) + 2.2064*(1) = 0.8147
The Predicted Value (y) for the EOC in this example calculates to:
(y) = 1(.8147)
1+e− = .8147
1
1 (2.71828182)+ − = 0.693110139942, which rounded to 8 digits is 0.69311014 In this example the newborn record would be assigned a predicted probability of 0.69311014 . This value is aggregated with the other EOC predicted probabilities in the PR-2 measure population to calculate the HCO-level risk adjusted data elements (e.g., Risk-Adjusted Rate) for each hospital.
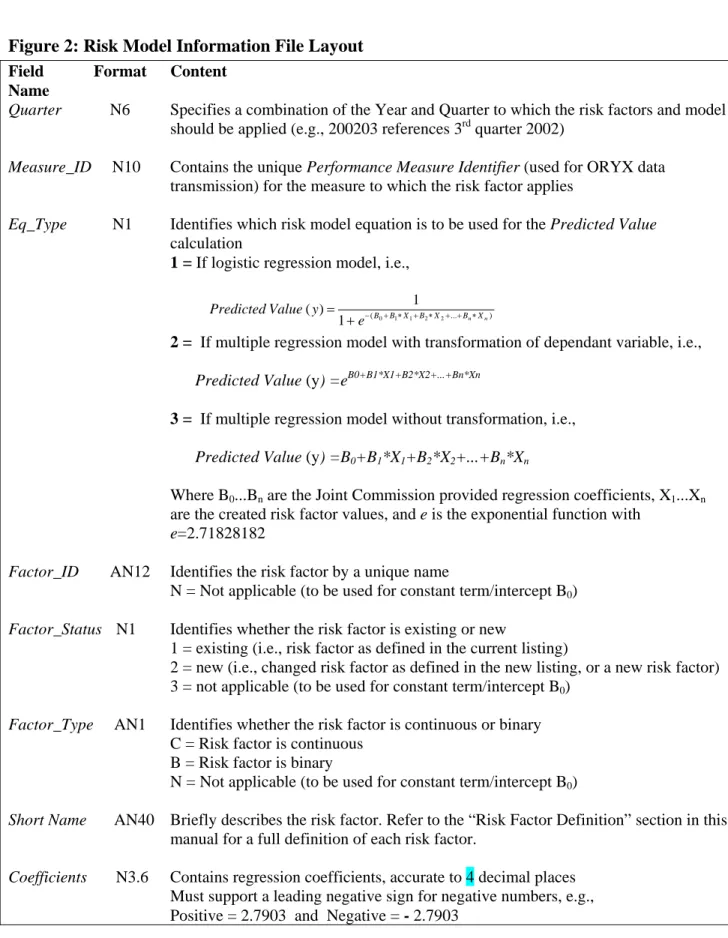
Figure 2: Risk Model Information File Layout
Field Format Content
Name
Quarter N6 Specifies a combination of the Year and Quarter to which the risk factors and model
should be applied (e.g., 200203 references 3rd quarter 2002)
Measure_ID N10 Contains the unique Performance Measure Identifier (used for ORYX data transmission) for the measure to which the risk factor applies
Eq_Type N1 Identifies which risk model equation is to be used for the Predicted Value
calculation
1 = If logistic regression model, i.e.,
) ... ( 0 1 1 2 2 1 1 ) ( n n X B X B X B B e y Value
Predicted − + ∗ + ∗ + + ∗ +
=
2 = If multiple regression model with transformation of dependant variable, i.e.,
Predicted Value (y) =eB0+B1*X1+B2*X2+...+Bn*Xn
3 = If multiple regression model without transformation, i.e.,
Predicted Value (y) =B0+B1*X1+B2*X2+...+Bn*Xn
Where B0...Bn are the Joint Commission provided regression coefficients, X1...Xn
are the created risk factor values, and e is the exponential function with
e=2.71828182
Factor_ID AN12 Identifies the risk factor by a unique name
N = Not applicable (to be used for constant term/intercept B0)
Factor_Status N1 Identifies whether the risk factor is existing or new
1 = existing (i.e., risk factor as defined in the current listing)
2 = new (i.e., changed risk factor as defined in the new listing, or a new risk factor) 3 = not applicable (to be used for constant term/intercept B0)
Factor_Type AN1 Identifies whether the risk factor is continuous or binary C = Risk factor is continuous
B = Risk factor is binary
N = Not applicable (to be used for constant term/intercept B0)
Short Name AN40 Briefly describes the risk factor. Refer to the “Risk Factor Definition” section in this manual for a full definition of each risk factor.
Coefficients N3.6 Contains regression coefficients, accurate to 4 decimal places Must support a leading negative sign for negative numbers, e.g.,
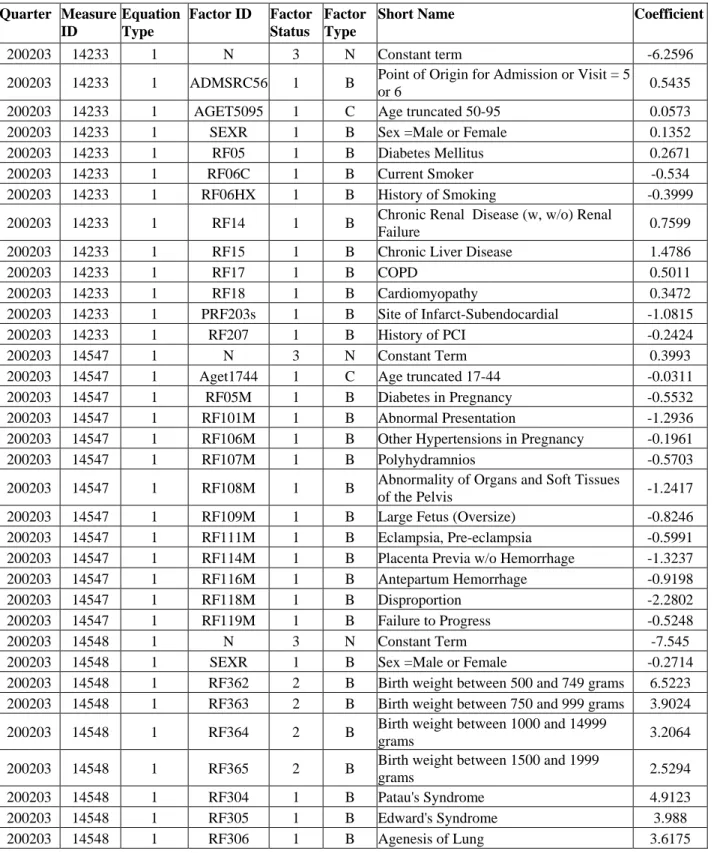
Figure 3: Risk Model InformationFile Example
This sample does not reflect the latest risk model information file. The current version of the complete risk model information file layout is provided to performance measurement systems on the Performance Measurement System Extranet Track (PET).
Quarter Measure ID
Equation Type
Factor ID Factor Status
Factor Type
Short Name Coefficient
200203 14233 1 N 3 N Constant term -6.2596
200203 14233 1 ADMSRC56 1 B Point of Origin for Admission or Visit = 5
or 6 0.5435
200203 14233 1 AGET5095 1 C Age truncated 50-95 0.0573
200203 14233 1 SEXR 1 B Sex =Male or Female 0.1352
200203 14233 1 RF05 1 B Diabetes Mellitus 0.2671
200203 14233 1 RF06C 1 B Current Smoker -0.534
200203 14233 1 RF06HX 1 B History of Smoking -0.3999
200203 14233 1 RF14 1 B Chronic Renal Disease (w, w/o) Renal
Failure 0.7599
200203 14233 1 RF15 1 B Chronic Liver Disease 1.4786
200203 14233 1 RF17 1 B COPD 0.5011
200203 14233 1 RF18 1 B Cardiomyopathy 0.3472
200203 14233 1 PRF203s 1 B Site of Infarct-Subendocardial -1.0815
200203 14233 1 RF207 1 B History of PCI -0.2424
200203 14547 1 N 3 N Constant Term 0.3993
200203 14547 1 Aget1744 1 C Age truncated 17-44 -0.0311
200203 14547 1 RF05M 1 B Diabetes in Pregnancy -0.5532
200203 14547 1 RF101M 1 B Abnormal Presentation -1.2936
200203 14547 1 RF106M 1 B Other Hypertensions in Pregnancy -0.1961
200203 14547 1 RF107M 1 B Polyhydramnios -0.5703
200203 14547 1 RF108M 1 B Abnormality of Organs and Soft Tissues
of the Pelvis -1.2417
200203 14547 1 RF109M 1 B Large Fetus (Oversize) -0.8246
200203 14547 1 RF111M 1 B Eclampsia, Pre-eclampsia -0.5991
200203 14547 1 RF114M 1 B Placenta Previa w/o Hemorrhage -1.3237
200203 14547 1 RF116M 1 B Antepartum Hemorrhage -0.9198
200203 14547 1 RF118M 1 B Disproportion -2.2802
200203 14547 1 RF119M 1 B Failure to Progress -0.5248
200203 14548 1 N 3 N Constant Term -7.545
200203 14548 1 SEXR 1 B Sex =Male or Female -0.2714
200203 14548 1 RF362 2 B Birth weight between 500 and 749 grams 6.5223 200203 14548 1 RF363 2 B Birth weight between 750 and 999 grams 3.9024 200203 14548 1 RF364 2 B Birth weight between 1000 and 14999
grams 3.2064
200203 14548 1 RF365 2 B Birth weight between 1500 and 1999
grams 2.5294
200203 14548 1 RF304 1 B Patau's Syndrome 4.9123
200203 14548 1 RF305 1 B Edward's Syndrome 3.988
Quarter Measure ID
Equation Type
Factor ID Factor Status
Factor Type
Short Name Coefficient
200203 14548 1 RF308 1 B Multiple Congenital Anomalies 1.7505 200203 14548 1 RF310 1 B Hydrops Fetalis not due to
Isoimmunization 2.9708
200203 14548 1 RF311 1 B Renal Agenesis 2.5632
200203 14548 1 RF312 1 B Severe Birth Asphyxia 3.4076
200203 14548 1 RF314 1 B Disseminated Intravascular Coagulation
in Newborn 1.2375
200203 14548 1 RF315 1 B Newborn Pulmonary Hemorrhage 1.0759
200203 14548 1 RF316 1 B Anomalies of Diaphragm 2.0084
200203 14548 1 RF318 1 B Necrotizing Enterocolitis in Fetus or
Newborn -0.4435
200203 14555 1 N 3 N Constant term -3.0134
200203 14555 1 MAGE20L 1 B Age <=20 -0.1289
200203 14555 1 RF102M 1 B Multiple Gestations -1.0043
200203 14555 1 RF109M 1 B Large Fetus (Oversize) 0.5608
200203 14555 1 RF118M 1 B Disproportion 0.4542
200203 14555 1 RF301M 1 B Precipitate Labor -0.8875
200203 14555 1 RF302M 1 B Episiotomy 0.4466
Risk Model Example AMI-9: Inpatient Mortality
2008 Release Notes
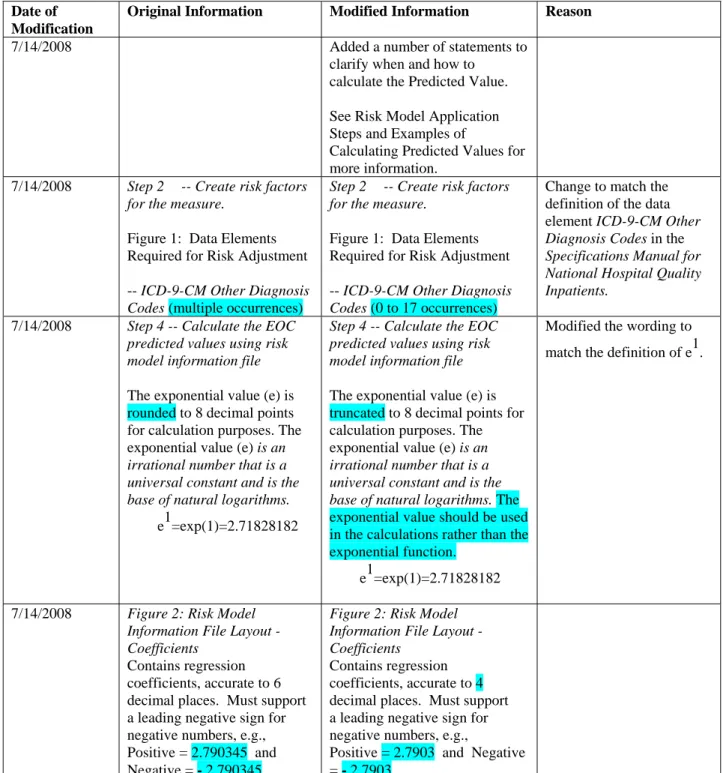
Items highlighted in yellow have been modified or added from the previous version of the manual.
These release notes detail the changes that have been made to this document since its initial version was provided to performance measurement systems on 1/7/2008. Items that have been modified or added are highlighted in blue.
Date of Modification
Original Information Modified Information Reason
7/14/2008 Added a number of statements to
clarify when and how to calculate the Predicted Value. See Risk Model Application Steps and Examples of
Calculating Predicted Values for more information.
7/14/2008 Step 2 -- Create risk factors for the measure.
Figure 1: Data Elements Required for Risk Adjustment -- ICD-9-CM Other Diagnosis Codes (multiple occurrences)
Step 2 -- Create risk factors for the measure.
Figure 1: Data Elements Required for Risk Adjustment -- ICD-9-CM Other Diagnosis Codes (0 to 17 occurrences)
Change to match the definition of the data element ICD-9-CM Other Diagnosis Codes in the
Specifications Manual for National Hospital Quality Inpatients.
7/14/2008 Step 4 -- Calculate the EOC predicted values using risk model information file
The exponential value (e) is rounded to 8 decimal points for calculation purposes. The exponential value (e) is an irrational number that is a universal constant and is the base of natural logarithms. e1=exp(1)=2.71828182
Step 4 -- Calculate the EOC predicted values using risk model information file
The exponential value (e) is truncated to 8 decimal points for calculation purposes. The exponential value (e) is an irrational number that is a universal constant and is the base of natural logarithms. The exponential value should be used in the calculations rather than the exponential function.
e1=exp(1)=2.71828182
Modified the wording to match the definition of e1.
7/14/2008 Figure 2: Risk Model Information File Layout - Coefficients
Contains regression coefficients, accurate to 6 decimal places. Must support a leading negative sign for negative numbers, e.g., Positive = 2.790345 and Negative = - 2.790345
Figure 2: Risk Model Information File Layout - Coefficients
Contains regression coefficients, accurate to 4 decimal places. Must support a leading negative sign for negative numbers, e.g.,
Positive = 2.7903 and Negative = - 2.7903
Date of Modification
Original Information Modified Information Reason
7/14/2008 Modified Risk Model Example
per the above discussions. Refer to symbols high-lighted in Blue to identify the changes.