www.nature.com/scientificreports
Establishment of the model system
between phytochemicals and gene
expression profiles in Macrosclereid
cells of Medicago truncatula
Fuyou Fu
1, Wentao Zhang
2, Yuan-Yuan Li
3& Hong Li Wang
1Macrosclereid cells, which are a layer in the seed coat of Medicago truncatula, accumulate large
amounts of phytochemicals during their development. But little is known about the complex and dynamic changes during macrosclereid cell development. To characterize the phytochemicals and the related gene expression during the development of M. truncatula macrosclereid cells, a high
performance liquid chromatography-mass spectrometry (HPLC-MS) assay and microarray study
were conducted on transcriptome changes from macrosclereid cell during seed development. A total
of 16 flavonoids by HPLC-MS and 4861 genes exhibited significant differences at transcript levels by microarray analysis were identified for macrosclerid cells at six different time points during seed development. 815 abiotic and biotic stress genes, 223 transcriptional factors (TFs), and 155 annotated transporter proteins exhibited differential expression during the development of macrosclereid cells. A total of 102 genes were identified as involved in flavonoid biosynthesis, phenypropanoid biosynthesis, and flavone and flavonol biosynthesis. We performed a weighted gene co-regulatory network (WGCNA) to analyze the gene-flavonoid association and rebuilt the gene regulatory network during macrosclereid cell development. Our studies revealed that macrosclereid cells are, beside as the first barrier of defense
against diseases, an excellent model system to investigate the regulatory network that governs
flavonoid biosynthesis.
Medicago truncatula, a member of the Fabaceae, has garnered considerable attention as a genomic and molecular model system for legume biological studies1, due to its small genome size, phenotypic variations, small size, short
life cycle, and completed genomic DNA sequence (www.medicago.org). To date, M. truncatula has been broadly used as a model plant for the study of root-rhizobial interactions, molecular regulation of nodule development2, 3,
lignin biosynthesis4, 5, seed coat development6, and flavonoid biosynthesis and transport7–9. However, few studies
have focused on the development of M. truncatula MC (MC), which are a specialized cell layer in the seed coat10.
In angiosperms, a mature seed consists of an embryo, a seed coat, and an endosperm. Many previous studies focused on embryo and endosperm development11, 12 and seed coat color control8, 13, 14. In fact, the seed coat plays
crucial roles in all species, i.e. protecting the embryo, limiting desiccation during dormancy and germination, and promoting seed dispersal15. In M. truncatula, the seed coat of M. truncatula is composed of several layers of
specialized cells, including a uniform palisade layer of MC called the Malpighian layer10. These MC are radially
elongated, and are covered by a thick cuticle layer on their outer surface. In order to reveal the development of MC and their role in mature seeds, we studied the cell development by light microscope and identified the phy-tochemicals present in MC by HPLC-MS.
Arabidopsis thaliana is a widely used model system for genetic analysis, and also has been used to study seed coat development. Several key genes involved in seed coat differentiation and proanthocyanidin (PA) biosynthe-sis regulation have been identified and characterized through studies of Arabidopsis seed coat mutants, and the PA biosynthetic pathway has been largely elucidated14, 16–18. In M. truncatula, several genes involved in seed coat
1Biology Department University of Arkansas at Little Rock, 2801 South University Ave. Little Rock, Arkansas, 72204,
USA. 2Aquatic and Crop Resources Development, National Research Council of Canada, 110 Gymnasium Place,
Saskatoon, SK, S7N 0W9, Canada. 3Nutrition Research Institute, University of North Carolina at Chapel Hill, 500
Laureate Way, Kanaplolis, 28081, NC, USA. Correspondence and requests for materials should be addressed to F.F. (email: [email protected]) or H.L.W. (email: [email protected])
Received: 1 November 2016 Accepted: 19 April 2017 Published: xx xx xxxx
differentiation, such as MATE18 and MATE29, have been identified and characterized. Many genes involved in
seed coat development, such as TT1, TT3, TT4, TT5, TT6, TT1019, TTG120, TT221, TTG222, TT823, TT724, TT128, 25,
and TT1926, have been identified using forward-genetic mutant screens. Although much is known about seed
coat development in Arabidopsis, M. truncatula, and other plants, many gaps remain in our understanding of this process. More over, it is extremely challenging to identify mutants with no visible phenotype, such as those with minor changes in metabolic processes. Global gene expression analysis is regarded as a useful alternative approach to identify additional genes and gene regulatory networks that are involved in seed coat development.
Although gene expression profiles have been applied to seed coat development studies for Arabidopsis27, 28 and M. truncatula13, 29, these studies mainly focused on providing some insights into seed coat development. A global
analysis of gene expression during seed coat development, particularly during macrosclereid development, has not yet been reported in M. truncatula. In the present study, we monitored morphological changes in developing MC using light microscopy and tracked the accumulation of flavonoids using HPLC-UV-MS. Furthermore, we conducted a comprehensive global analysis of gene expression in developing M. truncatula MC. Our studies indi-cated that TFs and structural genes involved in regulation the accumulation of flavonoid compounds in MC. The results of this study provide some insight into the distinct chemistry of developing MC.
Materials and Methods
Reagents and standards.
LC-MS reagents were obtained from Fisher Scientific (Rockford, IL, USA) and ultra-pure water was generated using the model Milli-Q Plus System (Billerica, MA, USA). Flavonoid standards were obtained from Indofine (Somerville, NJ, USA), Sigma-Aldrich (St. Louis, MO), and Chromax (Irvine, CA). All standards (Table S1) were previously described by Fu et al.30.Plant material.
Plants (Medicago truncatula, ecotype A17) were grown in pots containing a mixture of sand and perlite (2:8) under controlled growth chamber conditions with an average temperature of 23 °C, 50% humid-ity, and a 16-h photoperiod. Plants were watered/fertilized using a solution containing one tablespoon of Scotts Miracle-Gro per gallon water (Scotts Miracle-Gro Company, Marysville, OH, USA).Pod harvest and MC isolation.
Randomly selected flowers were tagged (using small different colored tags and strings) on the day after pollination10. Whole pods were collected at various days post pollination (DPP; from6 to 27 DPP). The seeds were immediately extracted from the harvested pods on ice. MC were isolated from the seed using an Olympus-SZX16 (10×, Olympus America Inc., Melville, NY, USA) on ice and rapidly placed in liquid nitrogen and stored at −80 °C for LC-ESI-MS and gene expression analyses.
Tissue preparation and light microscopy observations.
Tissues were prepared and light microscopy observations were made as previously described10. All sections were stained with Toluidine Blue O at pH 4.4 andobserved with an Olympus-BH2 microscope (Olympus America Inc., Melville, NY, USA). Digital photomicro-graphs were acquired using a SPOT Insight Camera (Diagnostic Instruments, Inc., Sterling Heights, MI, USA).
Flavonoid extraction.
Frozen MC (100 mg per aliquot in fresh weight) were homogenized in 80% 1 ml methanol, and the suspension was placed in an ultrasonic bath for 1 h. The extract was centrifuged at 13000 rpm for 20 min at room temperature and the supernatant was filtered using 4.6 µm pore-diameter filters (Fisher Scientific, St. Louis, USA). The filtered solution was subjected to LC-MS analysis. The insoluble PAs (in-PAs) measurement was followed the method as previously described by Liang et al.31.HPLC-ESI-MS instrumentation.
Phytochemical constituents were analyzed using an LC-MS/MS system comprised by an Agilent 1100 HPLC system (Hewlett-Packard, Palo Alto, CA, USA) with DAD detector and a Bruker Esquire 3000 ion-trap mass spectrometer (Bruker Daltonics, Bremen, Germany). The separation of ana-lytes was carried out on a C18 column (4.6 × 250 mm, 5 µm) from Grace (Grace, Maryland, USA). The detection wavelength for UV signal was acquired at 600 nM, and the scan range was from 200 to 600 nm. The mobile phase of HPLC consisted of (A) water containing 0.1% formic acid (v/v), and (B) acetontrile, and the elution gradient was set as: 0 to 5 min, isocratic 95% A and 5% B; 5 to 10 min, isocratic 10% B; 10 to 17 min, isocratic 17% B; 17 to 25 min, isocratic 25% B; 25 to 30 min, isocratic 30% B; 30 to 55 min, isocratic 55% B; 55 to 65 min, isocratic 70% B; 65 to 70 min, isocratic 5% B; and 70 to 75 min, isocratic 95% A and 5% B. The flow rate was at 0.8 ml min−1 andthe column temperature was maintained at 25 °C. LC-MS data was acquired in negative mode with mass range from 50 to 2200 m/z. The key parameters for ion-trap mass spectrometer (ITMS) were set as follows: ion source voltage, 3.5 kV; capillary temperature, 350 °C; and ion current control (ICC), 10,000 with a maximum acquisition time of 100 ms. The MS/MS data was obtained in a manual mode for targeted mass using an isolation width of 2.0, a fragmentation amplitude of 2.2, and a threshold set at 6000.
RNA isolation and qRT-PCR.
RNA was extracted from frozen MC using the Spectrum™
Plant Total RNA Kit with on-column DNaseI digestion (Sigma-Aldrich, St. Louis, USA). For cDNA synthesis, 1 µg of total RNA was reverse transcribed using the iScript cDNA Synthesis Kit (Bio-Rad Laboratories, USA), which contains MMLV-derived reverse transcriptase and is primed with random primers. Diluted fractions were used for PCR analysis (S1000™
Thermal Cycler, Bio-Rad Laboratories, USA). Medicago UBQ10 was amplified for 25 cycles (94 °C for 30 s, 55 °C for 30 s, and 72 °C for 30 min).www.nature.com/scientificreports/
relative quantification32 using Medicago UBQ10 and Medtr7g089600 as references. Gene expression was
expressed as mean and standard error calculated based on three biological replicates with three technical repli-cates for each biological replicate.
Microarray data processing and analysis.
Twenty-two macrosclereid RNA samples underwent microar-ray analysis using the GeneChip Medicago Genome Armicroar-ray33. The Bioconductor R package34 was used for geneexpression analysis. Briefly, raw microarray data in CEL files were imported into Bioconductor using the R pack-age affy and background correction was performed using the RMA (Robust Multi-Array Averpack-age) method35.
Genes that were differentially expressed throughout seed development were identified by ANOVA of the RMA expression values using the Limma R package36. Multiple testing correction was applied to the p-values of the
F-statistics to adjust the false discovery rate. All genes with adjusted p-values of <0.001 were identified for fur-ther analysis. In this study, we only identified the significantly differentially expressed genes (DEGs) during MC development of M. truncatula. Hence, the genes with a fold-change of ≥3.0 were analyzed further. Furthermore, to identify the putative function of the genes exhibited significant expression changes during MC development, their sequences were BLASTN-searched againist Medicago genome sequences (Mt 4.0V1, http://jcvi.org/medi-cago/)37 using BLAST+ 2.6.038 (E-value = 1e −10) to acquire a Genoscope ID number. The latest annotations
for all Genoscope IDs and relational Network IDs, InterPro domain IDs, Gene Ontology IDs, Uniprot IDs and functions were published37, and were used as the reference for functional category and annotation.
Bioinformatic analysis.
Gene Ontology (GO) analysis was performed using agriGo39. Gene functionontol-ogy terms were characterized with Mapman40, 41 ontology terms and mapped into different biological pathways
with tools embedded in the Mapman software40, 41. Gene function enrichment analysis within the detected
mod-ules was performed using the chi-square test (p-value < 0.05 after Benjamini-Hochberg correction). Transcripts found to be significantly differentially expressed during MC development were used to construct a weighted gene co-regulatory network (WGCNA) using a step-by-step method implemented in the WGCNA R package42.
Firstly, a pairwise gene correlation matrix was calculated with a Pearson correlation analysis and transformed into a weighted matrix (called the adjacency matrix) with a scaling factor beta (β= 13) under the assumption that biological networks are scale free. Weights indicate the connection strength between gene pairs. Then, a dendro-gram was generated with a hierarchical clustering method from the adjacency matrix. Consequently, modules (a cluster of genes with similar expression pattern) were identified by a dynamic tree-cut algorithm with a mini-mum module size of 30 genes and a high cutoff value at 0.3. The module eigengenes (first principal component) were estimated with principal component analysis (PCA). Finally, modules and their relationship to external traits were also identified using tools in this package42 by Pearson correlation analysis between the modules and
external traits. The flavonoid pathway network in MC was generated with a hard cut-off value of |r| = 0.85, which made the network follow a roughly power-law distribution43, 44. Identified gene interactions were imported into
Cytoscape45 version 3.0.2 for visualization and additional analysis.
Results and Discussion
Development of MC in
M. truncatula.
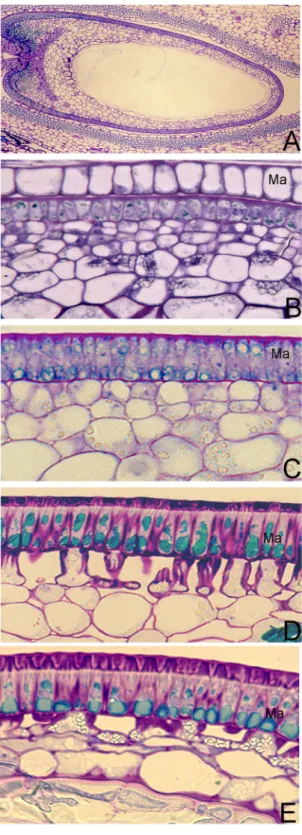
In previous studies, we characterized cellular structures and devel-opmental processes for the pods and seeds of M. truncatula. Also, we investigated and described the development of MC in M. truncatula10, and found polyphenolic phytochemical accumulation (e.g., flavonoids) in MC duringseed developing stages of M. truncatula are changed spatially and timely. In this study, to determine the distribu-tion of polyphenolic compounds in seeds of M. truncatula, we performed a histochemical analysis of the seeds during six developmental stages (3 DPP, 6 DPP, 13 DPP, 20 DPP, 27 DPP, and 39 DPP) using Toluidine Blue O at pH 4.4 (Fig. 1) with wheat seeds at 24 DPP as positive control. Polyphenolic compounds were stained with Toluidine Blue O showing blue-green color. No polyphenolic compounds were detected on 3 DPP (Fig. 1A). Ployphenolic compounds were accumulated at 6 DPP when seed coat starts to form (Fig. 1B). The accumulation of polyphenolic compounds progress rapidly during seed development (Fig. 1C–H). In Fig. 1, we found that polyphenolic compounds were only accumulated in the seed coat of M. truncatula. Under 500x magnification, we found that the seed coat epidermis, which will develop into MC in the later developmental stages, is the major site of phenolic compound biosynthesis and accumulation (Fig. 2). Phenolic compounds were observed in small vacuoles (Fig. 2A) of epidermis cells from the seed coats of developing M. truncatula pods at 6 DPP. Starting at 13 DPP, vacuoles were found to enlarge significantly with darker staining color observed compared to 6 DPP. These changes further intensified with seed development until maturation. Due to the observed dependence of vacuole size and the amount of polyphenolic compounds during MC development, and the fact that phenolic compounds do not accumulate in other cells of the seed coat, we considered that the cellular processes, specifically the vacuole development in MC, should be crucial to the phenolic compound metabolism of M. truncatula seed.
Characterization of phytochemicals in MC.
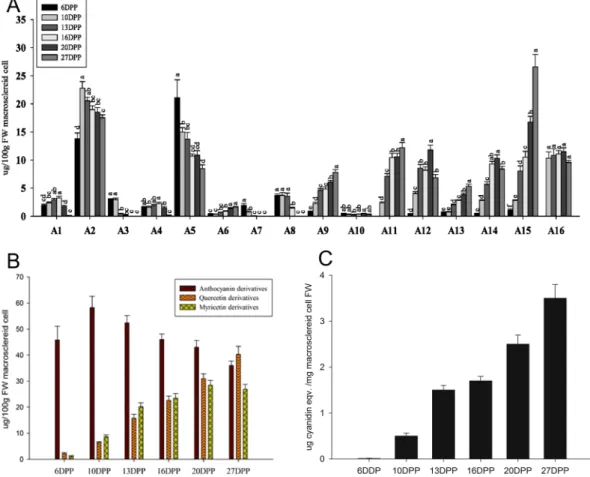
PA and polyphenolic compounds in M. truncatula MC samples collected at six time points of seed development were characterized using LC-MS (Fig. S1 and Table 1). We identified twenty peaks as flavonoid and flavonoid derivatives using LC-MS and UV spectrometry. According to the MS (n) fragment characteristics and the match of standard references based on our previous experiments30,10 DPP (Fig. 3C). The concentration of in-PAs increased during the development of MC. The concentration of anthocyanins decreased after 10 DPP.
www.nature.com/scientificreports/
# code RT [min]a Max m/z b UV d Namec 6 DPP 10 DPP 13 DPP 16 DPP 20 DPP 27 DPP
1 A1 11.4 321 232, 284 Leucodelphinidin 1.97 ± 0.21f 2.42 ± 0.15 2.96 ± 0.23 3.26 ± 0.31 1.74 ± 0.17 0.15 ± 0.02
2, 3 A2 20.8 467 237, 293 Leucodelphinidin-glucoside 13.76 ± 1.05 22.81 ± 1.17 20.56 ± 0.61 19 ± 0.63 18.54 ± 0.79 17.54 ± 0.51 4 A3 23.3 305 225, 323 Leucodelphinidin 2.93 ± 0.17 2.97 ± 0.28 0.47 ± 0.08 0.12 ± 0.01 NDf ND
5 A4 25.4 387 229, 288 Chalocone glucoside 1.66 ± 0.06 1.54 ± 0.22 1.85 ± 0.24 2.23 ± 0.28 1.5 ± 0.23 0.2 ± 0.03 6 A5 27.5 451 275 Epicatechin 3-O-glucoside 21.12 ± 3.17 15.00 ± 0.77 13.73 ± 1.18 10.7 ± 0.37 10.85 ± 0.82 8.47 ± 0.69 7 A6 29.6 449 230, 291 Luteolin 3-O-glucoside 0.36 ± 0.08 0.37 ± 0.05 0.69 ± 0.05 0.86 ± 0.09 1.37 ± 0.16 1.6 ± 0.13 8 A7 30.6 289 279 Epicatechin 1.89 ± 0.36 0.75 ± 0.17 0.09 ± 0.02 ND ND ND 9 A8 32.7 289 279 Catechin 3.72 ± 0.22 3.73 ± 0.48 3.55 ± 0.55 1.45 ± 0.15 ND ND 10 A9 34.6 625 260, 350 Myricetin 3-O-rutinoside 0.76 ± 0.13 2.25 ± 0.22 4.6 ± 0.32 4.86 ± 0.36 6.06 ± 0.36 7.8 ± 0.49 11 A10 35 739 235, 277 Cindonain-(alfa-4beta-8)-catechin 0.42 ± 0.1 0.32 ± 0.08 0.25 ± 0.06 0.36 ± 0.04 0.47 ± 0.05 0.3 ± 0.08 12 A11 35.5 479 259, 357 Myricetin 3-O-galactoside ND 2.37 ± 0.18 7.08 ± 0.49 10.45 ± 0.77 10.57 ± 0.62 12.21 ± 0.9 13, 14 A12 36.6 521 258, 357 Myricetin 3-O-galactoside-malatone 0.31 ± 0.15 4.05 ± 0.31 8.55 ± 0.65 8.2 ± 0.6 11.8 ± 0.84 6.85 ± 0.57 15 A13 36.9 610 258, 356 Rutin 0.66 ± 0.1 0.77 ± 0.07 2.06 ± 0.12 2.81 ± 0.15 3.87 ± 0.26 5.34 ± 0.36 16 A14 38.5 464 258, 354 Quercetin 3-O-Glucoside 0.42 ± 0.11 2.83 ± 0.12 5.68 ± 0.49 9.32 ± 0.45 10.33 ± 0.58 8.4 ± 0.47 17, 18 A15 39.9 505 258, 355 Quercetin 3-O-Glucoside-6″-acetone 1.12 ± 0.18 2.83 ± 0.13 8.04 ± 0.92 10.51 ± 1.04 16.73 ± 1.06 26.59 ± 2.2 19, 20 A16 41.3 467 252, 335 Epicatechin 3-O-glucuronidate ND 10.29 ± 1.13 10.82 ± 1.2 11.09 ± 0.6 11.47 ± 0.7 9.58 ± 0.36
Table 1. Peak assignment for the analysis of extracts from seed coats at different development stages. aMeasured
with a C18 Grace column and a corresponding gradient profile (see Materials and methods). bObtained with an
ion trap mass spectrometer. cIdentified after comparison with standards and references. dObtained with a UV
detector. eND, none detected; others were detected. fµg/100 g fresh weight MC.
www.nature.com/scientificreports/
Ontology (GO) classification of DEGs.
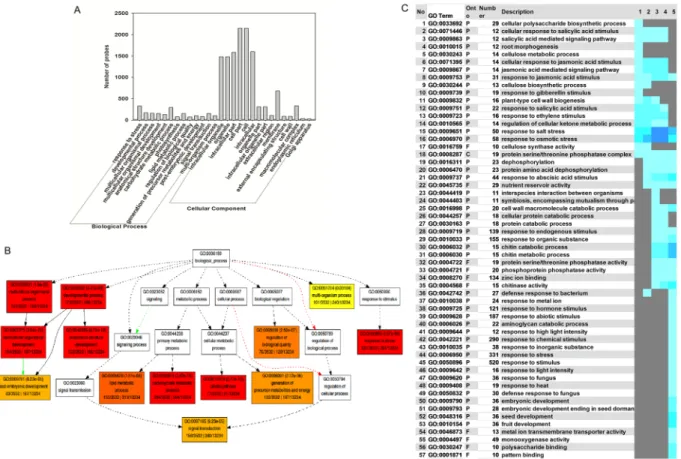
We next performed GO classification analysis based on signifi-cantly DEGs using SEA tool of agriGO39. 1994 and 2431 genes were assigned to two major categories (biologicalprocess and cellular component) respectively. GO terms of response to stress, developmental process, multicel-lular organismal process, multicelmulticel-lular organismal development, and anatomical structure development were predominant based on their p-values in the biological process category (Fig. 4A and B, Table S4). GO terms of intracellular organelle, organelle, intracellular part, cell part, and cell were identified as being the most abundant classes in the cellular component category (Fig. S3, Table S5). To cross-compare the gene expression levels at different time-points during MC development, the fold-change value (comparison with the corresponding value at 6 DPP) of these genes at other five time-points was used as input for PAGE (P < 0.05, FDR = 5%) (Fig. 4C, Table S6). Fifty-seven GO terms were down-regulated during MC development. Intriguingly, the genes that were down-regulated during the later developmental stages were mainly involved in the biotic or abiotic stress response, including 121 genes involved in the response to hormone stimulus, 187 genes involved in the response to abiotic stimulus, 290 genes involved in the response to chemical stimulus, 331 genes involved in the response to stress, and 520 genes involved in the response to stimulus (Table S6).
Recently, vesicle-mediated flavonoid transport was observed in a microscopy-based study. Anthocyanoplasts are thought to be transporter of anthocyanin or to serve as the sites of anthocyanin biosynthesis14, 46–49. In
addi-tion, anthocyanin-containing vesicle-like structures are co-localized with protein storage vacuoles (PSVs) and transport anthocyanins in a trans-Golgi network (TGN)-independent ER-to-PVC vesicle trafficking pathway50.
It was previously reported that prevacuole-like vesicle structures containing PAs can merge with the central vac-uole46. More recently, Arabidopsis mutants with reduced PA production (i.e., tt mutants) were found to exhibit
morphological defects in the central vacuole of the seed coat endothelium cells26, 36, 51–53. Furthermore, most of
the genes up-regulated in MC during later developmental stages were involved in compound transportation; specifically, 335, 360, 360, 360, and 360 genes were identified as being involved in the transport of the macromo-lecular complex, membrane-bounded vesicle, vesicle, cytoplasmic vesicle, and cytoplasmic membrane-bounded vesicle, respectively (Table S6). These results indicate the importance of vesicle-mediated flavonoid transport in M. truncatula MC.
MC are the first barrier of defense in
M. truncatula seeds.
A total of 815 genes were associated with abiotic and biotic stress, such as defense, disease resistance, signaling, protein degradation, and hypersensitive response. These defense-related genes were divided into several functional categories, including the cell wall (115), secondary metabolism (87), hormone metabolism (87), stress (108), redox (38), miscellaneous (52), RNA (60), protein (146), and signaling (172) (Table S7).Plant NBS-LRR proteins are receptors that directly or indirectly recognize pathogen-deployed proteins, and this specific reorganization triggers the plant defense response54, 55. We detected fourteen differentially expressed
NBS-LRR proteins (p < 0.05) during MC development, including those belonging to the TIR-NBS-LRR (7 genes), leucine-rich repeat family protein (3 genes), CC-NBS-LRR (2 genes), and like LRR protein (2 genes) classes.
In addition, sixty transcription factors (TFs, p < 0.05) associated with defense resistance were differen-tially expressed in MC, including those belonging to the MYB domain transcription factor family (20 genes), MYB-related transcription factor family (5 genes), AP2/EREBP family, APETALA2/ethylene-responsive element binding protein family (9 genes), WRKY domain transcription factor family (6 genes), bZIP transcription factor family (15 genes), and C2C2(Zn) DOF zinc finger family (5 genes). WRKY456, 57, WRKY2358, 59, WRKY3360–62,
and WRKY4063–65 are known to be involved in the pathogen response in plants. Several WRKY factors may be
involved in elicitor-triggered reprogramming of secondary metabolites in M. truncatula49. The overexpression of
four WRKY genes in Nicotiana tabacum (tobacco) demonstrated that the encoded proteins regulate lignin depo-sition, PR gene expression, and systemic defense responses against tobacco mosaic virus66. In this study, WRKY4,
WRKY23, WRKY33, WRKY40, and WRKY56 were identified as significantly induced during MC development. Finally, genes with other biological processes involved in the plant defense system including those related to the cell wall, secondary metabolism, hormone metabolism, protein, and signaling also exhibited differential expression during MC development (Table S7). Microarray analysis results indicate that genes accumulated with the highest expression during MC development, were defense-related proteins specifically related to the cell wall, secondary metabolism, hormone metabolism, stress, protein process, and defense response signaling. With the fact that MC form the outer cell layer of the seed coat, which covers the seed and protects the enclosed embryonic tissues, are the first line of defense in the M. truncatula seed.
TFs involved in flavonoid biosynthesis during MC development.
A total of 223 putative TFs were significantly differentially expressed at the six time-points examined in MC, including members of the AP2/ERF, bHLH, C2H2, HB, MADS, MYB, WRKY, and bZIP families. bHLH and MYB subfamily proteins were previously shown to be involved in the accumulation of anthocyanins and related phenylpropanoids7, 21–23, 67–70. Among thewww.nature.com/scientificreports/
MYB transcription factors, basic helix-loop-helix (bHLH) transcription factors, and tryptophan–aspartic acid repeat (WDR) proteins regulate the expression of genes involved in flavonoid biosynthesis71, 72. The Arabidopsis
genome contains 133 R2R3-MYB genes73, whereas M. truncatula has 91 (IMGAG database). MYB11/PFG2, MYB12/PFG1, and MYB111/PFG3 were reported to regulate flavonol biosynthesis in Arabidopsis74, 75. In addition,
several MYB transcription factors were identified as repressors of the flavonoid pathway, specifically of anthocya-nin biosynthesis, including FaMYB1 from strawberry (Fragaria ×ananasa)76, AtMYBL2, AtMYB4, and AtMYB60
from Arabidopsis77–79, and AmMYB308 from Antirrhinum80.
Furthermore, plant bHLH transcription factors are important regulators of flavonoid biosynthesis. AtTT8, an important bHLH protein in Arabidopsis, was found to regulate both the anthocyanin and PA pathways81. In
addi-tion, a small number of WD40 proteins were identified as regulators of flavonoid biosynthesis, including petunia ANTHOCYANIN11 (AN11)82, Arabidopsis TRANSPARENT TESTA GLABRA 1 (TTG1)20, perilla PFWD (Perilla frutescens WD repeats)83, maize ZmPAC1 (PALE ALEURONE COLOR 1)84, M. trunculata MtWD40-17, and Vitis vinifera (grapevine) WDR1 and WDR285.
Most R2R3-MYB transcription factors that regulate flavonoid biosynthesis, including WDR proteins, depend on cofactors, and a small subgroup of bHLH proteins with a common motif in their N termini interact with a signature motif in the R3 repeat of the N-terminal R2R3 domain of MYB factors86. In Arabidopsis, the TT2/TT8/
TTG1 complex regulates PA accumulation in the seed coat87, 88.
ABC transporters are involved in MC development.
A total of 155 annotated transporter proteins showed differential expression during the development of MC tissues, including three p- and v-ATPases, 17 sugar transporters, 13 amino acid transporters, 15 peptide and oligopeptide transporters, 9 potassium transporters, 19 major intrinsic protein transporters (PIPs), and 23 ABC transporters (Fig. 6). All ABC transport proteins were grouped into three clusters by hierarchical cluster analysis with Euclidean distance (Fig. 6B). Five, eight, and ten ABC transport proteins were grouped into Cluster 1, Cluster 2, and Cluster 3, respectively. The expression level of Cluster 1 in the early developmental stages (6 DPP, 10 DPP, and 13 DPP) was higher than at other stages. By contrast, the expression level of proteins in Cluster 3, including PGP2, PDR13, MRP14, PED3, and PGP2, was up-regulated later in development.The ABC transporter family transports a range of substrates, including metal ions, auxin, malate, defensive secondary metabolites, and xenobiotics89, across membranes using the energy released from ATP hydrolysis90.
Over 120 putative ABC transporters have been identified in the Arabidopsis, rice (Oryza sativa), tomato (Solanum lycopersicum), and M. truncatula genomes; however, only a few of these have been characterized. MRP-type ABC transporters have been verified to be involved in flavonoid transport91, functioning in the long-distance
trans-port of flavonoids, such as naringenin, dihydrokaempferol, and dihydroquercetin, via unidirectional cell-to-cell movement between the root and shoot92. Some multidrug and toxic compound extrusion (MATE)-type
proanthocyanidin phenotype of the Arabidopsis tt12 mutant both quantitatively and qualitatively. On the basis of biochemical properties, tissue-specific expression pattern, and genetic loss-of-function analysis, MATE1 has been identified as an essential membrane transporter for proanthocyanidin biosynthesis in the Medicago seed coat. Subsequently, MATE2 has also been considered to act as a membrane transporter during proanthocyanidin biosynthesis in Medicago leaves9. In our study, a total of 155 annotated transporter proteins showed differential
expression during the development of MC tissues, including 23 ABC transporters. These results indicate that transporter proteins transport a variety of substrates, including flavonoids. Furthermore, they offer a clue as to how other flavonoids, such as quercetin and myricetin, are transported into the vacuole.
Characterization of metabolism during MC development.
Using the ‘Metabolism overview’ pathway in MapMan, we identified significant transcriptional changes in genes with putative functions in metabolism (Fig. S4). Genes related to primary and secondary metabolic processes, including minor and major carbohydrate metabolism; cell wall biosynthetic processes; energy-generating processes; amino acid, lipid, wax, terpene, and flavonoid biosynthetic processes; phenylpropanoid and phenolic processes; and nucleotide metabolism account for 10.53% of all transcriptional changes. Our results show that metabolism is one of the dominant biological pro-cesses in MC development. Further analysis of 4680 genes using the Kyoto Encyclopedia of Genes and Genomics (KEGG)93–96 showed that 1028 genes were assigned to 294 ECs with 103 biosynthesis pathways (Table S9). In thisstudy, we focused on the “biosynthesis of secondary metabolites” pathway in relation to flavonoid biosynthesis based on our HPLC-MS results and MC structure analysis. We identified 102 genes as being involved in flavo-noid biosynthesis, phenylpropaflavo-noid biosynthesis, and flavone and flavonol biosynthesis (Table S10), including ten genes representing genes encoding enzymes that were enriched in flavonoid biosynthesis (P < 0.001). We reconstructed the flavonoid biosynthesis pathway using the KEGG database. These results indicate that most of the enzymes in the flavonoid biosynthesis pathway could be identified among the DEGs in MC (Fig. S5). There were significantly differentially expressions of the genes encoding Flavonoid 3′,5′-hydroxylase (F3′5′H), Dihydroflavonol-4-reductase (DFR, TT3), Leucoanthocyanidin dioxygenase (LDOX), Flavonol synthase/ flavanone 3-hydroxylase (FLS), Leucoanthocyanidin reductase (LAR), Chalcone synthase, Caffeoyl-CoA O-methyltransferase (COMT), and 4-coumarate-CoA ligase (4CL) in MC development (Table S10).
Building the model system for regulatory network of flavonoid biosynthesis in MC.
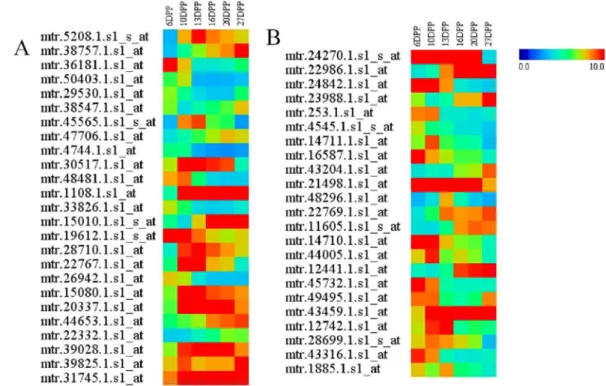
The 2110 genes identified based on functional category analysis using MapMan 3.0 was clustered by the k-means method with Euclidean distance. A total of 22 clusters were defined from these genes based on the figure of merit value (Fig. 7). These 22 clusters were divided into four groups. Probes in the first group, including Cluster 3, 8, 14, 15, 16, 18, and 19, were down-regulated throughout MC development. These clusters contained a total of 715 genes. The second group representing clusters of genes including Cluster 9 (88 genes), 20 (76 genes), and 22 (46 genes) were first up-regulated and then down-regulated during MC development. The third group, consisting of clusters of genes including Cluster 10 (62 genes), 11 (93 genes), and 13 (71 genes), were first down-regulated and then up-regulated during MC development. Clusters of genes in the fourth group (883 genes, split up between clusters 1, 2, 4, 5, 6, 7, 12, 17, and 21) were up-regulated during MC development. We analyzed the relationship Figure 7. Clustering of the expression profiles of 2110 differentially expressed probes at six different time-points during M. truncatula MC development. Clustering was performed using k-means statistics and 22 clusters were chosen for further analysis of transcriptional patterns. The number of genes in each cluster is listed in parentheses. The X-axis indicates the number of days post pollination (DPP). The Y-axis indicates the LOG2www.nature.com/scientificreports/
between gene expression level and flavonoid accumulation during MC development by constructing a weighted gene co-regulatory network (WGCNA) (Fig. 8). Four flavonoids, i.e., A3 (leucodelphinidin), A5 (epicatechin 3-O-glucoside), A7 (epicatechin), and A8 (catechin), were significantly positively associated with six clusters (Group A: CP8, 14, 15, 16, 18, and 19, total of 603 genes) and negatively related to 12 other clusters (Group B: CP1, 2, 4, 5, 6, 7, 11, 12, 17, 20, 21, and 22, total of 1177 genes). Eight flavonoids, i.e., A6 (luteolin 3-O-glucoside), A12 (myricetin 3-O-galactoside-malatone), A13 (rutin), A15 (quercetin 3-O-Glucoside-6″-acetone), A9 (myricetin Figure 8. Correlation analysis between K-means clusters and concentration of identified flavonoids during M. trunctula MC development. Correlation between modules and flavonoid concentration is presented by colors ranging from red (highly positive correlation) to green (highly negative correlation). Columns represent the flavonoid concentration during development of MC and rows represent the modules. The correlation coefficient and p-value are shown in each cell. CP indicates the cluster number.
3-O-rutinoside), A16 (epicatechin 3-O-glucuronidate), A14 (quercetin 3-O-Glucoside), and A11 (myricetin 3-O-galactoside), were positively related to 12 clusters (Group B: CP1, 2, 4, 5, 6, 7, 11, 12, 17, 20, 21, and 22) and negatively related to 6 other clusters (Group A: CP8, 14, 15, 16, 18, and 19). A1 (leucodelphinidin), A2 Figure 10. The flavonoid pathway network in MC with a hard cut-off value of |r| = 0.85 using Cytoscape. Nodes indicate individual genes, and edges indicate two genes that are co-expressed, with a cut-off value of |r| = 0.85.
Figure 11. A model of potential flavonoid and isoflavonoid metabolic processes in M. truncatula. PAL, L-Phe ammonia-lyase; C4H, cinnamate 4-hydroxylase; 4CL, 4-coumarate:CoA ligase; CHS, chalcone synthase; CHI, chalcone isomerase; F3H, flavanone 3-hydroxylase; DFR, dihydroflavonol reductase; FS, flavone synthase; IFS, isoflavone synthase; HID, 2-hydroxyisoflavanone dehydratase; FLS, flavonol synthase; ANS, anthocyanidin synthase; ANR, anthocyanidin reductase; GT, glycosyltransferase; MaT, malonyl CoA:flavonoid acyltransferase; MATE, multidrug and toxin extrusion transporter; V-ATPase, vacuolar ATPase; GST, glutathione
www.nature.com/scientificreports/
(leucodelphinidin-glucoside), A4 (leucodelphinidin), and A10 (cindonain-(α-4β-8)-catechin) were not signifi-cantly related to any cluster. These results indicate that Flavan-3-ol and flavonol accumulated during MC devel-opment. Flavan-3-ol accumulated in the early developmental stages, whereas flavonol accumulated in the late developmental stages. Except for the genes in the functional category “development”, which were more abundant in Group A than in Group B, more genes in Group B were linked to functional categories than in Group A (Fig. 9). We identified 19 flavonoid pathway related genes, including 11 transporter protein genes and 13 transcrip-tion factor genes amongst the 2110 genes. To investigate the interactranscrip-tion between these genes, we constructed a network for MC based on a hard cut-off value of |r| = 0.85 using Cytoscape (Fig. 10). The network showed co-expression of transcription factors with transporter proteins and flavonoid biosynthesis genes. Furthermore, genes encoding transporter proteins were co-expressed with the flavonoid biosynthesis related genes. These results indicated that transcription factors and transporter proteins are involved in flavonoid biosynthesis in MC development. In addition, transporter proteins may transport flavonoids during MC development.
Based on the WGCNA network results, flavonoid biosynthesis can be divided into four stages in the MC of M. truncatula (Fig. 11). In the early stages of development of MC, various signals activate flavonoid biosynthe-sis. Only small amounts of flavonoids were detected at 6 DPP and genes related to flavonoid biosynthesis were expressed at lower levels at 6 DPP than at other stages. After 6 DPP, genes of the flavonoid biosynthesis path-way are activated, and large amounts of flavonoids are biosynthesized and modified in the cytoplasm of MC. Numerous novel flavonoids, isoflavonoids, and related biosynthetic genes have been identified and characterized via metabolomic and genomic analyses, including TT3, TT4, TT5, TT6, and TT7. In addition, several TFs that regulate flavonoid biosynthesis, such as TT147, TTG120, TT221, TTG222, and TT823 have been reported. In our gene
expression profiles, 223 genes encoding putative TFs exhibited significantly differentiated expression during MC development. This finding suggests that a large number of TFs are involved in the development of MC. However, all flavonoids produced need to be transported to and stored in the vacuole via various kinds of transporters.
TT1225, TT1926, MATE18, and MATE29 were previously reported to function as transporters of E3′G and
Cy3G. However, we identified large amounts of quercetin and myricetin derivatives in MC. Although it is unclear how quercetin and myricetin are transported into the vacuole, we found that 155 annotated transporter proteins, including three p- and v-ATPases and twenty-three ABC transporters, were differentially expressed during MC development. This finding indicates that other transporters may transport flavonoids in MC. Finally, all flavo-noids were polymerized and stored in the vacuole as procyanidin oligomers, anthocyanin complexes, or other polyphenols. Thus, our results show that M. truncatula MC are an excellent model system in which to study flavonoid biosynthesis.
References
1. Cook, D. R. Medicago truncatula–a model in the making! Curr Opin Plant Biol 2, 301–304, doi:10.1016/S1369-5266(99)80053-3
(1999).
2. Cook, D. R., VandenBosch, K., de Bruijn, F. J. & Huguet, T. Model Legumes Get the Nod. The Plant Cell Online 9, 275–280, doi:10.1105/tpc.9.3.275 (1997).
3. Laporte, P., Merchan, F., Amor, B. B., Wirth, S. & Crespi, M. Riboregulators in plant development. Biochem Soc Trans 35, 1638–1642, doi:10.1042/BST0351638 (2007).
4. Lei, Z. et al. Comparative proteomics of yeast-elicited Medicago truncatula cell suspensions reveals induction of isoflavonoid biosynthesis and cell wall modifications. J Proteome Res 9, 6220–6231, doi:10.1021/pr100439k (2010).
5. Wang, H. et al. Mutation of WRKY transcription factors initiates pith secondary wall formation and increases stem biomass in dicotyledonous plants. Proc Natl Acad Sci USA 107, 22338–22343, doi:10.1073/pnas.1016436107 (2010).
6. Verdier, J. et al. A regulatory network-based approach dissects late maturation processes related to the acquisition of desiccation tolerance and longevity of Medicago truncatula seeds. Plant Physiol 163, 757–774, doi:10.1104/pp.113.222380 (2013).
7. Pang, Y. et al. A WD40 Repeat Protein from Medicago truncatula Is Necessary for Tissue-Specific Anthocyanin and Proanthocyanidin Biosynthesis But Not for Trichome Development. Plant Physiology 151, 1114–1129, doi:10.1104/pp.109.144022
(2009).
8. Zhao, J. & Dixon, R. A. MATE Transporters Facilitate Vacuolar Uptake of Epicatechin 3′-O-Glucoside for Proanthocyanidin Biosynthesis in Medicago truncatula and Arabidopsis. The Plant Cell Online 21, 2323–2340, doi:10.1105/tpc.109.067819 (2009). 9. Zhao, J. et al. MATE2 mediates vacuolar sequestration of flavonoid glycosides and glycoside malonates in Medicago truncatula.
Plant Cell 23, 1536–1555, doi:10.1105/tpc.110.080804 (2011).
10. Wang, H. L. & Grusak, M. A. Structure and Development of Medicago truncatula Pod Wall and Seed Coat. Annals of Botany 95, 737–747, doi:10.1093/aob/mci080 (2005).
11. Beeckman, T. & Viane, R. Embedding thin plant specimens for oriented sectioning. Biotech Histochem 75, 23–26, doi:10.3109/10520290009047981 (2000).
12. Western, T. L. et al. MUCILAGE-MODIFIED4 encodes a putative pectin biosynthetic enzyme developmentally regulated by APETALA2, TRANSPARENT TESTA GLABRA1, and GLABRA2 in the Arabidopsis seed coat. Plant Physiology 134, 296–306, doi:10.1104/pp.103.035519 (2004).
13. Pang, Y., Peel, G. J., Sharma, S. B., Tang, Y. & Dixon, R. A. A transcript profiling approach reveals an epicatechin-specific glucosyltransferase expressed in the seed coat of Medicago truncatula. Proc Natl Acad Sci USA 105, 14210–14215, doi:10.1073/ pnas.0805954105 (2008).
14. Zhao, J. & Dixon, R. A. The ‘ins’ and ‘outs’ of flavonoid transport. Trends Plant Sci 15, 72–80, doi:10.1016/j.tplants.2009.11.006
(2010).
15. Smykal, P., Vernoud, V., Blair, M. W., Soukup, A. & Thompson, R. D. The role of the testa during development and in establishment of dormancy of the legume seed. Front Plant Sci 5, 351, doi:10.3389/fpls.2014.00351 (2014).
16. Lepiniec, L. et al. Genetics and biochemistry of seed flavonoids. Annu Rev Plant Biol 57, 405–430, doi:10.1146/annurev. arplant.57.032905.105252 (2006).
17. Arsovski, A. A., Haughn, G. W. & Western, T. L. Seed coat mucilage cells of Arabidopsis thaliana as a model for plant cell wall research. Plant Signal Behav 5, 796–801, doi:10.4161/psb.5.7.11773 (2010).
18. Belmonte, M. F. et al. Comprehensive developmental profiles of gene activity in regions and subregions of the Arabidopsis seed. Proc Natl Acad Sci USA 110, E435–444, doi:10.1073/pnas.1222061110 (2013).
20. Walker, A. R. et al. The TRANSPARENT TESTA GLABRA1 locus, which regulates trichome differentiation and anthocyanin biosynthesis in Arabidopsis, encodes a WD40 repeat protein. Plant Cell 11, 1337–1350, doi:10.1105/tpc.11.7.1337 (1999). 21. Nesi, N., Jond, C., Debeaujon, I., Caboche, M. & Lepiniec, L. The Arabidopsis TT2 gene encodes an R2R3 MYB domain protein that
acts as a key determinant for proanthocyanidin accumulation in developing seed. Plant Cell 13, 2099–2114 (2001).
22. Johnson, C. S., Kolevski, B. & Smyth, D. R. TRANSPARENT TESTA GLABRA2, a trichome and seed coat development gene of Arabidopsis, encodes a WRKY transcription factor. Plant Cell 14, 1359–1375, doi:10.1105/tpc.001404 (2002).
23. Nesi, N. et al. The TT8 gene encodes a basic helix-loop-helix domain protein required for expression of DFR and BAN genes in Arabidopsis siliques. Plant Cell 12, 1863–1878, doi:10.1105/tpc.12.10.1863 (2000).
24. Tanaka, A. et al. A new Arabidopsis mutant induced by ion beams affects flavonoid synthesis with spotted pigmentation in testa.
Genes Genet Syst 72, 141–148, doi:10.1266/ggs.72.141 (1997).
25. Debeaujon, I., Peeters, A. J., Leon-Kloosterziel, K. M. & Koornneef, M. The TRANSPARENT TESTA12 gene of Arabidopsis encodes a multidrug secondary transporter-like protein required for flavonoid sequestration in vacuoles of the seed coat endothelium. Plant Cell 13, 853–871, doi:10.1105/tpc.13.4.853 (2001).
26. Kitamura, S., Shikazono, N. & Tanaka, A. TRANSPARENT TESTA 19 is involved in the accumulation of both anthocyanins and proanthocyanidins in Arabidopsis. Plant J 37, 104–114, doi:10.1046/j.1365-313X.2003.01943.x (2004).
27. Le, B. H. et al. Global analysis of gene activity during Arabidopsis seed development and identification of seed-specific transcription factors. Proc Natl Acad Sci USA 107, 8063–8070, doi:10.1073/pnas.1003530107 (2010).
28. Dean, G. et al. Analysis of gene expression patterns during seed coat development in Arabidopsis. Mol Plant 4, 1074–1091, doi:10.1093/mp/ssr040 (2011).
29. Gallardo, K. et al. A combined proteome and transcriptome analysis of developing Medicago truncatula seeds: evidence for metabolic specialization of maternal and filial tissues. Mol Cell Proteomics 6, 2165–2179, doi:10.1074/mcp.M700171-MCP200
(2007).
30. Fu, F. & Wang, H. L. Metabolomics reveals consistency of the shoot system in Medicago truncatula by HPLC-UV-ESI-MS/MS.
International Journal of Food Science & Technology 50, 2183–2192, doi:10.1111/ijfs.12857 (2015).
31. Liang, M., Davis, E., Gardner, D., Cai, X. & Wu, Y. Involvement of AtLAC15 in lignin synthesis in seeds and in root elongation of Arabidopsis. Planta 224, 1185–1196, doi:10.1007/s00425-006-0300-6 (2006).
32. Pfaffl, M. W. A new mathematical model for relative quantification in real-time RT-PCR. Nucleic Acids Res 29, e45–45, doi:10.1093/ nar/29.9.e45 (2001).
33. Tesfaye, M., Silverstein, K. A. T., Bucciarelli, B., Samac, D. A. & Vance, C. P. The Affymetrix Medicago GeneChip array is applicable for transcript analysis of alfalfa (Medicago sativa). Functional Plant Biology 33, 783–788, doi:10.1071/FP06065 (2006).
34. Huber, W. et al. Orchestrating high-throughput genomic analysis with Bioconductor. Nat Meth 12, 115–121, doi:10.1038/ nmeth.3252 (2015).
35. Irizarry, R. A. et al. Exploration, normalization, and summaries of high density oligonucleotide array probe level data. Biostatistics
4, 249–264, doi:10.1093/biostatistics/4.2.249 (2003).
36. Ritchie, M. E. et al. limma powers differential expression analyses for RNA-sequencing and microarray studies. Nucleic Acids Res 43, e47–e47, doi:10.1093/nar/gkv007 (2015).
37. Tang, H. et al. An improved genome release (version Mt4.0) for the model legume Medicago truncatula. BMC Genomics 15, 312, doi:10.1186/1471-2164-15-312 (2014).
38. Camacho, C. et al. BLAST+: architecture and applications. BMC Bioinformatics 10, 421, doi:10.1186/1471-2105-10-421 (2009). 39. Du, Z., Zhou, X., Ling, Y., Zhang, Z. & Su, Z. agriGO: a GO analysis toolkit for the agricultural community. Nucleic Acids Res 38,
W64–70, doi:10.1093/nar/gkq310 (2010).
40. Goffard, N. & Weiller, G. Extending MapMan: application to legume genome arrays. Bioinformatics 22, 2958–2959, doi:10.1093/ bioinformatics/btl517 (2006).
41. Usadel, B. et al. A guide to using MapMan to visualize and compare Omics data in plants: a case study in the crop species, Maize.
Plant Cell Environ 32, 1211–1229, doi:10.1111/j.1365-3040.2009.01978.x (2009).
42. Langfelder, P. & Horvath, S. WGCNA: an R package for weighted correlation network analysis. BMC Bioinformatics 9, 559, doi:10.1186/1471-2105-9-559 (2008).
43. Ravasz, E., Somera, A. L., Mongru, D. A., Oltvai, Z. N. & Barabasi, A. L. Hierarchical organization of modularity in metabolic networks. Science 297, 1551–1555, doi:10.1126/science.1073374 (2002).
44. Baraba’si, A. L. & Oltvai, Z. N. Network biology: understanding the cell’s functional organization. Nat Rev Genet 5, 101–113, doi:10.1038/nrg1272 (2004).
45. Shannon, P. et al. Cytoscape: a software environment for integrated models of biomolecular interaction networks. Genome Res 13, 2498–2504, doi:10.1101/gr.1239303 (2003).
46. Abrahams, S., Tanner, G. J., Larkin, P. J. & Ashton, A. R. Identification and Biochemical Characterization of Mutants in the Proanthocyanidin Pathway in Arabidopsis. Plant Physiology 130, 561–576, doi:10.1104/pp.006189 (2002).
47. Sagasser, M., Lu, G. H., Hahlbrock, K. & Weisshaar, B. A. thaliana TRANSPARENT TESTA 1 is involved in seed coat development and defines the WIP subfamily of plant zinc finger proteins. Genes & development 16, 138–149, doi:10.1101/gad.212702 (2002). 48. Braidot, E. et al. Transport and accumulation of flavonoids in grapevine (Vitis vinifera L.). Plant Signal Behav 3, 626–632,
doi:10.4161/psb.3.9.6686 (2008).
49. Song, H. & Nan, Z. Genome-wide identification and analysis of WRKY transcription factors in Medicago truncatula. Yi chuan =
Hereditas/Zhongguo yi chuan xue hui bian ji 36, 152–168, doi:10.3724/SP.J.1005.2014.00152 (2014).
50. Poustka, F. et al. A Trafficking Pathway for Anthocyanins Overlaps with the Endoplasmic Reticulum-to-Vacuole Protein-Sorting Route in Arabidopsis and Contributes to the Formation of Vacuolar Inclusions. Plant Physiology 145, 1323–1335, doi:10.1104/ pp.107.105064 (2007).
51. Abrahams, S. et al. The Arabidopsis TDS4 gene encodes leucoanthocyanidin dioxygenase (LDOX) and is essential for proanthocyanidin synthesis and vacuole development. The Plant Journal 35, 624–636, doi:10.1046/j.1365-313X.2003.01834.x
(2003).
52. Baxter, I. R. et al. A plasma membrane H+-ATPase is required for the formation of proanthocyanidins in the seed coat endothelium of Arabidopsis thaliana. Proc Natl Acad Sci USA 102, 2649–2654, doi:10.1073/pnas.0406377102 (2005).
53. Verweij, W. et al. An H+ P-ATPase on the tonoplast determines vacuolar pH and flower colour. Nature cell biology 10, 1456–1462, doi:10.1038/ncb1805 (2008).
54. DeYoung, B. J. & Innes, R. W. Plant NBS-LRR proteins in pathogen sensing and host defense. Nat Immunol 7, 1243–1249, doi:10.1038/ni1410 (2006).
55. McHale, L., Tan, X., Koehl, P. & Michelmore, R. W. Plant NBS-LRR proteins: adaptable guards. Genome Biol 7, 212, doi:10.1186/ gb-2006-7-4-212 (2006).
56. Cormack, R. S. et al. Leucine zipper-containing WRKY proteins widen the spectrum of immediate early elicitor-induced WRKY transcription factors in parsley. Biochim Biophys Acta 1576, 92–100, doi:10.1016/S0167-4781(02)00298-1 (2002).
57. Lai, Z., Vinod, K., Zheng, Z., Fan, B. & Chen, Z. Roles of Arabidopsis WRKY3 and WRKY4 transcription factors in plant responses to pathogens. BMC Plant Biol 8, 68, doi:10.1186/1471-2229-8-68 (2008).
www.nature.com/scientificreports/
59. Levee, V. et al. Expression profiling and functional analysis of Populus WRKY23 reveals a regulatory role in defense. New Phytol 184, 48–70, doi:10.1111/nph.2009.184.issue-1 (2009).
60. Zheng, Z., Qamar, S. A., Chen, Z. & Mengiste, T. Arabidopsis WRKY33 transcription factor is required for resistance to necrotrophic fungal pathogens. Plant J 48, 592–605, doi:10.1111/tpj.2006.48.issue-4 (2006).
61. Lippok, B. et al. Expression of AtWRKY33 encoding a pathogen- or PAMP-responsive WRKY transcription factor is regulated by a composite DNA motif containing W box elements. Mol Plant Microbe Interact 20, 420–429, doi:10.1094/MPMI-20-4-0420 (2007). 62. Birkenbihl, R. P., Diezel, C. & Somssich, I. E. Arabidopsis WRKY33 is a key transcriptional regulator of hormonal and metabolic
responses toward Botrytis cinerea infection. Plant Physiology 159, 266–285, doi:10.1104/pp.111.192641 (2012).
63. Xu, X., Chen, C., Fan, B. & Chen, Z. Physical and functional interactions between pathogen-induced Arabidopsis WRKY18, WRKY40, and WRKY60 transcription factors. Plant Cell 18, 1310–1326, doi:10.1105/tpc.105.037523 (2006).
64. Chen, H. et al. Roles of arabidopsis WRKY18, WRKY40 and WRKY60 transcription factors in plant responses to abscisic acid and abiotic stress. BMC Plant Biol 10, 281, doi:10.1186/1471-2229-10-281 (2010).
65. Pandey, S. P., Roccaro, M., Schon, M., Logemann, E. & Somssich, I. E. Transcriptional reprogramming regulated by WRKY18 and WRKY40 facilitates powdery mildew infection of Arabidopsis. Plant J 64, 912–923, doi:10.1111/tpj.2010.64.issue-6 (2010). 66. Naoumkina, M. A., He, X. & Dixon, R. A. Elicitor-induced transcription factors for metabolic reprogramming of secondary
metabolism in Medicago truncatula. BMC Plant Biol 8, 132, doi:10.1186/1471-2229-8-132 (2008).
67. Xie, D. Y., Sharma, S. B., Wright, E., Wang, Z. Y. & Dixon, R. A. Metabolic engineering of proanthocyanidins through co-expression of anthocyanidin reductase and the PAP1 MYB transcription factor. Plant J 45, 895–907, doi:10.1111/tpj.2006.45.issue-6 (2006). 68. Peel, G. J., Pang, Y., Modolo, L. V. & Dixon, R. A. The LAP1 MYB transcription factor orchestrates anthocyanidin biosynthesis and
glycosylation in Medicago. Plant J 59, 136–149, doi:10.1111/tpj.2009.59.issue-1 (2009).
69. Hancock, K. R. et al. Expression of the R2R3-MYB transcription factor TaMYB14 from Trifolium arvense activates proanthocyanidin biosynthesis in the legumes Trifolium repens and Medicago sativa. Plant physiology 159, 1204–1220, doi:10.1104/pp.112.195420
(2012).
70. Verdier, J. et al. MtPAR MYB transcription factor acts as an on switch for proanthocyanidin biosynthesis in Medicago truncatula.
Proc Natl Acad Sci USA 109, 1766–1771, doi:10.1073/pnas.1120916109 (2012).
71. Broun, P. Transcriptional control of flavonoid biosynthesis: a complex network of conserved regulators involved in multiple aspects of differentiation in Arabidopsis. Curr Opin Plant Biol 8, 272–279, doi:10.1016/j.pbi.2005.03.006 (2005).
72. Koes, R., Verweij, W. & Quattrocchio, F. Flavonoids: a colorful model for the regulation and evolution of biochemical pathways.
Trends Plant Sci 10, 236–242, doi:10.1016/j.tplants.2005.03.002 (2005).
73. Dubos, C. et al. MYB transcription factors in Arabidopsis. Trends Plant Sci 15, 573–581, doi:10.1016/j.tplants.2010.06.005 (2010). 74. Mehrtens, F., Kranz, H., Bednarek, P. & Weisshaar, B. The Arabidopsis Transcription Factor MYB12 Is a Flavonol-Specific Regulator
of Phenylpropanoid Biosynthesis. Plant Physiology 138, 1083–1096, doi:10.1104/pp.104.058032 (2005).
75. Stracke, R. et al. Differential regulation of closely related R2R3-MYB transcription factors controls flavonol accumulation in different parts of the Arabidopsis thaliana seedling. The Plant Journal 50, 660–677, doi:10.1111/j.1365-313X.2007.03078.x (2007). 76. Aharoni, A. et al. The strawberry FaMYB1 transcription factor suppresses anthocyanin and flavonol accumulation in transgenic
tobacco. The Plant Journal 28, 319–332, doi:10.1046/j.1365-313X.2001.01154.x (2001).
77. Jin, H. et al. Transcriptional repression by AtMYB4 controls production of UV‐protecting sunscreens in Arabidopsis. The EMBO Journal 19, 6150–6161, doi:10.1093/emboj/19.22.6150 (2000).
78. Dubos, C. et al. MYBL2 is a new regulator of flavonoid biosynthesis in Arabidopsis thaliana. The Plant Journal 55, 940–953, doi:10.1111/j.1365-313X.2008.03564.x (2008).
79. Park, J.-S. et al. Arabidopsis R2R3-MYB transcription factor AtMYB60 functions as a transcriptional repressor of anthocyanin biosynthesis in lettuce (Lactuca sativa). Plant Cell Rep 27, 985–994, doi:10.1007/s00299-008-0521-1 (2008).
80. Tamagnone, L. et al. The AmMYB308 and AmMYB330 transcription factors from antirrhinum regulate phenylpropanoid and lignin biosynthesis in transgenic tobacco. Plant Cell 10, 135–154, doi:10.1105/tpc.10.2.135 (1998).
81. Nesi, N. et al. The TT8 Gene Encodes a Basic Helix-Loop-Helix Domain Protein Required for Expression of DFR and BAN Genes in Arabidopsis Siliques. The Plant Cell Online 12, 1863–1878, doi:10.1105/tpc.12.10.1863 (2000).
82. de Vetten, N., Quattrocchio, F., Mol, J. & Koes, R. The an11 locus controlling flower pigmentation in petunia encodes a novel WD-repeat protein conserved in yeast, plants, and animals. Genes & development 11, 1422–1434 (1997).
83. Sompornpailin, K., Makita, Y., Yamazaki, M. & Saito, K. A WD-repeat-containing putative regulatory protein in anthocyanin biosynthesis in Perilla frutescens. Plant Mol Biol 50, 485–495, doi:10.1023/A:1019850921627 (2002).
84. Carey, C. C., Strahle, J. T., Selinger, D. A. & Chandler, V. L. Mutations in the pale aleurone color1 regulatory gene of the Zea mays anthocyanin pathway have distinct phenotypes relative to the functionally similar TRANSPARENT TESTA GLABRA1 gene in Arabidopsis thaliana. Plant Cell 16, 450–464, doi:10.1105/tpc.018796 (2004).
85. Matus, J. T. et al. Isolation of WDR and bHLH genes related to flavonoid synthesis in grapevine (Vitis vinifera L.). Plant Mol Biol 72, 607–620, doi:10.1007/s11103-010-9597-4 (2010).
86. Grotewold, E. et al. Identification of the residues in the Myb domain of maize C1 that specify the interaction with the bHLH cofactor R. Proc Natl Acad Sci USA 97, 13579–13584, doi:10.1073/pnas.250379897 (2000).
87. Debeaujon, I. et al. Proanthocyanidin-accumulating cells in Arabidopsis testa: regulation of differentiation and role in seed development. Plant Cell 15, 2514–2531, doi:10.1105/tpc.014043 (2003).
88. Baudry, A. et al. TT2, TT8, and TTG1 synergistically specify the expression of BANYULS and proanthocyanidin biosynthesis in Arabidopsis thaliana. Plant J 39, 366–380, doi:10.1111/j.1365-313X.2004.02138.x (2004).
89. Rea, P. A. Plant ATP-binding cassette transporters. Annu Rev Plant Biol 58, 347–375, doi:10.1146/annurev.arplant.57.032905.105406
(2007).
90. Sanchez-Fernandez, R., Davies, T. G., Coleman, J. O. & Rea, P. A. The Arabidopsis thaliana ABC protein superfamily, a complete inventory. The Journal of biological chemistry 276, 30231–30244, doi:10.1074/jbc.M103104200 (2001).
91. Goodman, C. D., Casati, P. & Walbot, V. A multidrug resistance-associated protein involved in anthocyanin transport in Zea mays.
Plant Cell 16, 1812–1826, doi:10.1105/tpc.022574 (2004).
92. Buer, C. S., Muday, G. K. & Djordjevic, M. A. Flavonoids are differentially taken up and transported long distances in Arabidopsis.
Plant Physiol 145, 478–490, doi:10.1104/pp.107.101824 (2007).
93. Kanehisa, M. et al. KEGG for linking genomes to life and the environment. Nucleic Acids Res 36, D480–484, doi:10.1093/nar/ gkm882 (2008).
94. Kanehisa, M., Furumichi, M., Tanabe, M., Sato, Y. & Morishima, K. KEGG: new perspectives on genomes, pathways, diseases and drugs. Nucleic Acids Res 45, D353–D361, doi:10.1093/nar/gkw1092 (2017).
95. Kanehisa, M. & Goto, S. KEGG: kyoto encyclopedia of genes and genomes. Nucleic Acids Res 28, 27–30, doi:10.1093/nar/28.1.27
(2000).
96. Kanehisa, M., Sato, Y., Kawashima, M., Furumichi, M. & Tanabe, M. KEGG as a reference resource for gene and protein annotation.
Acknowledgements
We thank Dr. Nian Wang for Microarray data analysis, and Dr. Stephen Grace (Biology Department, University of Arkansas at Little Rock) for allowing us the use of his laboratory equipment and training us in HPLC-MS analysis. This research was funded by the EPSCoR-NSF-P3 Center (Grant P3-131 for Hong Li Wang). The microarray data have been submitted to Gene Expression Omnibus under the access number GSE62329.
Author Contributions
F.Y.F. and H.L.W. designed the research and wrote the manuscript. F.Y.F. carried out the experiments, reagents and materials, and data analysis. W.T.Z. contributed network analysis. Y.Y.L. contributed flavonoid identification. All authors read and approved the final manuscript.
Additional Information
Supplementary information accompanies this paper at doi:10.1038/s41598-017-02827-5
Competing Interests: The authors declare that they have no competing interests.
Publisher's note: Springer Nature remains neutral with regard to jurisdictional claims in published maps and institutional affiliations.
Open Access This article is licensed under a Creative Commons Attribution 4.0 International License, which permits use, sharing, adaptation, distribution and reproduction in any medium or format, as long as you give appropriate credit to the original author(s) and the source, provide a link to the Cre-ative Commons license, and indicate if changes were made. The images or other third party material in this article are included in the article’s Creative Commons license, unless indicated otherwise in a credit line to the material. If material is not included in the article’s Creative Commons license and your intended use is not per-mitted by statutory regulation or exceeds the perper-mitted use, you will need to obtain permission directly from the copyright holder. To view a copy of this license, visit http://creativecommons.org/licenses/by/4.0/.