THE IMPACT OF IMPERFECT INFORMATION ON THE HEALTH INSURANCE CHOICE, HEALTH OUTCOMES AND MEDICAL EXPENDITURES OF THE ELDERLY
Pragya Singh
A dissertation submitted to the faculty of the University of North Carolina at Chapel Hill in partial fulfillment of the requirements for the degree of Doctor of Philosophy in the Department
of Economics.
Chapel Hill 2016
c
2016
Pragya Singh
ABSTRACT
PRAGYA SINGH : The Impact of Imperfect Information on the Health Insurance Choice, Health Outcomes and Medical Expenditures of the Elderly
(Under the direction of Donna Gilleskie)
To my parents:
for the many sacrifices that they made in their unflinching commitment to provide me the best possible education,
for always pushing me to realize my potential,
and for instilling in me the determination and perseverance needed to get here
AND
ACKNOWLEDGEMENTS
First and foremost, I would like to express my deepest gratitude to my advisor, Donna Gilleskie, for her guidance and support through all the stages of this dissertation and the graduate program. Donna is an exceptional mentor- not only is she an expert economist committed to the highest standards in research, she is also a deeply compassionate human being who provides plentiful emotional support to her students. I could not have asked for a more helpful and understanding advisor.
Other members of my committee have also played indispensable roles in the completion of this dissertation. I thank Brian McManus for his sharp, insightful feedbacks and also for teaching one of the best courses of my graduate life. I thank Sally Stearns for looking out for potential institutional pitfalls in this research and for her editorial support. I would also like to thank Helen Tauchen for providing sound, pragmatic advice on numerous occasions, both in her capacity as my thesis committee member, and as the Director of Graduate Studies. Small acts of kindness on her part have gone a long way in making the timely completion of this research possible.
I thank Tiago Pires, the youngest member of my committee, (who is fast gaining a reputation for his superhuman capacity to help graduate students!) for being my sounding board. I have availed of Tiago’s assistance every step of the way- from the early stages of the research idea development to brainstorming about the model to presentation and job market advice, and I am forever indebted to him for graciously providing all this support. His infectious positivity and enthusiasm improved the quality of my graduate student life manyfold.
at UNC in the form of a Summer Research Fellowship (Summer 2014), and the University Disser-tation Completion Fellowship (2015-2016); and from Mathematica Policy Research (MPR), Inc. in the form of another Summer Research Fellowship (Summer, 2015). I am grateful to Dominick Esposito at MPR for his valuable feedback on the policy implications of this research. I would also like to thank David Mann and Lori Timmins at MPR for providing an excellent technical review of my job market paper which helped in improving the dissertation. I also received helpful comments and suggestions from seminar participants at the Applied Microeconomics Workshop at UNC and from Christopher Holden at the 2015 Southern Economic Association Meetings.
I am extremely grateful to all my family members. Thank you to my parents, to whom this thesis is dedicated; to my brother, Alok Singh, for his support and also for being my programming guru; to my ‘Mama’ (uncle), Arun Prakash Singh, for ensuring my safety and comfort as a first time graduate student in the US; to my beloved ‘Nani and Nana’ (grandparents) for their boundless affection, which was always heartening. This dissertation would not have been possible without the love, encouragement and support of my husband extraordinaire- Deepal Basak. I wish to thank him from the bottom of my heart. Like a true partner, he cheered me on when I was in my element, snapped me out of the low points, and stood by me through it all. He never failed to inspire me with his tremendous faith in my ideas and capabilities and his support has meant the world to me.
TABLE OF CONTENTS
LIST OF TABLES . . . x
LIST OF FIGURES . . . xi
1 Introduction . . . 1
2 Literature Review . . . 5
3 An Overview of the Medicare Program . . . 8
4 Model . . . 10
4.1 Theoretical Motivation . . . 10
4.2 Empirical Specification of Jointly Estimated Equations . . . 15
5 Estimation and Identification . . . 27
6 Data . . . 30
7 Results . . . 38
7.1 Parameter Estimates . . . 38
7.2 Simulation Results . . . 48
7.2.1 Simulation Details and Model Fit . . . 48
7.2.2 Dynamic Effects of Greater Information . . . 49
7.3 Relating the Findings to the Existing Literature . . . 51
7.4 Discussion of Equilibrium Effects . . . 52
8 Conclusion . . . 55
A.2 . . . 64
A.3 . . . 65
A.4 . . . 67
LIST OF TABLES
3.1 Insurance Plan Choices . . . 9
4.1 Summary of Equation Specifications . . . 26
5.1 Description of Exogenous Identifying Variables . . . 29
6.1 Empirical Distribution of Sample Participants . . . 31
6.2 One Year Information Transitions . . . 32
6.3 Description of Exogenous Individual Variables . . . 35
7.1 Parameter Estimates for Selected Variables Explaining Information . . . 41
7.2 Parameter Estimates for Selected Variables Explaining Insurance Selection . . . 42
7.3 Parameter Estimates for Selected Variables Explaining Preventive and Medical Care Use . . . 43
7.4 Parameter Estimates for Selected Variables Explaining Medical Care Expenditures 46 7.5 Parameter Estimates for Selected Variables Explaining Transitions in Functional Status . . . 47
7.6 Five Year Simulations of Insurance and Preventive Care Choices under Full and No Information . . . 50
7.7 Five Year Simulations of Medical Expenditures and Health Outcomes under Full and No Information . . . 51
7.8 Increasing Information Variables by One Standard Deviation, Each Period over Five Years: Insurance and Preventive Care Choice . . . 52
LIST OF FIGURES
4.1 Timing of Annual Decisions, Health Shocks and Health Production . . . 13
6.1 Actual and Simulated Number of Correct Responses, by Age . . . 33
6.2 Actual and Simulated Probability of Different Types of Insurance, by Age . . . 33
6.3 Actual and Simulated Medical Care Expenditures, by Age . . . 34
6.4 Out-of-Pocket Expenditures, by Insurance Choice . . . 36
6.5 Choice of Insurance Plan, by Information . . . 37
CHAPTER 1 INTRODUCTION
Frankie Huff is working on her doctoral degree in Florida and can tackle the most complicated education theories with ease. That’s not the case when it comes to picking a health insurance plan through her school. “It is daunting–at times more difficult to interpret than the scholarly research I pore through for my own dissertation,”she says.
This excerpt from CNN Health illustrates the challenge that millions of Americans face every open enrollment season−understanding their health insurance coverage options, comparing them on various dimensions, and making an optimal choice. Recent survey data (Handel and Kolstad, 2013) and empirical research (Bhargava et al., 2015; Lin and Wildenbeest, 2013) show that there are considerable information frictions in the market for health insurance; consumers often do not consider all the options available to them, fail to give attention to individualized plan characteris-tics, and consequently,do not select the best option.
These aspects of consumer behavior may be explained in terms of costs of acquiring informa-tion, where costs are defined very broadly and include pecuniary costs of acquiring information such as access to a personal computer or internet, time costs or cognitive costs of processing infor-mation. As a consequence of these information constraints, consumers frequently end up having incomplete and incorrect information about coverage options and plan features.1
Individuals with limited information on insurance alternatives and the characteristics of those
1Data from the 2009 Medicare Current Beneficiary Survey (used in this study) indicate alarmingly low levels of
alternatives may be making suboptimal plan choices, not getting the coverage that they need, get-ting it at higher costs, or potentially over insuring themselves. Since subsequent medical care utilization depends on the marginal effective prices2 of medical care induced by the chosen plan and medical care inputs improve, maintain or reduce deterioration of health, limited information indirectly affects health outcomes. For instance, use of preventive care services, (e.g., mammo-gram, prostate and cancer screenings) can lead to early detection of health conditions, thus slowing or reversing deterioration of untreated health in the future. Uncertainty about the coverage of these services3is likely to impact utilization of these services, thus affecting long term individual health. Grossman (1972) initiated the conceptualization of health as a capital good (i.e., it lasts, may depreciate, and can be augmented through investment). Thus, the effects of imperfect information today may have implications for future health outcomes; that is, limited information has dynamic (and long-run) consequences, rather than simply static (short-run) ones.
The level of information possessed by an individual is not randomly distributed. Many ob-served and unobob-served characteristics of the individual (e.g., education, health status, risk aversion) and her community (e.g., internet access, public libraries, information campaigns) determine how much information she seeks and how well that information is processed. Hence, there may be se-lection into obtaining more information. The causal impact of imperfect information on individual choices and outcomes cannot be measured without taking into account this potential endogeneity.
The broad objective of this research is to examine the dynamic causal impacts of limited infor-mation on the choices of insurance and medical care consumption, medical care expenditures and health outcomes of the elderly. To this end, the paper exploits some unique features of the Medi-care Current Beneficiary Survey (MCBS) conducted by the Centers for MediMedi-care and Medicaid Services (CMS) to identify the extent of information possessed by the beneficiaries. The MCBS is a longitudinal survey of Medicare beneficiaries that is linked to Medicare claims data and provides
2Marginal effective prices are determined by features such as deductible, coinsurance and out-of-pocket maximum
of the plan.
a complete picture of the utilization and expenditures of the beneficiaries as well as their health conditions and insurance choices each period. One component of the survey data files is the Ben-eficiary Needs and Knowledge Supplement, which is designed as a quiz testing the knowledge of beneficiaries on various aspects of coverage alternatives and the services covered under Medicare. In this research, the number of correct responses to these questions provided by the beneficiary is used as a measure of her information.
The impact of information is analyzed in the context of a dynamic decision making model in which agents make sequential decisions about information seeking, insurance selection, and preventive and curative medical care consumption. The theoretical framework of the model is used to derive specifications of the demand equations for individual choices and stochastic evolution of medical expenditures and health outcomes. These dynamic equations are estimated jointly along with the distributions of unobserved heterogeneity that allow for correlation across equations and over time using maximum likelihood estimation. Theoretically-relevant exogenous variables are used as exclusion restrictions for identification, which is also aided by the use of panel data and functional form restrictions in the estimation equations.
on insurance choices) has a positive significant impact on information, and policies that provide greater access to such resources are predicted to increase average information in the population.
Survey data on how consumers make insurance choices or how well informed they are while selecting insurance are not commonly available.4 As such, empirical research in information fric-tions in the health insurance market has generally focused on identifying friction hypotheses about consumer behavior from individual insurance choices and exogenous variations in choice environ-ment and examining the welfare effects of these information frictions on insurance costs or annual out-of-pocket expenditures, taking medical care consumption as exogenous.5 Thus, information has no effects on medical care consumption or health in these models. This research contributes to the existing literature on health insurance choice and medical care use in several distinct ways. To the best of my knowledge, this is the first study to 1) use survey data on information possessed by individuals while making choices and also model the potential endogeneity of this information in order to 2) examine the causal impact of imperfect information on insurance selection as well as subsequent medical care utilization and expenditures thus 3) allowing for dynamic effects of im-perfect information through its impact on health outcomes. An additional advantage of modeling the choice of medical care utilization is that I can identify effects of information on total medical expenditures distinctly from its impact on individual out-of-pocket expenditures.
The dissertation proceeds as follows: Chapter 2 provides a survey of the relevant literature. Chapter 3 gives a brief overview of the Medicare program. Theoretical motivation and the em-pirical framework are provided in Chapter 4. Chapter 5 discusses the estimation strategy and identification. The longitudinal data are described in Chapter 6. Discussion of results, parameter estimates and policy simulations follows in Chapter 7 and Chapter 8 summarizes the findings.
4Handel and Kolstad (2013) is the only other study using survey data that include information levels of participants. 5For example, Lin and Wildenbeest (2013) explore search costs, Handel (2013) explore switching costs, and Ho
CHAPTER 2 LITERATURE REVIEW
Recent empirical studies have documented suboptimal insurance choices in the health insur-ance market in United States. Abaluck and Gruber (2011) use detailed Medicare Part D Pre-scription Drug Plan claims and plan choice data to show that choices of the majority of Medicare population are not consistent with optimization under full information. Instead, an alternative plan in the individual’s choice set frequently offers better risk protection at a lower cost. Such inef-ficient choices are not confined to the elderly. Bhargava et al. (2015) examine health insurance decisions of employees at a large U.S. firm and find that a significant fraction of employees choose financially dominated options, resulting in excess spending. They conclude that these choices re-flect a severe deficit in health insurance literacy. Handel and Kolstad (2013) collect survey data from employees at a large firm testing their knowledge of the available insurance options and find considerable gaps in consumers’ knowledge.1 These information gaps matter for the insurance choices observed in their data.
Several sources of information frictions that could lead to inefficient plan choices have been identified in the literature. One explanation focuses on the presence of ‘search costs’, i.e., con-sumers have to pay a fixed cost2 each time they examine another insurance plan and hence they end up considering only a subset of the alternatives. Lin and Wildenbeest (2013) find evidence for substantial search costs in the market for Medigap (supplemental) insurance policies. Another consumer behavior that has been explored is ‘inertia’ or ‘switching costs’. Strombom et al. (2002) find that price sensitivity in health plans is negatively correlated with age, job tenure and health risk
1The Beneficiary Needs and Knowledge Supplement component of the MCBS used in the paper has a similar
variables that they interpret to be proxies for switching costs. Handel (2013) uses proprietary data on health plan choices and medical utilization of employees and finds large estimates of switching costs. Reducing these costs is beneficial for consumer welfare in a partial equilibrium framework, but the same policy exacerbates adverse selection and reduces consumer welfare when insurer pric-ing strategies are taken into account. Nosal (2012) uses the three level nested fixed point estimation routine of Gowrisankaran and Rysman (2009) to estimate switching costs for Medicare Advantage (MA) Plans with market share data and finds that the percentage of consumers opting for Medicare Advantage over FFS Medicare would more than triple in the absence of switching costs. Consumer inattention is also posited as an explanation for inefficient choices in the literature. Ho et al. (2015) estimate a model of consumer choice with inattentive consumers and explore the implications of inattention for insurer pricing. In their model, consumers actively find information about their in-surance choice set only when they are hit by a sufficiently large shock to their plan costs or health in the last period. Their results show considerable consumer savings through reduced premiums when inattention is removed.
In these studies of information frictions, medical care utilization is commonly assumed to be exogenous, i.e., demand for medical care does not change with insurance. However, the choice of health insurance affects the subsequent medical care utilization through its impact on the effective prices of medical care, and both these decisions are affected by correlated unobserved factors. Since medical care is an investment in the production of health, insurance choice also indirectly affects health outcomes.
sickest had better outcomes with a free plan. A more recent experimental study is the 2008 Ore-gon HIE , which expanded the state’s Medicaid program to 10,000 additional low income adults using a lottery (Finkelstein et al., 2011). The study finds an increase in medical care utilization and reduction in financial strain due to the expansion but no significant effects on health within a one year follow-up period. There are also many quasi-experimental studies that use potentially exoge-nous shifts in insurance policy to control for insurance selection. For example, Currie and Gruber (1996) and Dafny and Gruber (2005) use an expansion of Medicaid and Kolstad and Kowalski (2012) use the Massachusetts market reforms. Due to the investment good nature of health, effects of insurance selection are dynamic. A few studies examine this dynamic, long-term impact of insurance on individual health outcomes using longitudinal data. Yang et al. (2009) model Medi-care beneficiaries’ decisions to get supplemental insurance coverage for prescription drugs (prior to the introduction of Prescription Drug Coverage through Medicare Part D in 2006) in a frame-work where health evolves according to a production function (Grossman, 1972). They find that prescription drug coverage increases expenditures on drugs and reduces mortality rates, but the survivors have poorer health and higher total medical expenditures.
CHAPTER 3
AN OVERVIEW OF THE MEDICARE PROGRAM
Medicare is a national social insurance program, administered by the U.S. federal government since 1966, that guarantees access to health insurance for Americans aged 65 and older who have worked and paid into the social security system. Younger people with disabilities as well as people with end stage renal disease are also eligible under varying criteria.
Medicare initially had two parts: Medicare Part A and Medicare Part B. Part A covers inpatient hospital stays and Part B helps pay for physician services not covered by Part A. Most Medicare beneficiaries do not pay a monthly Part A premium because they have had 40 or more 3 month quarters in which they paid Federal Insurance Contributions Act taxes; monthly premium payments are required for Part B. The Original Medicare was administered as a fee-for-service (FFS) program (with no restriction on hospital or doctor networks from participating Medicare providers) with a copayment rate (generally 20 per cent) and no cap on out-of-pocket expenditures. FFS Medicare beneficiaries can buy supplemental insurance, which helps with the out-of-pocket costs and other gaps in Parts A and B. This supplemental insurance may or may not cover prescription drugs.
MA services in some plans.
Medicare Part D came into effect in 2006. In order to receive this benefit, beneficiaries must enroll in a stand-alone Prescription Drug Plan (PDP) or a Medicare Advantage plan with prescrip-tion drug coverage (MA-PD). Prescripprescrip-tion Drug Plans are offered by private insurance companies (and subsidized by Medicare) who are free to choose which drugs they wish to cover and at what tier they cover it. These plans usually have a premium, deductible and a copayment rate. Enroll-ment in Part D is generally voluntary, however, some people who receive assistance under certain federal programs are required to enroll.
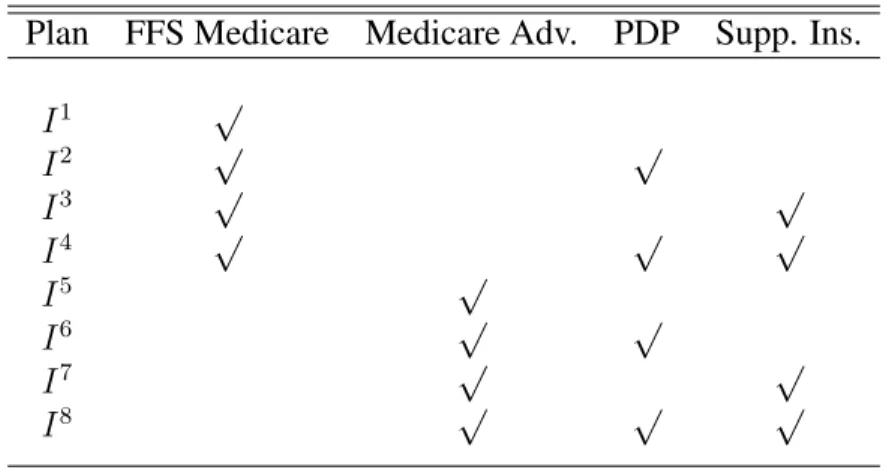
The insurance choice set (I) of an individual obtaining their coverage through Medicare con-sists of the eight possible combinations of FFS Medicare, Medicare Advantage, PDP and Supple-mental Insurance (I ≡[I1, I2, I3, I4, I5, I6, I7, I8]) as shown in Table 3.1.
Table 3.1: Insurance Plan Choices
Plan FFS Medicare Medicare Adv. PDP Supp. Ins.
I1 √
I2 √ √
I3 √ √
I4 √ √ √
I5 √
I6 √ √
I7 √ √
CHAPTER 4 MODEL
4.1 Theoretical Motivation
Grossman (1972) provides a theoretical framework for analyzing the demand for medical care that can be derived from the impact of medical care inputs on individuals’ health. Since insurance determines the effective marginal prices of medical care services, the indirect utility of insurance is derived from its effect on the demand for medical care and health. Information about insurance alternatives helps individuals make better (more efficient) insurance plan choices. I adapt the Grossman approach to analyze the forward looking insurance and medical care decisions of the elderly as well as their demand for information.
Individuals in the model derive utility from consumption (Ct) and health (Ht), where per-period utility isUt = U(Ct, Ht). Health is influenced by a stochastic ‘health shock’ (St) (e.g., develop-ment of a chronic condition) and by curative medical care inputs (Mt) (e.g., hospital services, physician services, prescription drugs) which may augment the natural depreciation of the health stock over time or the negative impact of the stochastic shock. Additionally, preventive care med-ical inputs (Ft) (e.g., screenings for cancer, diabetes) can enable detection of health conditions in their early stages, thus preventing greater deterioration of health in the future. Non-medical care inputs such as nutrition, exercise, abstinence from risky behaviors (such as smoking) also affect health, although they are not modeled in this study due to lack of data on these health behaviors. IfXtrepresents demographic characteristics such as age and education, and we discretize health intoh= 1, . . . H categories, then:
and the probability of experiencing a health shock is written as:
Pr(St= 1) =gS(Ht, Xt, Ft)
The out-of-pocket price of medical care faced by the individual is determined by whether the medical care services are covered under the chosen insurance plan and, if covered, by the spe-cific cost-sharing structure of the plan in terms of deductibles, coinsurance rate, copayments, and limits on maximum out-of-pocket expenditures. Through its impact on the out-of-pocket price, the insurance plan choice also affects an individual’s utilization of medical care, thus affecting her health. These price and quantity (utilization) effects determine the individual’s out-of-pocket expenditures and total expenditures on medical care.1 Consumption,C
t, (on goods other than med-ical care) is the difference between the individual’s income and the amount spent on premiums and out-of-pocket medical expenditures. The budget constraint of the individual is represented by:
Yt =Ct+PIt.(It, Ft, Mt)
whereYtis income , Ct is a composite consumption good with price normalized to 1 andPIt ≡ (PI
t, PtF I, PtM I). PtI is the premium of insurance of plan I and (PtF I, PtM I) denote the actual effective price of preventive and curative medical services, respectively, when insurance planI is chosen in periodt.
Each period, prior to the realization of uncertain health shocks (St), health insurance (It) is se-lected. Medical care inputs (Mt,Ft) are then chosen and then health (Ht+1) evolves stochastically. Thus, each period, conditional on her information about the insurance choice set, the individual chooses among the coverage alternatives and levels of medical care utilization to maximize her re-maining lifetime utility subject to per period budget constraints, the probability of realizing health shocks, and the uncertain health production process. When individuals have imperfect information
about the features of their insurance alternatives, the price structure, (PI
t ≡(PtI, PtF I, PtM I)) under a specific plan, as perceived by the individual, can be different from the actual prices and budget constraint imposed by the plan, thus leading to ‘mistakes’ in insurance selection (i.e., choice of a plan which is different from the lifetime utility maximizing plan under perfect information). A the-oretical model detailing the impact of imperfect information on individual welfare and the process of acquisition of costly information is provided in section A.1 of the Appendix.
A common assumption in models of information frictions is that once a product is chosen, its attributes are automatically revealed to agents. It is difficult to extend this assumption to health insurance plan choice. Uncertain features of the chosen insurance plan are frequently revealed to consumers either after the consumption of medical care or while the decision to consume care is being made. Hence, I allow imperfect information about the chosen insurance plan to persist during the period. This allows information to have direct effects on medical care consumption and expenditures in addition to the indirect effects through choice of insurance plan. For example, uncertainty about coverage of preventive care medical services could lead to under-utilization of these services thus negatively impacting long term health outcomes.2 In other words, information could change the mix of medical care consumption chosen by individuals; informed individuals are more likely to consume preventive care services and other forms of discretionary care (such as regular follow-ups with their physicians) which could reduce their hospitalizations and more intensive care episodes in the future.
The utility loss due to suboptimal insurance plan choices or consumption of an inefficient mix of medical care services (or equivalently, the benefit of greater information), is likely to be higher for individuals in poorer health status who are expecting higher medical consumption in the period. The costs of acquiring information will also vary among individuals depending on access to information technology (e.g., internet, personal computer), public information campaigns, and
2The utilization of preventive care services is largely discretionary and most of these services are covered under
Figure 4.1: Timing of Annual Decisions, Health Shocks and Health Production
cognitive skills. Thus, the demand for information of a forward-looking individual will depend on the benefits and costs of greater information.
Figure 4.1 depicts the timing of annual information seeking, insurance and medical care de-cisions, health shocks, and health production that characterize the empirical model of individual behavior. At the beginning of the year, an elderly person collects information about her insur-ance alternatives (Kt) and makes a choice of insurance plan (It) for the year.3 After selecting her insurance plan, she could choose to utilize preventive care medical services (Ft) such as screen-ings or flu shots. Afterwards, the individual may or may not experience a health shock (St). This health shock along with the existing health conditions of the individual coming into the year and her insurance coverage affect curative medical care consumption (Mt ≡ (At, Nt)) during the year. I model two categories of medical care: the first category is inpatient events (At), such as hospitalizations, which are covered under Part A, and the second category is outpatient (such as
3K
physician visits) and prescription drug events (Nt) which are covered under Parts B and D, re-spectively.4 The utilization of preventive and curative medical services along with the prices of medical care in the beneficiary’s region and her insurance coverage together determine the expen-ditures (Et ≡[EtA, EtN, EtO]), whereEtAis the total expenditure (incurred by the provider and the individual) on inpatient services,EN
t is the total expenditure on outpatient services and drugs5and EtO is the out-of-pocket expenditure of the individual. At the end of the year, the health produc-tion process, which depends on health shocks and medical care inputs during the year, determines health next year (Ht+1 ≡[Rt+1, Lt+1, Gt+1]), measured by the number of severity adjusted chronic conditions (Rt+1), functional status (Lt+1) and self-reported health (Gt+1).
The information available to the individual at the beginning of each year is denoted by Ωt = (Rt, Lt, Gt, Et−1, Xt, Zt). This information set includes observed health at the beginning of the pe-riod summarized by the number of severity adjusted chronic conditions (Rt), functional status (Lt) and self-reported health (Gt) entering periodt. Et−1 is the total medical expenditure on medical care services (i.e.,Et−1 = EtA−1 +EtN−1) in the last period. Higher than expected expenditures in a period could prompt individuals to seek more information in the next period. Therefore, I allow lagged total medical care expenditure to influence individuals’ information as well as insurance selection directly apart from its indirect effect through health. Information entering the period also includes exogenous individual characteristics (Xt) such as education, income, and age, ex-ogenous theoretically-relevant variables reflecting price and supply conditions for insurance, and preventive and curative medical care (ZtI, ZF
t , ZtM) and exogenous shifters of information and health (ZtK, ZtH). The individual also knows all the current and lagged values of the permanent and time-specific components of the optimization problem that are unobserved by the researcher.
4Consumption of outpatient services and drugs is relatively more discretionary than consumption of inpatient
services which are, quite frequently, urgent and non-discretionary. The effects of insurance coverage and information is likely to differ across these two categories of curative care.
4.2 Empirical Specification of Jointly Estimated Equations
1. Information
The expected value of being more informed about the insurance choice set depends on the individual’s expectation of her medical care needs (i.e., her health during the period: Rt, Lt, Gt) , exogenous individual characteristics such as age, education, and income (Xt), and exogenous supply side or market characteristics (Zt) that affect the costs of acquiring information. In addition, past medical care expenditures (Et−1) could affect information through pathways other than health. For example, higher than expected realization of medical expenditures at the end of the year may compel individuals to gather more information about their insurance alternatives.
The Beneficiary Needs and Knowledge supplement of the Medicare Current Beneficiary Sur-vey (MCBS) reports respondent knowledge about the insurance choice set through a series of questions which allow for ‘yes’, ‘no’ or ‘don’t know’ responses. (These questions are listed in Section A.2 of the Appendix). I categorize the survey questions into three groups: questions re-lated to Medicare Advantage Plans (QM A), questions related to Prescription Drug Plans (QP DP) and questions related to coverage of preventive care services through Medicare (QP REV). There is one correct answer to each of these questions. The number of correct responses provided by the beneficiary in each category measures how accurately informed she is about the insurance op-tions/coverage benefits relevant to that category. Thus, Kt ≡ [Kt1, Kt2, Kt3], where Kt1 denotes knowledge about Medicare Advantage Plans, K2
t denotes knowledge about Prescription Drug Plans andK3
t denotes knowledge about coverage of preventive care services offered through Medi-care.6 Entering periodt, the individual observes the state variablesΩ
t = [Rt, Lt, Gt, Et−1, Xt, Zt]
whereZt = [ZtK, ZtI, ZtF, ZtM, ZtH]. The value of a given information level(k1, k2, k3)measured by k1 correct responses to questions relevant to Medicare Advantage plans, k2 correct responses to questions relevant to PDPs, and k3 correct responses to questions relevant to preventive care
6Knowledge about preventive care services directly affects utilization of these services, but it could also impact
coverage benefits of Medicare, can be written as7
VkK1k2k3t=vK(Rt, Lt, Gt, Et−1, Xt, Zt, Kt1 =k1, Kt2 =k2, Kt3 =k3) (4.1)
The variation in the observed arguments ofVkK1k2k3t(captured by the functionvK) explains only a part of the variation inK observed in the data. Unobserved individual characteristics (which may not be completely idiosyncratic) influence the number of correct responses given by the individual. These unobservables can be divided into three components. The first part,µK, captures permanent or time-independent unobserved individual heterogeneity that affects the value ofk. The second part,νK
t , represents time varying unobserved individual heterogeneity that affects value ofk. The third partKt is a serially uncorrelated error term that expresses an individual’s random preference for information.
Treating the number of correct answers in each category as a continuous measure of tion and taking into account the three components of unobserved heterogeneity, I model informa-tion with the following estimainforma-tion equainforma-tions
ki =αi0+α1iRt+αi2Lt+αi3Gt+αi4Et−1+αi5Xt
+αi6ZtK +α7iZtI+αi8ZtF +αi9ZtM +αi10ZtH +µKi+νtKi +Kt i (4.2)
where i=1, 2, 3 and ki is the number of correct answers in category i and µKi
and νKi
are pa-rameters to be estimated. While individuals in the model gather information at the beginning of each period, they may have also acquired some knowledge about their chosen insurance plan last year through medical care consumption or interactions with care personnel during the course of the year. I include insurance choice in the last period as an explanatory variable in the final estimation
7The function defining the value of choosing an information precision (higher precision leads to greater
equations for information (equation 4.2) to allow for such learning effects. The demand for differ-ent categories of information are correlated through both permandiffer-ent individual unobservables (µ) and time-varying individual unobservables (νt).
2. Insurance Choice
Let I denote the set of insurance alternatives available to an elderly person listed in Table 3.1. The indirect utility of each plan depends on the plan’s price (premium),8 its non-pecuniary attributes (e.g., reputation of the provider, plan rating, and ease of filing claims), the cost-sharing and coverage characteristics associated with the plan, the individual’s expectation of her medical care needs (captured by health) and medical care prices.9 With imperfect information about plan features, individuals’ perceived utility of a plan would depend on the extent of their knowledge. The expected indirect utility of choosing the insurance planI ∈ I conditional on the individual’s information is given by
VItI =vI(Rt, Lt, Gt, Et−1, Xt, ZtI, Z F
t , Z
H
t , Z
M
t , It=I|Kt) +uIIt (4.3)
Decomposing the error termuIItinto permanent, time varying and idiosyncratic error terms as discussed above, we obtain
uIIt =µII +νItI +IIt (4.4)
Since individuals cannot select both FFS and Part C Medicare, I summarize the insurance plan chosen by the individual using three binary choice variables: the decision to take original FFS Medicare or an MA plan, the decision to take up Part D (PDP) or not, and the decision to get supplemental insurance or not. LetIM A
t take the value1when the individual chooses a Medicare
8As multiple Medicare Advantage plans are typically available to the individual, premium for the broader category
of Medicare Advantage plans could be thought of as the premium of the best available MA plan in terms of price and coverage and similarly, for Prescription Drug Plans and Supplemental Insurance Plans.
9Unfortunately, several aspects of health insurance such as coinsurance, deductibles are either not observed in the
Advantage Plan and 0when FFS Medicare is chosen. IP DP
t takes the value 1 when a Prescrip-tion Drug Plan (Part D) is chosen for drug coverage; 0 otherwise. IP DP
t takes the value 1when supplemental insurance is chosen;0, otherwise.
Substituting equation 4.4 into 4.3 we get
VItI =vI(Rt, Lt, Gt, Et−1, Xt, ZtI, Z F
t , Z
H
t , Z
M
t , It=I|Kt) +µII +ν
I
It+
I
It (4.5)
Approximating thevI(.)function in 4.5 with a series expansion of its arguments and assuming a type I extreme value distribution for the idiosyncratic error termIIt, the log odds ratio of choosing Itj is given by the following expression.
ln "
Pr(Itj = 1) Pr(Itj = 0) #
=β0+β j
1Rt+β
j
2Lt+β
j
3Gt+β
j
4Xt+β
j
5It−1+β
j
6Et−1+β
j
7k1t+β
j
8kt2+β
j
9kt3
+β7jZtI +β8jZtF +β9jZtM +β10j ZtH +µIj +νjtI +Ijt (4.6)
wherej= MA, PDP, SUPP.
However, while it is possible to completely specify the choice set a dual eligible or a veteran bene-ficiary, the data used in this study is not rich enough to identify the actual plan choice made in such cases.10 Thus, I keep a single choice set (as in Table 3.1) common to all beneficiaries and treat ‘dual eligibility’, ‘veteran status’ and ‘access to employer sponsored insurance’ as additional indi-vidual characteristics that explain the probabilities of having an MA plan, a PDP or supplemental insurance as well as the other dependent variables of the model. I also allow lagged insurance (It−1) in the estimation equation to capture inertia effects in health insurance plan choice.
3. Demand for Preventive Care
After the insurance plan is has been selected, the individual can choose to seek preventive care services (which include screenings such as mammogram, cardiovascular screening, flushots, and routine eye exams). Utilization of preventive care services can lead to early detection of health problems and can prevent greater deterioration of health in the future. Since I do not assume that all features of the chosen insurance plan are revealed automatically after the selection of the plan, this decision is conditional on the information possessed by the individual and the insurance plan chosen. Most preventive care services are covered under Medicare.11 Hence, less knowledge about coverage of preventive care services generally implies that the individual either incorrectly thinks that the preventive care service is not covered or is uncertain about it, when it is actually covered, leading to under-utilization of these services.
Ftis a binary variable that takes the value1when a female uses one or more of the four preven-tive care services (mammogram, papsmear, flushot, eye exam) or when a male uses one or more of three services (PSA blood test, flushot, eyeexam). Incidence of cancer increases exponentially with advancing age and cancer screenings are the most recommended forms of preventive care for senior citizens (Berger et al., 2006).12
10For example, we cannot distinguish between individuals with full versus part Medicaid eligibility or between a
Medicaid managed care plan versus a FFS plan.
11Exceptions are routine eye exams and dental check-ups.
12Data considerations also drive the selection of these particular services. Because the claims data for MA plan
The value function for preventive care and its arguments are:
Vf tF =vF(Rt, Lt, Gt, Xt, Et−1, ZtF, Z M
t , Z
H
t |Kt, It) +uFf t (4.7) which leads to the following estimation equation:
ln
Pr(Ft = 1) Pr(Ft = 0)
=γ0+γ1Rt+γ2Lt+γ3Gt
+γ4Xt+γ5Et−1+γ6kt1+γ7kt2+γ8k3t +γ9ItM A+γ10ItP DP +γ11ItSU P P
+γ12ZtF +γ13ZtM +γ14ZtH +µ F
+νtF +Ft (4.8)
4. Health Shock
The Medicare Current Beneficiary Survey (MCBS) provides detailed survey data on the ben-eficiaries’ chronic conditions and the complications associated with these chronic conditions. A health shock is defined as an onset of a new chronic condition related to heart problems, respiratory problems, cancer and diabetes (since these are the most common disabling conditions among the elderly and they also tend to be the cost drivers of elderly medical expenditures (Wolff et al., 2002; Yang et al., 2009). Individuals with existing chronic conditions can also experience a health shock if severity of these conditions increases.13 An adverse health shock (S
t=1) implies that the individ-ual’s severity adjusted chronic conditions increases by 1 in the next period (i.e.,Rt+1 =Rt+ 1).
The log odds ratio of having a health shock in periodtrelative to not having a health shock is given by
ln
Pr(St= 1) Pr(St= 0)
=δ0+δ1Rt+δ2Lt+δ3Gt+δ4Xt+δ5Ft+δ6ZtH +µ
S+νS
t (4.9)
Health status entering the period (Rt, Lt, Gt), demographic characteristics (Xt), and the utilization of preventive care services (Ft) affect the probability of experiencing a health shock. County and
13For example, severity increases if an individual with an existing heart condition experiences increased
year differences in health-related exogenous variables (ZH
t ) also influence the onset of a chronic condition or an increase in complications associated with a condition. These health shocks are correlated with permanent and time-varying unobservables that determine the other behaviors (in-formation seeking, insurance and preventive care selection, medical care demand and functionality transitions) captured byµS andνS
t in the above estimation equation. 5. Medical Care Demand and Expenditures
The demand for medical care is derived from its effect on the individual’s lifetime utility which consists of two parts: the contemporaneous utility, and the expected present discounted value of utility in the future conditional on medical care choices in the period. Medical care utilization affects contemporaneous utility through its effect on expenditures on medical care (and hence, consumption). This effect on current period utility varies with the health insurance selected for the period (It) and exogenous prices of medical care (ZtM). Expected future utility from medical care consumption this period depends on the effectiveness of medical care in maintaining or improving health next period which varies with observed health shocks (St), as well as health status entering the period (Ht ≡ (Rt, Lt, Gt)). I also allow lagged medical care expenditure to affect current medical consumption through channels other than health.14
The value function corresponding to a choice of medical care with its arguments is given by
VanM =vM(Rt, Lt, Gt, Et−1, Xt, At=a, Nt=n|Kt, It, Ft, St) +uMant (4.10)
Atis measured by the number of inpatient events during the course of the year andNtis the total number of outpatient and prescription drug events in the decision year. Since there is considerable skewness in the utilization of inpatient services (around 30 per cent of the individuals do not have any inpatient events and a small percentage have extremely high number of such events), I model annual (log) utilization of inpatient services as the joint product of the probability of any utilization
14For example, hospitalizations in the previous period could necessitate follow-ups, physician visits or drug use in
(using a logit equation) and the log of utilization, if any (treated as a continuous outcome). Since the estimation sample consists largely of the elderly, only 3 per cent of the individuals do not use any outpatient services or drugs (Nt). Hence, I simply model log ofNtfor utilization of outpatient services and drugs. The probability of any inpatient utilization (At) is given by:
ln
Pr(At>0) Pr(At= 0)
=λ0+λ1Rt+λ2Lt+λ3Gt
+λ4Xt+λ5Et−1+λ6St+λ7ItM A+λ8ItP DP +λ9ItSU P P
+λ10kt1+λ11kt2+λ12kt3+λ13ZtM +µ A1
+νtA1 (4.11)
Log use of inpatient service use,At, is modeled as:
ln(At|At>0) = ψ0+ψ1Rt+ψ2Lt+ψ3Gt
+ψ4Xt+ψ5Et−1 +ψ6St+ψ7ItM A+ψ8ItP DP +ψ9ItSU P P
+ψ10k1t +ψ11k2t +ψ12kt3+ψ13ZtM +µA2+νtA2 (4.12)
and log use of outpatient services and prescription drug utilization,Nt, is modeled as:
ln(Nt) = τ0+τ1Rt+τ2Lt+τ3Gt
+τ4Xt+τ5Et−1+τ6St+τ7Ft+τ8ItM A+τ9ItP DP +τ10ItSU P P
+τ11kt1+τ12kt2+τ13kt3+τ14ZtM +µ
N +νN
t (4.13)
The demands for each type of medical care are estimated jointly (along with information, insur-ance, shocks, and health production) and are correlated through both permanent individual unob-servables (µ) and contemporaneous time-varying individual unobservables (νt).
Apart from the indirect effect of information on medical expenditures through its effect on in-surance choice, and, preventive and medical care utilization, the estimation equation allows for independent effects of information on expenditures. Three types of medical expenditures are mod-eled: total medical expenditures (incurred by the provider and the individual) corresponding to the Atutilization,EtA; total medical expenditures corresponding toNtutilization,EtN; and, total out-of-pocket expenditures of the individual (including insurance payments),EtO. Thus, the estimation equation for total medical expenditures on inpatient services is given by:
ln(EtA|At >0) = τ0A+τ A
1 Rt+τ2ALt+τ3AGt
+τ4AXt+τ5AAt+τ6ASt+τ7AI M A
t +τ
A
8 I
P DP
t +τ
A
9 I
SU P P t
+τ10Ak1t +τ11Akt2+τ12Ak3t +τ13AZtM +µEA +νtEA (4.14)
The estimation equation for total medical expenditures on outpatient services and drugs is:
ln(EtN) =τ0N +τ1NRt+τ2NLt+τ3NGt
+τ4NXt+τ5NNt+τ6NSt+τ7NI M A
t +τ
N
8 I
P DP
t +τ
N
9 I
SU P P t
+τ10Nkt1+τ11Nkt2+τ12Nkt3+τ13NZtM +µEN +νtEN (4.15)
and the equation for total out-of-pocket expenditures is:
ln(EtO) =τ0O+τ1ORt+τ2OLt+τ3OGt
+τ4OXt+τ5OAt+τ6ONt+τ7OSt+τ8OI M A
t +τ
O
9 I
P DP
t +τ
O
10I
SU P P t
6. Health Production
Apart from the number of severity adjusted chronic conditions (Rt) which are automatically updated from the initial number of conditions and the value of the shock variable, I model two ad-ditional measures of health: functional status (Lt) and self-reported health (Gt). Functional status is an objective measure of health capturing the number of ADL(Activities of Daily Living) limita-tions and number of IADL(Instrumental Activities of Daily Living) limitalimita-tions. More specifically, the functional status is a categorical variable that takes the value,Lt+1 = 0, when there are no ADL or IADL limitations andLt+1 = 1, when the individual has at least one IADL limitation and up to two ADL limitations (moderate disability),Lt+1 = 2, when there are more than two limitations (severe disability), andLt+1 = 3, when the individual realizes the extreme outcome of death in the next period. The log odds of functional status relative to no limitation in functions is specified as:
ln
Pr(Lt+1 =a) Pr(Lt+1 = 0)
=χa1Rt+χa2Lt+χa3Gt+χa4St+χa5StAt+χ6aStNt+χa7Xt
+χa8RtAt+χa9RtNt+χa101(Lt= 1)At+χ11a 1(Lt= 1)Nt+χa121(Lt = 2)At+χa131(Lt= 2)Nt
+χa14GtAt+χa15GtNt+µaL+νtaL (4.17)
where a=1, 2 or 3.
Interactions of shock with medical care use are included to capture the impact of medical care in tempering the effect of shocks on health. Interactions of the two types of medical care with the number of severity-adjusted chronic conditions, the functional status and self-reported health entering the period are also included to allow the productivity of medical care to differ by health status.
treated as a continuous variable for the purpose of estimation.15
Gt+1 =χG1Rt+χG2Lt+χG3Gt+χG4St+χG5StAt+χG6StNt+χG7Xt
+χG8RtAt+χG9RtNt+χG101(Lt= 1)At+χ11G1(Lt= 1)Nt+χG121(Lt = 2)At+χG131(Lt= 2)Nt
+χG14GtAt+χG15GtNt+µG+νtG (4.18)
The dynamics of health are captured by the dependence of functional status and self-reported health next period on endogenous values of current functional status and self-reported health. Ad-ditionally, health transitions are dynamic because they depend on medical care consumption in the current period. It should be noted that health production depends on other inputs such as nutrition, exercise, and risky behaviors (e.g., smoking) which are not modeled in this research due to lack of data. These omitted inputs are a part of the unobserved heterogeneity in the model. For example, proclivity to engage in risky behaviors like smoking is likely to be a permanent characteristic of the individual and hence gets included in theµcomponent which persists over time. Other unob-servables (such as health shocks not captured by chronic conditions) are modeled as part of the time-varying component of the unobserved heterogeneity,νt.
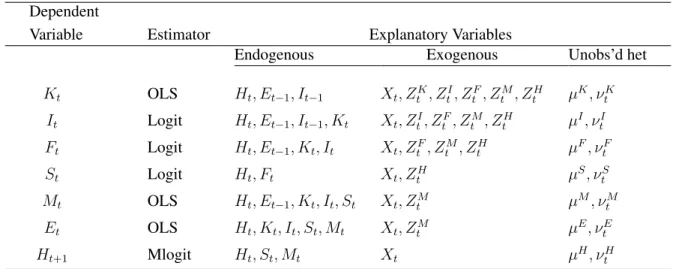
Table 4.1 displays the dependent variables and the explanatory variables for the jointly esti-mated system of equations in the model.
7. Initial Conditions
Additional reduced-form equations are included in the model to explain the initially-observed values of functional status, the number of severity-adjusted chronic conditions, self-reported health, insurance plan choice and medical care expenditures. These initial conditions cannot be modeled using the dynamic equations described above because we do not observe the previous behavior that influences their outcomes. Hence, the initial conditions are reduced-form analogs of the dy-namic demand and health production equations with appropriate exogenous variables included for
15There are five categories of self-reported health and a multinomial logit model would considerably increase the
Table 4.1: Summary of Equation Specifications
Dependent
Variable Estimator Explanatory Variables
Endogenous Exogenous Unobs’d het
Kt OLS Ht, Et−1, It−1 Xt, ZtK, ZtI, ZtF, ZtM, ZtH µK, νtK
It Logit Ht, Et−1, It−1, Kt Xt, ZtI, ZtF, ZtM, ZtH µI, νtI
Ft Logit Ht, Et−1, Kt, It Xt, ZtF, ZtM, ZtH µF, νtF
St Logit Ht, Ft Xt, ZtH µS, νtS
Mt OLS Ht, Et−1, Kt, It, St Xt, ZtM µM, νtM
Et OLS Ht, Kt, It, St, Mt Xt, ZtM µE, νtE
Ht+1 Mlogit Ht, St, Mt Xt µH, νH
t
CHAPTER 5
ESTIMATION AND IDENTIFICATION
The demand and production functions specified above form the set of jointly estimated equa-tions of the empirical model. These equaequa-tions are correlated through observed explanatory vari-ables, as well as permanent (µ) and time varying (νt) unobservables that enter each equation. This specification of the unobserved heterogeneity1 allows for serial correlation within outcomes over time as well as two different sources of correlation across outcomes. The permanent heterogeneity is captured by the joint distribution of
µ= [µK, µI, µF, µS, µA1, µA2, µN, µE, µL, µG].
Similarly, time-varying heterogeneity is defined by the joint distribution of
νt= [νtK, ν
I
t, νtF, νtS, νtA1, νtA2, νtN, νtE, νtL, νtG].
Instead of imposing a specific form (such as normal) on these multivariate distributions, I model the unobserved heterogeneity as random effects and approximate its unknown distribution discretely, estimating both the mass points along the support of the unobserved components as well as the associated probability weights. This flexible estimation technique, termed as Discrete Factor Ran-dom Effects(DFRE) (Heckman and Singer, 1984; Mroz and Guilkey, 1992; Mroz, 1999), has been used in a wide variety of empirical applications including health.2 The DFRE method performs
1Model estimation must account for unobserved heterogeneity (which could produce a spurious correlation
be-tween dependent variables and endogenous explanatory variables), in order to reduce the bias in estimated coefficients that arises from inclusion of endogenous variables, omission of relevant variables or measurement error.
as well as maximum likelihood estimation assuming normality, when the true distribution of the error terms is jointly normal and performs better (in terms of precision and bias) when the true distribution is not normal. The DFRE approach allows unobservable (to the researcher) individ-ual characteristics to impact all jointly- estimated equations and integrates over their distributions when constructing the likelihood function. Specification of the likelihood function is provided in Section A.4 of the Appendix.
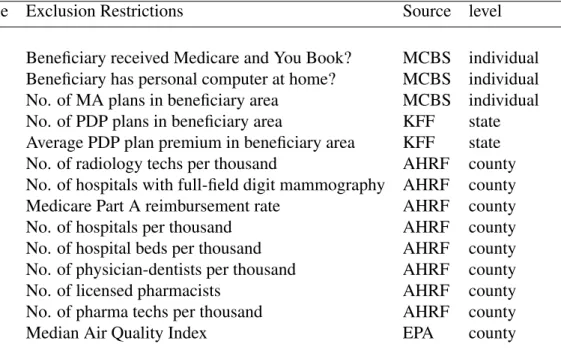
Estimation of dynamic equations with panel data requires exogeneity of some explanatory variables conditional on the unobserved heterogeneity. The system of dynamic equations is, in part, identified by the inclusion of exogenous, theoretically relevant variables,Zt =(ZtK, Z
I
t, ZtF,
ZM, ZH
t ) that affect the behavior/outcome in one equation but do not affect other endogenous variables independently. A description of these identifying Z variables, the data sources and the specific equations in which they belong is provided in Table 5.1.
population capture the individual’s access to curative medical care services, thus affecting utiliza-tion of these services. The median air quality index (a measure of air quality that is provided by the Environmental Protection Agency), at the county level, is used as an exogenous shifter of health. Conditional on the unobserved heterogeneity (µandνt), lagged values of the endogenous variables also aid identification (assuming no serial correlation in the remaining errors). Finally, functional forms of the non-linear equations (the logit and the multinomial logits) of the model provide identification.
Table 5.1: Description of Exogenous Identifying Variables
Dependent Variable Exclusion Restrictions Source level
Information Beneficiary received Medicare and You Book? MCBS individual Beneficiary has personal computer at home? MCBS individual Insurance No. of MA plans in beneficiary area MCBS individual
No. of PDP plans in beneficiary area KFF state Average PDP plan premium in beneficiary area KFF state Preventive Care No. of radiology techs per thousand AHRF county
No. of hospitals with full-field digit mammography AHRF county Medical care Medicare Part A reimbursement rate AHRF county
No. of hospitals per thousand AHRF county
No. of hospital beds per thousand AHRF county No. of physician-dentists per thousand AHRF county
No. of licensed pharmacists AHRF county
No. of pharma techs per thousand AHRF county
Health Median Air Quality Index EPA county
CHAPTER 6 DATA
The Medicare Current Beneficiary Survey (MCBS) is a longitudinal survey of Medicare ben-eficiaries conducted by the Centers for Medicare and Medicaid Services (CMS). The MCBS files combine survey data from the beneficiaries with claims data to provide a complete picture of med-ical care utilization and expenditures. As part of the survey data, respondents answer questions about demographics, health insurance, health status and medical events and expenditures. Re-spondents are followed for a maximum period of four years after which they are phased out to introduce new participants, keeping the overall cross-sectional demographic composition of the survey constant across years.
This study uses MCBS files from 2006 to 2011. As Medicare Part D went into effect in 2006, the number of choices available increased considerably.1 Due to the rotating panel nature of the data, respondents are observed for varying numbers of years from 2006-2011.2 There is relatively little attrition due to non-response.
For the construction of the final estimation sample, younger individuals who qualify for Medi-care due to disability status or End Stage Renal Disease (ESRD) are dropped from the analysis as these individuals are likely to be much different from the elderly population with Medicare. Individuals living in long-term care facilities are also excluded from the analysis.3 I also excluded beneficiaries whose survey information was completed by their proxies and individuals who re-ported not selecting their own insurance plan (i.e., their plan was chosen by a proxy, usually an
12011 is the last year of complete data available from CMS.
2For example, beneficiaries who entered the survey in 2004 are observed for only two years (2006 and 2007) in the
estimation sample.
adult child or a spouse). However, respondents who report receiving help on their insurance deci-sions are included in the sample.4 Table 6.1 provides additional information on the sample used for estimation, which consists of 17,813 individuals who contribute 52,282 person-year observations.
Table 6.1: Empirical Distribution of Sample Participants
Years followed Number of individuals Percentage of Sample
At least 2 years 17,813 100
At least 3 years 10,923 61.32
At least 4 years 5,733 32.18
Exactly 2 years 6,890 38.68
Exactly 3 years 5,190 29.14
Exactly 4 years 5,733 32.18
2006 7,531 14.40
2007 10,245 19.60
2008 9,417 18.01
2009 9,197 17.59
2010 9,282 17.75
2011 6,610 12.64
Number of unique individuals 17,813
Number of person-year observations 52,282
Information possessed by an individual regarding Medicare Advantage plans is measured by the number of correct responses to Medicare Advantage related questions5 and similarly for Pre-scription Drug plans and preventive care coverage benefits of Medicare. Only 22 per cent of the elderly give all correct responses to Medicare Advantage related questions and approximately the same percentage give all incorrect answers. The percentage of elderly who give all correct re-sponses to Prescription Drug Coverage (PDP) related questions is 32 per cent while less than 13 per cent answer all drug coverage related questions incorrectly.
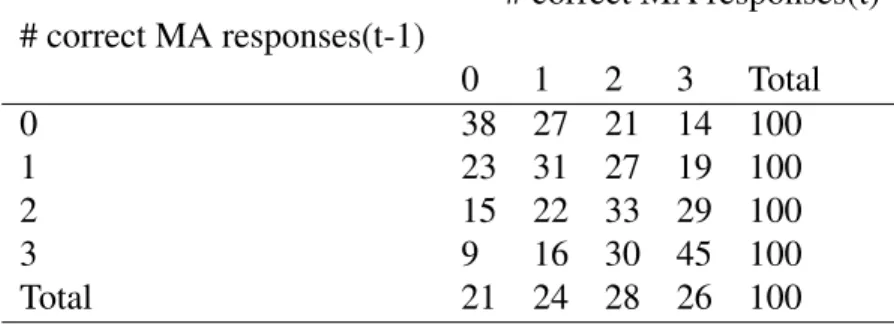
Table 6.2 shows one-year transitions in the number of correct MA responses given by the sample participants. While we observe some persistence in information, it is clear that there is
considerable movement across information categories too (i.e., individuals acquire and lose (for-get) information). The average information possessed generally declines with age suggesting the importance of cognitive costs in acquiring information (Figure 6.1).6
FFS Medicare is the primary form of health insurance (69 per cent) chosen by the elderly. Just over half(54 per cent) of the beneficiaries choose a Prescription Drug Plan for drug coverage and 66 per cent have some form of supplemental insurance (e.g., Medigap, Employer Sponsored Insurance (ESI)).
Table 6.2: One Year Information Transitions
# correct MA responses(t) # correct MA responses(t-1)
0 1 2 3 Total
0 38 27 21 14 100
1 23 31 27 19 100
2 15 22 33 29 100
3 9 16 30 45 100
Total 21 24 28 26 100
Source:MCBS. The numbers show the percentage of sample participants in each information category.
The average annual expenditures on inpatient services (covered by Part A) and outpatient ser-vices and prescription drugs (combined) during this time period were $7,838 and $8,341 respec-tively. While Part A expenditures increase with age, expenditures on outpatient events and drugs follow a U-shaped pattern (Figure 6.3). The average individual out-of-pocket expenditures (in-cluding insurance premiums) of sample participants was $2,211, which also shows an increasing trend with age.
Health status is measured by two objective measures: functional status and the number of chronic conditions. Functional status is measured by the number of Activities of Daily Living (ADLs) and Instrumental Activities of Daily Living (IADLs) reported in the survey files of the
6Solid lines represent the observed statistics from the actual sample. The simulated observations indicated by
Figure 6.1: Actual and Simulated Number of Correct Responses, by Age
Figure 6.3: Actual and Simulated Medical Care Expenditures, by Age
MCBS. Approximately 14 per cent of the sample respondents report having moderate disability with at least one IADL and with no more than two ADLs and 8 per cent report having severe disability with three or more ADLs. The MCBS survey data provides detailed information on the beneficiaries’ chronic conditions and severity of these conditions. Four different types of chronic conditions — heart, respiratory, cancer and diabetes — are considered for constructing the initial number of chronic conditions. This number (measuring severity-adjusted chronic conditions) is updated with the development of a new condition or an increase in severity of an existing one. Self-reported health on a scale of 1 (poor) to 5 (excellent) is used as a measure of an individual’s subjective evaluation of her health.
Table 6.3: Description of Exogenous Individual Variables
Variable Name Mean Standard Deviation
Time-invariant individual characteristics
Years of schooling (range:10-19 years) 13.76 3.19
Female (omitted: male) 0.58 0.49
Race (omitted: white)
Black 0.08 0.27
Other Race 0.05 0.21
Time-varying individual characteristics
Age (range: 65-105) 76.80 7.24
Rural (omitted: Urban) 0.26 0.44
Not married (omitted: Married) 0.47 0.50
Annual Income (000’s of year 2011 dollars) 29.32 51.42
of the model. Additionally, exogenous variables (usually capturing supply and price conditions) specified in Table 5.1 are used as explanatory variables.
Figure 6.4 shows the unconditional relationship between insurance choice and out-of-pocket expenditures. Relative to FFS Medicare, out-of-pocket expenditures associated with a Medicare Advantage Plan are lower across the age distribution. Average individual out-of-pocket expendi-tures are somewhat lower for those without a Prescription Drug Plan, particularly, in the early ages. However, the variation in out-of-pocket expenditures is higher for individuals without a Prescrip-tion Drug Plan. For consumers who choose to buy supplemental insurance, average out-of-pocket expenditures are higher at all ages relative to those who do not have supplemental insurance. As we would expect, the variance associated with out-of-pocket expenditures across the age distri-bution is lower with the purchase of supplemental insurance. Figure 6.5 shows the unconditional relationship between information and insurance choices in the data. For the purpose of this graph, an individual is ‘more informed’ if they are able to answer at least two Medicare Advantage related questions, at least two Prescription Drug Plan related questions and at least five questions related to Medicare coverage of preventive care.7 An individual is ‘less informed’ if the number of correct
Figure 6.4: Out-of-Pocket Expenditures, by Insurance Choice
answers to Medicare Advantage and PDP related questions is less than one each and the number of correct answers to preventive care related questions is less than 3. As seen in the graph, the proba-bility of selecting a Medicare Advantage plan is much higher in the group that is more informed at all ages. The same relationship is found with the choice of a Prescription Drug Plan. However, the probability of selecting supplemental insurance does not differ across the more and less informed subgroups of individuals.
CHAPTER 7 RESULTS
In the first part of this chapter, I discuss the signs and significance of the coefficients of the main explanatory variables in the estimation equations. These numbers describe the qualitative, short-term (static) effects. Three mass points (each) were found to be sufficient for capturing the distributions of permanent and time varying individual unobserved heterogeneity that is likely to influence choices and outcomes of the model.1 In the second part of this chapter, I discuss the model fit and results from five-year simulations of the jointly estimated system of equations under alternate information scenarios that impact endogenous state variables over time. These results illustrate the long-term, dynamic effects of information.
7.1 Parameter Estimates
I begin by examining the factors that explain the heterogeneity in information observed in the data, followed by an analysis of the impact of imperfect information on individual choices and outcomes.
1. Information
Table 7.1 displays parameter estimates for selected variables explaining information variation in the data for each of the information categories. The number of chronic conditions at the be-ginning of the period has a positive significant impact on information about MA Plans, PDPs and preventive care coverage benefits available through Medicare. Individuals with functional limita-tions (moderately disabled, severely diabled) are more likely to know about MA Plans and PDPs but have less knowledge about preventive care service coverage relative to individuals with no functional limitations. Having an MA plan or a PDP in the last period is a strong predictor (in
terms of both magnitude and significance) of greater knowledge about these insurance plans. The importance of lagged insurance choices suggests that there could be ‘learning through use’ effects, (i.e., beneficiaries learn about their chosen plan through utilization of medical care services as they progress through the year), which combined with persistence in information2 could explain the results.
Years of schooling and income have expected positive effects on information. Minorities (black and other non-white populations) tend to have less information than whites, all else equal. While declining age could lead to loss in cognitive abilities making information more costly to acquire, there could also be learning effects over time as beneficiaries navigate through the Medicare system each year. The negative impact of age on information suggests that cognitive costs (not captured through health status- functional limitations, number of chronic conditions or self-reported health) are important. The exogenous identifying variables — having a personal computer at home and receiving the Medicare and You Book — have a significant, positive impact on individuals’ infor-mation levels.
2. Effect of information on insurance choice
The large magnitudes and significance of coefficients corresponding to the insurance plan cho-sen last year in Table 7.2 provide evidence for the considerable amount of persistence that exists in insurance selection. However, even after controlling for past choices, information (i.e., the number of correct responses) has a significant effect on the choice of insurance plan. In particular, indi-viduals with greater information about MA plans and PDPs are more likely to choose these plans.3 Beneficiaries who are more knowledgeable about the preventive care service coverage benefits of Medicare are more likely to choose a combination of Original Medicare with PDP and some form
2The correct answers to the questions asked in the Beneficiary Needs and Knowledge Supplement do not change
considerably over the years, so information persistence is to be expected.
3We might expect that individuals could gain information about a product by ‘experiencing’ the product, thus
of supplemental insurance over an MA plan. Higher medical expenditures in the past have a pos-itive impact on the probability of choosing supplemental insurance and individuals with chronic conditions are likely to choose Prescription Drug Plans for drug coverage. Parameter estimates also indicate advantageous selection in MA plans (i.e., individuals in better health who realize lower medical expenditures are more likely to select Medicare Advantage Plans).
Medicaid eligibility has a positive significant impact on the probability of having an MA plan. This may be due to mandated automatic enrollment in managed care plans in many states. The probability of enrolling in a PDP is lower with Medicaid eligibility as the full Medicaid status covers prescription drugs. Medicaid eligibility also reduces the probability of supplemental insur-ance, in part, due to the comprehensive benefits associated with the combination of Medicare and Medicaid. Another reason could be the eligibility criteria based on low income, which reduces the chances of supplemental insurance purchase. The VA health care system also has provisions for prescription drug coverage. As a result, beneficiaries who are eligible for VA health benefits are less likely to be enrolled in PDPs and Medicare Advantage Plans. Access to employer sponsored insurance increases the probability of enrollment in a Medicare Advantage Plan and a supplemental insurance plan.
3. Effect of information on use of preventive care services