ASSOCIATIONS BETWEEN PERSONAL CARE PRODUCT USE PATTERNS AND BREAST CANCER RISK IN THE SISTER STUDY
Kyla Welch Taylor
A dissertation submitted to the faculty at the University of North Carolina at Chapel Hill in partial fulfillment of the requirements for the degree of Doctor of Philosophy in the Department
of Epidemiology in the Gillings School of Global Public Health.
Chapel Hill 2016
ii © 2016
iii
ABSTRACT
Kyla Welch Taylor: Associations between Personal Care Product Use Patterns and Breast Cancer Risk in the Sister Study
(Under the direction of Melissa Troester)
Background: Among women in the United States, breast cancer is the second leading cancer-related cause of death. It is hypothesized that certain chemicals in personal care products may increase risk of breast cancer. The primary aims of this study were to use a data-centered approach to classify complex patterns of exposure to personal care products, understand how these patterns vary according breast cancer risk factors, and evaluate whether patterns of beauty, hair, or skin-related personal care products or individual products were associated with breast cancer.
Methods: Limiting the sample to non-Hispanic blacks and whites (N=47,019), latent class analysis (LCA) was used to identify groups of individuals with similar patterns of personal care product use based on responses to survey questions. Personal care products were categorized into three product types (beauty, hair, and skincare products) and separate latent classes were
iv
Results: Latent class analysis (LCA) was used to reduce data dimensionality across 48
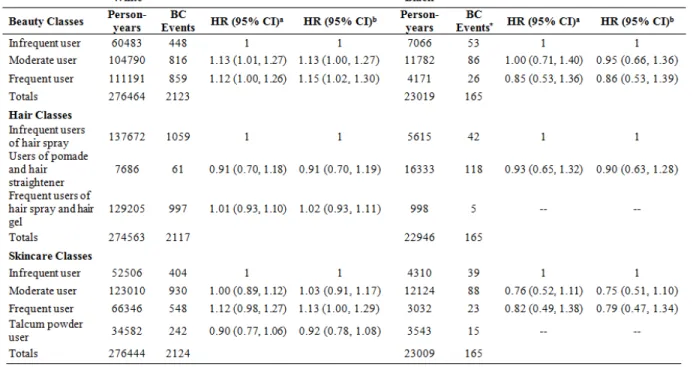
individual personal care product use questions and to identify groups of individuals with similar patterns of product use. Three latent classes were identified for both the beauty and hair product groups; the skincare product group had four classes. Among white women, those classified as ‘moderate’ and ‘frequent’ users of beauty products had increased risk of breast cancer relative to ‘infrequent users’ (HR=1.12; 95% CI: 1.00-1.27 and HR=1.15; 95% CI: 1.02-1.30). ‘Frequent’ users of skincare products also had increased risk of breast cancer relative to ‘infrequent users’ (HR=1.13; 95% CI: 1.00-1.29).
v
ACKNOWLEDGEMENTS
I would first like to express my appreciation to my advisor, Dr. Melissa Troester, for her guidance throughout my time at UNC. Her positive energy has been inspirational and she has provided me with expert direction throughout the entire process. I would also like to thank Dr. Donna Baird who served as a co-mentor and has provided valuable input from the beginning, often encouraging me to view my research from a different perspective.
I would also like to thank the rest of my committee, Dr. Amy Herring, Dr. Hazel Nichols, and Dr. Larry Engel for their expertise and thoughtful feedback. I would like to thank Dr. Dale Sandler at NIEHS for her contributions to the manuscripts. I also wish to thank my supervisor at Office of Health Assessment and Translation, Dr. Kristina Thayer. Without her enthusiasm and mentorship, I would not have been able to complete this degree while working full-time at NIEHS.
vi
TABLE OF CONTENTS
LIST OF TABLES ... ix
LIST OF FIGURES ... x
LIST OF ABBREVIATIONS ... xi
CHAPTER 1: BACKGROUND ... 1
1.1. Breast Cancer Biology and Epidemiology ... 1
1.1.1. Genetic Risk Factors ... 1
1.1.2. Established Non-Genetic Risk Factors ... 2
1.1.3. Non-established Non-Genetic Risk Factors ... 6
1.2. Environmental Exposures and Breast Cancer ... 6
1.3. Methodological Issues ... 8
1.4. Personal Care Product Sources and Exposure ... 9
1.5. Data Collection in Epidemiological Studies ... 10
1.6. Personal Care Products and Breast Cancer ... 14
1.7. Conclusions ... 16
CHAPTER 2: METHODS ... 18
2.1. Specific Aims and Hypotheses ... 18
2.2. Study Design ... 19
2.2.1. NIEHS Sister Study ... 19
vii
2.3. Data Analysis ... 20
2.3.1. Exposure assessment and categorization ... 20
2.3.2. Breast cancer assessment ... 20
2.3.3. Effect modification ... 21
2.3.4. Confounding ... 22
2.3.5. Statistical methods ... 22
CHAPTER 3: ASSOCIATIONS AMONG PERSONAL CARE PRODUCT USE PATTERNS AND EXOGENOUS HORMONE USE IN THE SISTER STUDY ... 26
3.1. Overview ... 26
3.2. Introduction ... 27
3.3. Methods ... 28
3.3.1. Study population ... 28
3.3.2. Personal care product assessment ... 29
3.3.3. Latent classes ... 29
3.3.4. Statistical analysis describing association beween personal product use and exogenous hormone use ... 30
3.4. Results ... 31
3.4.1. Latent class descriptions ... 31
3.4.2. Product use patterns by race ... 31
3.4.3. Patterns of class membership across product categories (beauty, hair, skin) ... 32
3.4.4. Exogenous hormonal exposures and product use ... 32
3.5. Discussion ... 33
3.6. Conclusion ... 37
viii
4.1. Overview ... 45
4.2. Introduction ... 46
4.3. Methods ... 47
4.3.1. Study Design and Population ... 47
4.3.2. Breast cancer ascertainment ... 48
4.3.3. Personal care product exposure ... 48
4.3.4. Statistical Analyses ... 49
4.4. Results ... 50
4.5. Discussion ... 52
4.6. Conclusion ... 56
CHAPTER 5: DISCUSSION ... 60
5.1. Brief summary of findings ... 60
5.2. Biological plausibility ... 61
5.3. Significance and future direction ... 62
APPENDIX A: TABLES………..………...65
ix
LIST OF TABLES
Table 2.1. Measurement and definition of potential confounders ... 25
Table 3.1. Descriptive characteristics of sample population ... 38
Table 3.2. Indicators of fit for latent class analysis ... 39
Table 3.3. Latent class distribution by race ... 40
Table 3.4. Latent class descriptions by product category ... 41
Table 4.1. Latent class descriptions by product category ... 57
Table 4.2. Hazard ratios (HRs) and 95% confidence intervals (CIs) for the association between personal care product latent classes and overall breast cancer risk among white and black women ... 58
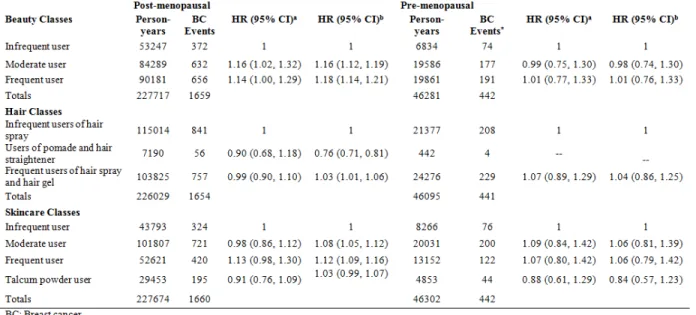
Table 4.3. Hazard ratios (HRs) and 95% confidence intervals (CIs) for the association between latent classes and breast cancer risk among post-menopausal and pre-menopausal women white women ... 59
Table A.1. Item response probabilities for beauty product latent classes (3 class model) ... 65
Table A.2. Item response probabilities for hair product latent classes (3 class model) ... 66
Table A.3. Item response probabilities for skincare product latent classes (4 class model) ... 67
Table A.4. Initial product types and final product types by category: beauty, hair, skincare products ... 68
Table A.5. Re-categorization of original response options by product ... 69
Table A.6. Age-adjusted prevalence differences (PDs) and 95% confidence intervals (CIs) for associations between breast cancer risk factors and latent classes within each product category ... 71
x
LIST OF FIGURES
xi
LIST OF ABBREVIATIONS
AIC Akaike’s information criterion
BIC Bayesian information criterion
BMI Body Mass Index
BPA Bisphenol A
BC Breast Cancer
CDC Centers for Disease Control
CI Confidence Interval
EDC Endocrine Disrupting Chemical
EARTH Environmental and Reproductive Health Study,
ER Estrogen Receptor
HT Hormone Therapy
HR Hazard Ratio
IRB Institutional Review Board
LCA Latent Class Analysis
NHANES National Health and Nutrition Examination Survey
NIEHS National Institute of Environmental Health Sciences
kg Kilograms
m Meters
mg Milligram
MEP monoethyl phthalate
MBzP monobenzyl phthalate
xii
OC Oral Contraceptive
OR Odds Ratio
1
CHAPTER 1: BACKGROUND
1.1. Breast Cancer Biology and Epidemiology
Breast cancer is the second leading cancer-related cause of death among women in the United States. Only lung cancer accounts for more cancer deaths in women [1, 2]. The American Cancer Society estimates that in 2014 there were approximately 232,670 new cases of invasive breast cancer diagnosed and approximately 40,000 breast cancer-caused deaths [2].
1.1.1. Genetic Risk Factors
It is estimated that 5% to 10% of breast cancer cases are hereditary [3, 4]. Among hereditary breast cancers, 20 to 25% are accounted for by high penetrance BRCA1 and BRCA2 gene mutations [5, 6]. These gene mutations are associated with a 10-fold increase in breast cancer risk but are rare [7]. Intermediate-penetrance genetic mutations in genes involved in DNA repair such as ATM, CHEK2, BRIP1, and PALB2 increase breast cancer risk about 2- to 3-fold [8]. Low-penetrance, common single nucleotide polymorphisms (SNPs) are associated with low personal risk of breast cancer but are prevalent enough in the population to be significant on a public health level (e.g. SNPs found in FGFR2, TNRC9, MAP3K1, or LSP1) [8-10].
2
4-fold. However, the vast majority of women diagnosed with breast cancer, over 85%, do not have a family history [9, 12].
1.1.2. Established Non-Genetic Risk Factors
Established non-genetic risk factors for breast cancer include age, reproductive history (e.g., late age at first birth, nulliparity or low parity, late menopause, early menarche, and little or no lactation), hormone replacement therapy use and recent oral contraceptive use, higher adult body mass index (BMI), and alcohol consumption. The evidence for each of these associations is summarized below.
Age
Breast cancer risk increases significantly with age. As a person grows older, tissue accumulates they experience more opportunities or genetic damage (e.g., mutations) in their bod. According to data from the Surveillance, Epidemiology, and End Results (SEER) Program [13], rates of breast cancer are lowest in women under 40 years. Rates begin to increase after age 40 and are highest in women over age 70 [2]. Between 2006 and 2010, 79% of new cases and 88% of breast cancer deaths occurred in women 50 years of age and older; the median age at the time of breast cancer diagnosis was 61 years [2, 13].Breast cancer incidence among women ages 80 to 85 years old is 15 times higher than in women ages 30 to 35 years old [14]. Women who are diagnosed with breast cancer at a younger age (≤35-40 years) are more likely to have more aggressive breast cancers that are related to BRCA1 or BRCA2 gene mutations [15].
Race and Ethnicity
3
African American women have higher incidence before age 40 and have higher prevalence of basal-like breast cancers [17, 18]. African American women are also more likely to die from breast cancer than white women [19]. Hispanic women have lower incidence rates and lower mortality rates than white women and African American women [2]. Asian/Pacific Islander women have the lowest incidence and mortality rates [20]. The reasons for ethnic disparities are not entirely clear, but likely reflect diet, lifestyle, and access to medical care [21].
Reproductive Risk and Protective Factors
Risk of developing breast cancer is strongly linked to reproductive factors, which characterize exposure to sex hormones. Many reproductive risk factors are associated with exposure to estradiol, progesterone, systemic circulating estrogen levels, and other hormones [22, 23]. Reviews of the epidemiologic literature have reported that that early menarche (before age 12), late menopause (after age 55), low parity, late age at first birth (after age 30), and shorter duration of breastfeeding (less than 12 months) are associated with an increased risk of breast cancer [24, 25]. Women who experience risk factors such as early menarche and late menopause may have an increased risk of breast cancer due to a longer lifetime exposure to the hormones estrogen and progesterone [26]. The literature also suggests that the protective effect of earlier first full-term pregnancy and longer duration of breastfeeding may result from the reduced effect of circulating hormones on breast tissue after pregnancy [25] and reduction of a woman's total number of lifetime menstrual cycles [2]. However, reproductive factors have many different effects on biology and lifestyle and therefore the mechanisms are complex and remain uncertain.
Oral Contraceptives and Post-menopausal Hormone Replacement Therapy
4
associated with increased breast cancer risk in current and recent users; however the effect diminishes 10 years after stopping use [27]. The use of HRT (estrogen-progesterone) is
associated with increased breast cancer risk among post-menopausal women; however the effect diminishes 5 years after cessation of use [28]. A pooled analysis of 51 epidemiologic studies of around 54,000 postmenopausal women [28] reported that the relative risk of breast cancer diagnosis increased in relation to duration of HRT use (2.3% per year; 95% CI: 1.1, 3.5%). Among current or recent users, defined as use within the past 5 years, who had used HRT for 5 or more years, the relative risk of breast cancer was 1.35 (95% CI: 1.21, 1.49). However past users (>5 years since cessation of HRT use) had no significant increase in relative risk of breast cancer that was related to duration of use [28].
Alcohol
Consumption of alcoholic beverages is a well-established risk factor for breast cancer [29]. Meta-analyses report that women who consume one alcohol beverage per day have an increased risk, between 7% and 12%, of breast cancer when compared to non-drinkers [30-32]. Compared with non-drinkers, light drinkers (up to one drink per day, 1.5 units) have a smaller increased risk (5%) [32]. Women who have 2 to 5 drinks a day are 1.5 times more likely to develop breast cancer than non-drinkers [33]. This association may be modified by hormone receptor expression: ethanol and acetaldehyde interfere with estrogen pathways and may trigger the expression of hormone receptors (e.g., estrogen) in breast tumors [34, 35]. However, other mechanisms have also been proposed; alcohol consumption is associated with genetic
5
Bodyweight
Overweight and obesity, as measured by high body mass index (BMI), moderately increases the risk of breast cancer in postmenopausal women. However obesity is negatively associated with pre-menopausal breast cancer risk [38, 39].The increase in breast cancer risk with increasing BMI among post-menopausal women is largely the result of the associated increase in estrogens [40]. A meta-analysis of 13 studies of post-menopausal women reported that circulating concentrations of sex hormones (e.g., estrogens) were higher in obese women than in women with lower BMI [41]. Higher BMI usually means increased adipose tissue which produces aromatase, an enzyme responsible for a key step in biosynthesis of estrogens [42]. This increased total aromatase activity along with high estrogen levels may explain the increased risk of breast cancer among obese post-menopausal women compared to non-obese post-menopausal women [23, 40, 41, 43]. However, obesity also has effects on many different biological
processes, including systemic and local inflammation [44], so mechanisms of obesity are complex.
Geographic Location
6
women [16]. Death rates from breast cancer are highest in the South, followed by the Midwest, Northeast and West [45].
1.1.3. Non-established Non-Genetic Risk Factors
Tobacco Smoke
The relationship between cigarette smoking and breast cancer risk is unclear. Despite extensive research on smoking and breast cancer there is no scientific consensus, partly because of concern that the association may be confounded by alcohol consumption [46] and because studies have not consistently shown an increase in risk with duration or intensity of smoking [47]. Some studies suggest current smoking to be linked to increased risk of breast cancer through DNA damage mechanisms [48]. However there is also evidence that smoking may decrease ovarian function and therefore endogenous exposure to estrogen, with a resulting protective effect on breast cancer [49]. A meta-analysis of cohort studies and an original cohort analysis on active smoking and breast cancer risk reported increased risk among current smokers, especially when smoking begins at an early age [50]. Data from the Nurses’ Health Study
suggests that active smoking, especially before the age of 20 or before first birth, may be
associated with a modest increase in breast cancer risk. The risk increase for current smokers and former compared to never-smokers was approximately 12% and 9%, respectively [51]. Data from the Women’s Health Initiative reported evidence of an association between active and passive smoking and breast cancer risk among postmenopausal women [52].
1.2. Environmental Exposures and Breast Cancer
Breast cancer is a very complex disease because both genetic and environmental factors contribute to its etiology [53]. Environmental exposures, defined in this proposal as
7
epidemiologic studies have reported inconsistent or null results [55-57]. Organochlorines are a diverse group of synthetic chemicals that have been widely studied. This group of chemicals includes polychlorinated biphenyls (PCBs), dioxins, and organochlorine pesticides such as dichlorodiphenyl-trichloroethane (DDT), lindane, and hexachlorobenzene. Though use of DDT and PCBs has been banned in the United States since the 1970s, some organochlorine
compounds have continued to accumulate and persist in the environment and have been
measured in human tissues. Laboratory research provides evidence that a number of persistent organochlorine compounds (e.g., PCBs and DDT) exhibit varying estrogenic and anti-estrogenic activity in biological assays [58]. These compounds can affect the body’s estrogen production and metabolism and may contribute to breast cancer risk by damaging DNA, disrupting hormones, promoting tumor growth, or increasing susceptibility by altering mammary gland development [59-61]. The majority of epidemiologic studies studying these chemicals have reported null associations [62], including large prospective cohort studies [63-65], a large case-control study [66] and a meta-analysis of 22 epidemiologic studies [56]. It has been suggested that the null association between organochlorine compounds and breast cancer may reflect a true lack of association or to shared methodological weakness across a large number of studies [67].
8
as occupational exposures, electromagnetic fields, light at night, solar radiation, and some environmental chemicals have been indicated by some studies, but the results have been inconclusive [55, 61, 72, 73].
1.3. Methodological Issues
Examining environmental exposures and breast cancer risk in the general population is challenging given a number of methodological issues: exposures are often poorly quantified; it is difficult to find an unexposed group because many environmental contaminants are ubiquitous in the environment; the range of measured exposures may be narrow (with few or no unexposed or highly exposed); small hypothesized relative risks require very large studies for sufficient statistical power; and the timing of measurement may not be etiologically relevant [67, 71]. Exposure measurements made near the time of diagnosis or interview may not represent the appropriate empirical induction period between exposure and development of breast cancer. Latency periods of 8 to 15 years have been reported for breast cancer [67, 74-76]. Therefore, if an environmental exposure were related to breast cancer, empirical induction periods could be at least one to two decades [67]. Another common concern regarding exposure measurement comes from self-report observational studies. Self-reported exposures are subject to multiple sources of error (e.g., recall bias) resulting in misclassification. If the resulting misclassification is non-differential, a small, real effect may not be detected. Therefore another challenge is having a large enough study to have sufficient statistical power [67, 71].
9
environmental exposures are also often associated with small hypothesized relative risks that are difficult to assess statistically in small studies. With the exception of major releases of
contaminants due to an industrial accidents or atomic bomb, environmental exposure is challenging to study in the general population [71].
1.4. Personal Care Product Sources and Exposure
The average American woman uses 12 personal care products a day, resulting in daily exposure to an estimated 126 unique chemicals [77]. Because certain chemicals in personal care products are suspected endocrine disrupters (e.g., phthalates, parabens, triclosan) [78, 79], there is concern that exposure to personal care products may be associated with risk of breast cancer and/or may have adverse reproductive health effects. In vitro and animal studies have
demonstrated that endocrine disrupting chemicals can mimic estrogens [73], alter hormonal signaling, affect developing reproductive systems [80], and/or disrupt normal mammary development [81].However, there is currently no definitive evidence for the same effects in humans [82-85].
10
computational models of predicted exposure. To address the limitations in experimental animal studies and capture the exposure characteristics in human populations, human studies are needed.
Some key challenges have impeded progress in understanding the relationship between personal care product use and health outcomes in humans. First, publically available data on personal care product usage patterns in the United States typically lack large sample populations or include only specific types of product users [88, 89 , 90, 91]. Currently the only population-based studies of personal care product use that have a comparison group of infrequent personal care product users are limited to other countries [92, 93], or small populations within the United States [94]. Second, studies that have collected data on product use have described correlations between use patterns for only a limited numbers of products. Third, studies to date have not placed the personal care product exposures in context of other exposures, particularly those in relevant biological pathways.
1.5. Data Collection in Epidemiological Studies
Wu et al [94] used a telephone interview to collect information on the frequency of use of ~30 types of personal care products from 604 Californian participants. Participants were
recruited in three age groups: children, their parents, and adults age 55 years or older. Manová et al [93] used a postal questionnaire survey to examine patterns of personal care product use in three Western European countries: Switzerland, Germany, and the Netherlands. A
11
in the Netherlands [92]. In the sections that follow, the main findings from these three studies are summarized.
Prevalence
Lotion/cream products had the overall highest prevalence of use. Manová et al [93] reported that among adult females the prevalence of use was highest for face lotion (95.9%) and hand lotion (95.3%). Biesterbos et al [92] reported that a high percentage of respondents (70-95%) used a combination of two skin care products (e.g., day cream and night cream). A majority of users (>50%) indicated that they used deodorant, day cream, night cream, make-up remover, mascara, eye pencil and eye brow pencil once a day [92]. The California study [94] found that the different hygiene products (e.g., body lotion and hand lotion, shampoo and conditioner) were strongly correlated with each other. The use of different skincare products were moderately correlated with each other and the use of some cosmetics were correlated (e.g., foundation and mascara were correlated). Foundation and mascara were also correlated with hair styling and face cleaning products [94]. In all three studies personal care product use patterns varied by socio-demographic factors including age, race, education [92-94] and by climatic region in the California study (e.g., northern vs. southern California) [94].
Age/Region
12
and sunscreen [93]. Female participants in the oldest age group, 66 years and older, had the highest prevalence of lipstick use (72.6%).
Race/Ethnicity
According to a study in California [94] race/ethnicity was an important factor among younger women in determining personal care products use. Compared to younger non-Hispanic white women, younger African American women were more likely to have their hair treated permanently (including chemical straightening or relaxing). However this study was based on a very small number of African American women (N=10) compared to non-Hispanic white women (N=206) so comparison may be subject to small sample biases [94]. An analysis of 2,540
samples collected from participants of the National Health and Nutrition Examination Survey 1999-2000 found that African American women had higher urinary levels of monoethyl phthalate, a phthalate found in personal care products, compared to non-Hispanic white women[84]. The authors speculated that these differences are likely due to differences in hair texture and cultural practices [94].
The European studies did not specify race/ethnicity, however participants from
13
Education
In the US, educational attainment influenced choices of products, particularly for
products where awareness of a healthy lifestyle could be considered a factor (e.g., more frequent use of sunscreen) or where higher income might play a role (e.g., more use of professional services for nails) [94]. Manová et al [93] reported that education had an influence on the prevalence of use of body lotion, hand cream, makeup foundation, lipstick, and sunscreen. The prevalence of use of body lotion and hand cream decreased as education increased and the prevalence of sunscreen use increased as education increased.The largest proportion of
sunscreen users were university graduates (92.4%). For cosmetics (i.e., makeup foundation and lipstick) the prevalence of use was highest among the participants who completed the European equivalent of high-school [93].
Patterns of Co-use
Manová et al [93] reported that most (64.8%) adult females reported using two or more personal care products concurrently and regularly. The most common combination of products that adult females used was sunscreen, face cream, and body lotion. A similar pattern was reported in the U.S. Wu et al. [94] found moderately positive correlations between the use of face moisturizer and body lotion among California residents. In the Netherlands, Biesterbos et al.[92] also reported co-use of products. Most products within the hair care, skin care, or cosmetic product groups were correlated. Day cream was often used by the same people who used night cream (kappa=0.49) and the use of powder was likely among people who used foundation (kappa=0.67). Among those who applied nail polish, 93% also used nail polish remover (kappa=0.95), 82.5% of all users who applied eye shadow also used mascara
14
For example, out of 499 respondents who use shampoo, only 173 used conditioner as well (kappa=0.03) [92].
Currently, there are no studies that have examined a large, diverse sample population to evaluate exposure patterns for a wide range of personal care products. In addition, the previous studies used Cohen’s Kappa coefficients and Spearman correlation coefficient to describe patterns of co-use. To advance public health knowledge about the health effects of personal care product use, there is a need to more comprehensively describe patterns of use.
1.6. Personal Care Products and Breast Cancer
There is concern that use of personal care products may be associated with breast cancer risk [67]. It has been hypothesized that chemicals in personal care products (e.g., parabens and phthalates) may act as endocrine disrupting chemicals (EDCs) [79, 97] possibly mimicking the effects of carcinogenic effects of estrogenic exposures [98, 99]. In vitro and animal studies have demonstrated that these chemicals can mimic estrogens [73], alter hormonal signaling, affect developing reproductive systems [80], and/or disrupt normal mammary development [81]. However, there is currently no definitive evidence for the same effects in humans [82-85]. There have been studies showing associations between personal care product use and increased
15
Very few studies have evaluated risk of breast cancer in association with components of personal care products or individual products and those studies have not strongly supported increasing risk of breast cancer in association with personal care product use in humans [102]. A possible relationship between phthalate exposure and breast cancer has been investigated in several studies but has yielded mixed results. A population based case-control study of women residing in northern Mexico, with 233 histopathologically confirmedbreast cancer cases and 221 age-matched controls studied exposure to several phthalates found in a wide range of personal care products. This studyreported thaturinary concentrations of monobenzyl phthalate (MBzP) and mono (3-carboxypropyl) phthalate (MCPP)) were negatively associated with breast cancer (MBzP: OR= 0.46, 95% CI: 0.27–0.79; MCPP: OR= 0.44, 95% CI:0.24–0.80). However, MEP and mono-2-ethyl-5-carboxypentyl phthalate (MECPP), a metabolite of DEHP, were
significantly associated with increased breast cancer risk (MEP: OR =2.20, 95% CI: 1.33–3.63; MECPP: OR=1.68, 95% CI: 1.01–2.78) [102]. The odds ratio for MECPP was weak and borderline significant and other metabolites of DEHP were not significantly different between cases and controls [102].
16
reported using underarm deodorant or antiperspirant [89]. A 2003 retrospective case-only study of 437 females diagnosed with breast cancer reported that age of breast cancer diagnosis was significantly earlier in women who used deodorant/antiperspirant more frequently [90]. In 2006, a study of hospital patients in Iraq compared 54 women with breast cancer and 50 women without breast cancer; they reported no association between antiperspirant use and the risk of breast cancer [88].
Personal use of hair dye and breast cancer risk has been widely studied. Meta-analyses of hair dye products conclude that there is no consistent evidence for these products increasing breast cancer risk [91, 105]. A meta-analysis of 12 case-control studies and 2 cohort studies published between 1977 and 2002 that examined the association between hair dye and breast cancer concluded that use of hair dyes does not increase breast cancer risk in women [91]. However, some sub-populations with more exposure may be at increased risk [106]. A 2009 meta-analysis reported that compared to other occupations, hairdressers and salon workers have a slightly increased risk of breast cancer [106].
1.7. Conclusions
17
effects of any single exposure. To better characterize patterns of personal care product use and the risk associated with usage, this project will use detailed personal care product use
information, together with latent class analysis (LCA), to create latent classes that describe exposure to broad patterns of personal care product use. LCA can be used to address these limitations by identifying latent classes which describe variability among multiple, correlated, and observed variables [107 714].
18
CHAPTER 2: METHODS
2.1. Specific Aims and Hypotheses
Specific Aim 1. Objective: Identify groups of personal care product users among United
States women and describe the prevalence of these product use subgroups within strata defined by race/ethnicity.Hypothesis: There are latent classes of personal care product use that vary according to race/ethnicity. Approach: Using data from the NIEHS Sister Study’s Personal Care Questionnaire, latent class analysis (LCA), a data reduction tool, will be used to identify classes of personal care product users based on broad patterns of exposure. Latent classes will be constructed for three product categories: (1) beauty products, (2) hair products, and (3) skincare products. Characteristics of participants will be described by race/ethnicity.
Specific Aim 2. Objective: Estimate the association between personal care product
latent class membership and breast cancer risk factors.Hypothesis: Personal care product varies according to known and suspected breast cancer risk factors. Approach: Stratified logistic regression will be used to estimate prevalence differences (PDs) and 95% confidence intervals (CIs) to examine the association between personal care product latent class (Aim 1) and breast cancer risk factors among women in the Sister Study. These risk factors include age, age at menarche, parity, age at first pregnancy, duration of breastfeeding, OC or HRT use, adult BMI, smoking, alcohol use, geographic region, education, and family history.
19
cancer risk in multivariable models. Approach: We will use Cox proportional hazards regression to estimate breast cancer risk in association with personal care product latent classes defined in Aim 1, adjusting for confounders and stratifying by race/ethnicity.
2.2. Study Design
2.2.1. NIEHS Sister Study
The Sister Study is a large prospective cohort study directed at identifying environmental and genetic risk factors for breast cancer. The study consists of 50,884 women who had at least one sister diagnosed with breast cancer but were cancer-free themselves at time of enrollment. Study enrollment began in 2003 and ended in 2009; eligible women were 35-74 years of age. Participants were recruited nationally through health professionals, breast cancer advocates, the Internet, trained recruitment volunteers, and a national advertising campaign. Baseline
enrollment activities included a computer-assisted telephone interview and self-administered questionnaires that collected information about environmental and genetic risk factors for breast cancer. The Sister Study was approved by the institutional review boards at the National Institute of Environmental Health Sciences and Copernicus Group. Written informed consent was
provided by study participants. The present analysis was limited to non-Hispanic white
(n=42,558, 84% of participants) and non-Hispanic black (n=4,462, 9% of participants) women; there were too few Hispanic (5%) and Other (3%) participants to include in this analysis.
2.2.2. Data acquisition
20
2.3. Data Analysis
2.3.1. Exposure assessment and categorization
Detailed self-reported use of 48 personal care products was collected during the
baseline phase of the study (Table A.4). Frequency of use (5-level-response option) during the previous 12 months was reported. Because performing LCA of such a large data matrix (almost 50,000 participants, with 48 questions per participant and 5 response categories per question) is too computationally challenging for the SAS program PROC LCA, we employed a variety of data reduction steps. First, using histograms to examine the distribution of
exposure responses, we condensed the number of response categories from five into three (Table A.5). Second, we separated the different product types into three different product categories and separate latent classes were constructed for each category: (1) beauty products, (2) hair products, and (3) skincare products (Table A.5). Finally, to further reduce
dimensionality, and improve interpretability of the model we used a method based on Dean et al. [108] to select the variables that were most useful for distinguishing among latent classes (i.e., ≥10% difference in posterior probabilities between classes) (Table A.5). Variables that were determined not to contribute to the distinction between latent classes were removed from the model. Within each product category, latent classes were described and considered as exposure variables (Table 3.1).
2.3.2. Breast cancer assessment
Participants reported breast cancer diagnoses on annual and biennial health
21
breast cancers were reported during 299,689 person-years (average follow-up ~5.4 years). By the time of the present analysis, pathology reports or medical records had been obtained for >80% of these cases (n=1,923). Confirmation of self-reported breast cancer diagnoses by medical record was very high [positive predictive value (PPV)=99.5%] [110]. After medical record review, self-reported ER status information was confirmed for 99% of ER positive cases, and 85% of ER negative cases. Therefore, we used self-reported tumor.
2.3.3. Effect modification
22
2.3.4. Confounding
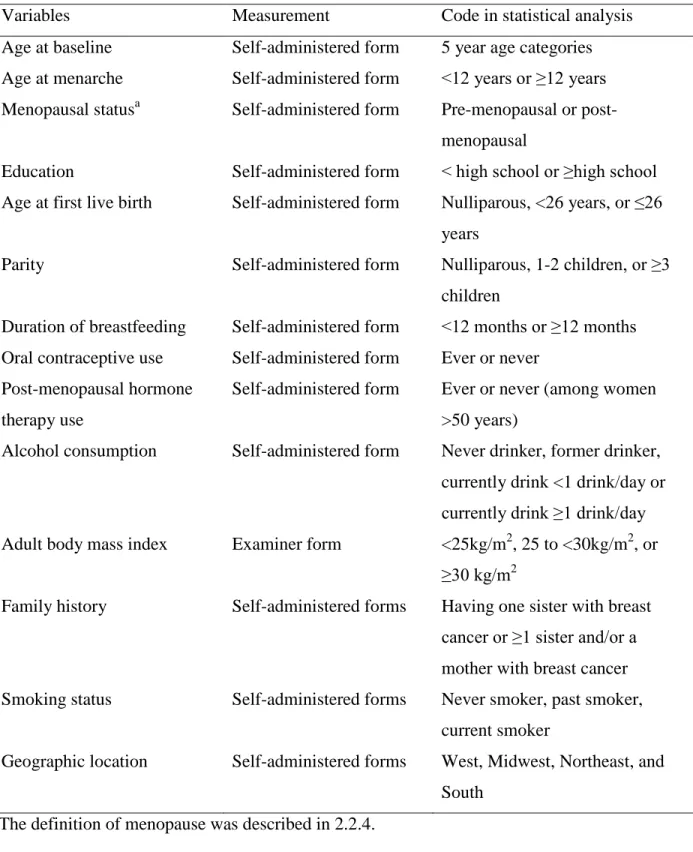
To identify possible confounders, we considered the association between latent classes and breast cancer risk factors (Table 2.1). The following covariates, measured at baseline, were included in adjusted models: menopausal status (pre-menopausal or post-menopausal), education (< high school or ≥high school),age at first birth (nulliparous, <26 years, or ≤26 years), parity (nulliparous, 1-2 children, or ≥3 children) , duration of breastfeeding (<12 months or ≥12 months), oral contraceptive (OC) use (ever or never), post-menopausal hormone therapy (HT) use among women >50 years (ever or never), alcohol consumption (never drinker, former drinker, currently drink <1 drink/day or currently drink ≥1 drink/day), adult body mass index (BMI) (<25kg/m2, 25 to <30kg/m2, or ≥30 kg/m2), family history (having one sister with breast cancer or ≥1 sister and/or a mother with breast cancer), smoking status (never smoker, past smoker, current smoker), and age at menarche (<12 years or ≥12 years), and region (West, South, North, East). In sensitivity analyses, models were stratified by ER status and breast cancer subtype. More details on measurement and definition of potential confounders are listed in Table 2.1.
2.3.5. Statistical methods
Latent classes
23
For each product category we fit a sequence of LCA models starting with two classes and increasing the number of classes for each model (up to six). To identify an optimal but minimal number of classes, Akaike’s information criterion (AIC), the Bayesian information criterion (BIC), and entropy were considered [107]. A smaller AIC and BIC and higher entropy for a particular model suggests a better model fit [107]. A summary of the fit statistics and entropy are shown inTable 3.1.The classes were described and labeled based on item-response probabilities [108] and ability to identify which variables were driving each class [107].
To assign participants class membership, we used a common classify-analyze approach referred to as the maximum-probability assignment rule, where individuals are assigned to the class in which they have the highest posterior probability of membership [111]. Item-response probabilities provided the basis on which each latent class was interpreted [112]. The correlation among use patterns for the three product types was evaluated by Spearman correlation
coefficients of the item response variables’ posterior probabilities.
Association between latent classes and potential confounders
Logistic regression stratified by race was used to estimate age-adjusted prevalence differences and 95% confidence intervals for potential confounders and latent class membership for the three different product categories (Table A.6). Covariates that were considered as
potential confounders are listed in Table 2.1.
Association between latent classes and breast cancer risk
Multivariable Cox proportional hazards models were used to estimate hazard ratios (HRs) and 95% confidence intervals (95% CIs) for the association between the personal care product latent classes and breast cancer risk. Statistical models used age as the time scale, where participants entered the analysis at their baseline age (left-truncation) and exited at their
24
25
Table 2.1. Measurement and definition of potential confounders
Variables Measurement Code in statistical analysis
Age at baseline Self-administered form 5 year age categories Age at menarche Self-administered form <12 years or ≥12 years Menopausal statusa Self-administered form Pre-menopausal or
post-menopausal
Education Self-administered form < high school or ≥high school Age at first live birth Self-administered form Nulliparous, <26 years, or ≤26
years
Parity Self-administered form Nulliparous, 1-2 children, or ≥3 children
Duration of breastfeeding Self-administered form <12 months or ≥12 months Oral contraceptive use Self-administered form Ever or never
Post-menopausal hormone therapy use
Self-administered form Ever or never (among women >50 years)
Alcohol consumption Self-administered form Never drinker, former drinker, currently drink <1 drink/day or currently drink ≥1 drink/day Adult body mass index Examiner form <25kg/m2, 25 to <30kg/m2, or
≥30 kg/m2
Family history Self-administered forms Having one sister with breast cancer or ≥1 sister and/or a mother with breast cancer Smoking status Self-administered forms Never smoker, past smoker,
current smoker
Geographic location Self-administered forms West, Midwest, Northeast, and South
a
26
CHAPTER 3: ASSOCIATIONS AMONG PERSONAL CARE PRODUCT USE PATTERNS AND EXOGENOUS HORMONE USE IN THE SISTER STUDY
3.1. Overview
Background: It is hypothesized that certain chemicals in personal care products may alter risk of adverse health outcomes. The primary aim of this study was to use a data-centered approach to classify complex patterns of exposure to personal care products and to understand how these patterns vary according to use of exogenous hormone exposures, oral contraceptives (OCs) and postmenopausal hormone therapy (HT).
Methods: The NIEHS Sister Study is a prospective cohort study of 50,884 U.S. women.
Limiting the sample to non-Hispanic blacks and whites (N=47,019), latent class analysis (LCA) was used to identify groups of individuals with similar patterns of personal care product use based on responses to survey questions. Personal care products were categorized into three product types (beauty, hair, and skincare products) and separate latent classes were constructed for each type. Adjusted prevalence differences (PD) were calculated to estimate the association between exogenous hormone use, as measured by ever/never OC or HT use, and patterns of personal care product use.
Results: Latent class analysis (LCA) was used to reduce data dimensionality across 48
27
exogenous hormone exposures were associated with higher levels of product use, especially beauty and skincare products.
Discussion: Relative to individual product use questions, latent class variables capture complex patterns of personal care product usage. These patterns differed by race and were associated with ever OC and HT use. Future studies should consider personal care product exposures with other exogenous exposures when modeling health risks.
3.2. Introduction
The average American woman uses 12 personal care products a day, resulting in daily exposure to an estimated 126 unique chemicals [77]. Because certain chemicals in personal care products are suspected endocrine disrupters (e.g., phthalates, parabens, triclosan) [78, 79], there is concern that exposure to personal care products may be associated with risk of breast cancer and/or may have adverse reproductive health effects. In vitro and animal studies have
demonstrated that endocrine disrupting chemicals can mimic estrogens [73], alter hormonal signaling, affect developing reproductive systems [80], and/or disrupt normal mammary development [81].However, there is currently no definitive evidence for the same effects in humans [82-85].
28
design more appropriate animal and in vitro studies of complex mixtures as well as validate computational models of predicted exposure. To address the limitations in experimental animal studies and capture the exposure characteristics in human populations, human studies are needed.
The objective of the current study was to use data from 47,019 women in the NIEHS Sister Study to characterize patterns of personal care product use across a wide range of
products. We hypothesized that individuals would be classifiable according to broad patterns of personal care product usage, with patterns differing by race. We also hypothesized that personal care product use would be correlated with other exposures, notably other exogenous estrogens (e.g., OC and HT use) potentially associated with disease risk. To test these hypotheses, we used latent class analysis (LCA) to identify groups of women by patterns of product use and compared these patterns with in terms of past exogenous estrogen use.
3.3. Methods
3.3.1. Study population
The Sister Study is a large prospective cohort study directed at identifying environmental and genetic risk factors for breast cancer. The study consists of 50,884 women who had at least one sister diagnosed with breast cancer but were cancer-free themselves at time of enrollment. Study enrollment began in 2003 and ended in 2009, and eligible women were 35-74 years of age. Baseline enrollment activities included a computer-assisted telephone interview and
29
women (Table 3.1); there were too few Hispanic (5%) and Other (3%) participants to include in this analysis.
3.3.2. Personal care product assessment
Detailed self-reported use of 48 personal care products (Table A.4) was collected during the baseline phase of the study by inquiring about frequency of use (5-level-response options) during the previous 12 months. The five response options varied according to intended use of the product. For example, the response options for a product intended to be used regularly (e.g., hand lotion) included: (1) did not use, (2) used less than once a month, (3) used 1-3 times per month, (4) 1-5 times per week, (5) more than 5 times per week. Response options for products that are used less often (e.g., hair dye) included : (1) did not use, (2) 1-2 times a year, (3) every 3-4 months, (4) every 5-8 weeks, (5) once a month or more. To identify latent classes of personal care product use, each of three product categories were analyzed separately to identify latent classes for each category: (1) beauty products (e.g., lipstick, mascara, nail polish), (2) hair products (e.g., hair spray, hair relaxers), and (3) skincare products (e.g. facial lotion, hand lotion).
3.3.3. Latent classes
30
model, and improve classification and precision we used a method based on Dean et al. [108] to select the variables that were most useful for distinguishing among latent classes (i.e., ≥10% difference in posterior probabilities between classes). Variables that were determined not to contribute to the distinction between latent classes were removed from the model.
We fit a sequence of LCA models starting with two classes and increasing the number of classes for each model (up to six). To identify an optimal but minimal number of classes,
Akaike’s information criterion (AIC), the Bayesian information criterion (BIC), and entropy were considered [107]. A smaller AIC and BIC and higher entropy for a particular model suggests a better model fit [107]. A summary of the fit statistics and entropy are shown inTable 3.2. The classes were described and labeled based on item-response probabilities [108] and ability to identify which variables were driving each class [107].
To assign participants class membership, we used a common classify-analyze approach referred to as the maximum-probability assignment rule, where individuals are assigned to the class in which they have the highest posterior probability of membership [111]. Item-response probabilities provided the basis on which each latent class was interpreted [112]. The correlation among use patterns for the three product categories was evaluated by Spearman correlation coefficients of the item response variables’ posterior probabilities.
3.3.4. Statistical analysis describing association between personal product use and
exogenous hormone use
31
latent class membership for the three different product types. We considered education as a covariate but did not include it in the final model because it did not substantially change the age-adjusted associations.
3.4. Results
3.4.1. Latent class descriptions
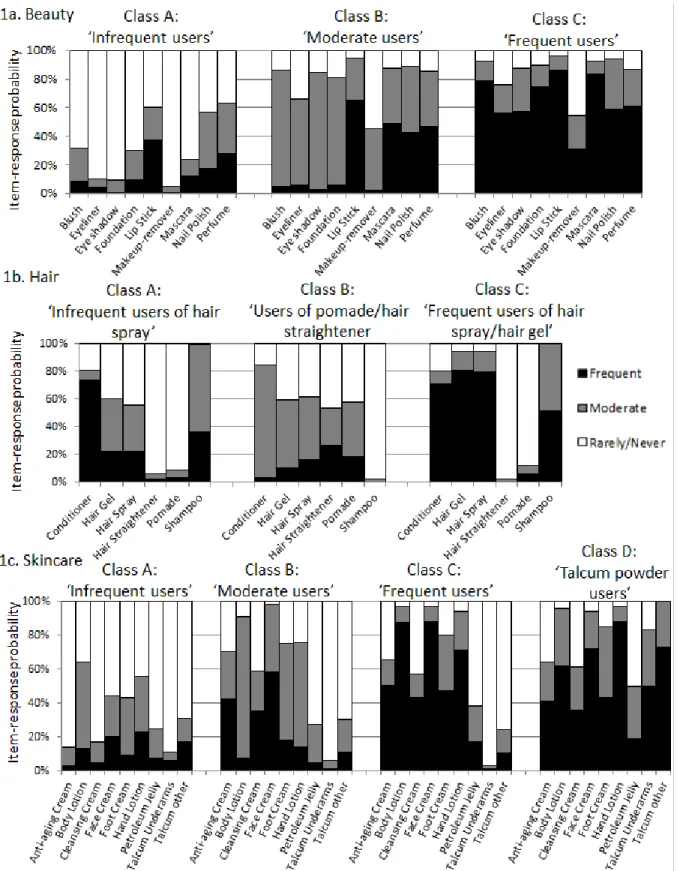
Based on fit statistics and parsimony (Table 3.2), three latent classes were identified as optimal for both the beauty and hair product groups; the skincare product group had four classes. Figure 3.1 indicates the specific personal care products and the item response probabilities for each product. Analysis of fourteen initial beauty product usage items resulted in three latent classes (infrequent users; moderate users; frequent users) with nine contributing product items: mascara, lipstick, foundation, nail polish, perfume, eye shadow, eye liner, blush, and makeup remover (Figure 3.1, Table 3.4). Analysis of fifteen hair product usage items resulted in three latent classes (infrequent users of hair products other than shampoo/conditioner; users of pomade and hair straightener; Frequent users of hair spray/hair gel) with six contributing product items: pomade, hair straightener, conditioner, hair spray, hair gel, and shampoo.Finally, analysis of nineteen skincare product usage items resulted in four latent classes (infrequent users; moderate users; frequent users; talcum powder users) with nine contributing product items: cleansing cream, anti-aging cream, body lotion, hand lotion, face cream, foot cream, petroleum jelly, talcum powder applied under arms, and talcum powder applied elsewhere. Short descriptions of the classes were created based on the item-response probabilities.
3.4.2. Product use patterns by race
32
classes; only 3% of white women were in the “users of pomade and hair straightener” group, while over two-thirds (67%) of black women were. There were also some differences in beauty product classes: white women were more frequent users than black women. The frequent lotion user category was the most common skin care class among both black and white women users (Table 3.3). Because of racial differences in population distribution across product classes, we report results separately by race in the subsequent analyses.
3.4.3. Patterns of class membership across product categories (beauty, hair, skin)
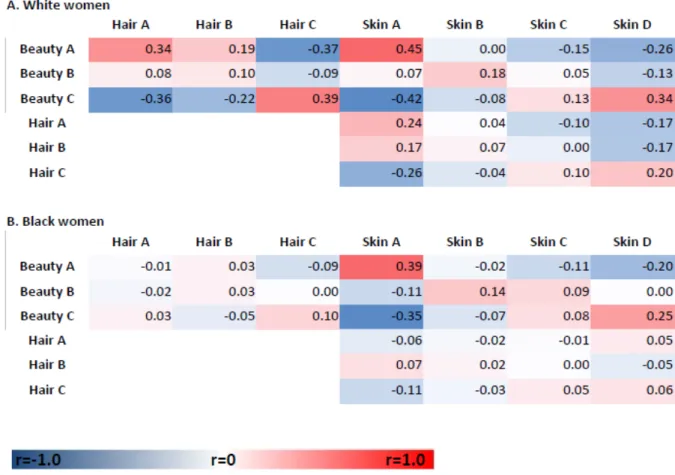
After considering the three different categories of personal care products in separate classification schemas, we also evaluated whether product usage class in one category (e.g. hair products) predicted use in another category (e.g. beauty products). As shown in Figure 3.2, the product categories for whites tended to be correlated, i.e., frequent users of one product category tended to be frequent users of the other product categories, but correlation coefficients were modest. The highest correlation of posterior probabilities of class membership was between infrequent users of beauty and skincare products (r=0.45). The next strongest correlations were between frequent beauty product users and frequent users in both the hair (r=0.39) and skincare (r=0.34) categories. For black women the correlations among usage patterns for the different product categories were low except for skin and beauty (r=0.39).
3.4.4. Exogenous hormonal exposures and product use
33
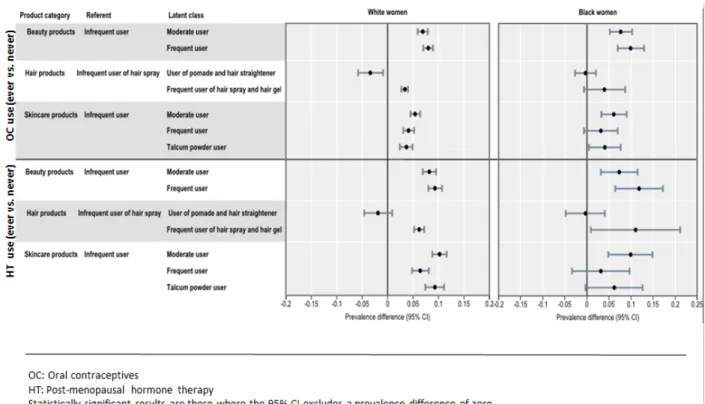
differences in prevalence of ever using OCs for “moderate” users and “frequent” users was 7% and 8%, respectively. Among black women, compared to “infrequent users”, the age-adjusted prevalence differences of ever using OCs were 8% for “moderate” users and 10% for “frequent” users of beauty products. White women over age 50 who were “moderate” users and “talcum powder” users were more likely to have ever used HT compared to “infrequent” users of skincare products; the age-adjusted difference in prevalence of ever receiving HTs for “moderate” users and “talcum powder” users was 12% and 11%, respectively. Among black women, the age-adjusted difference in prevalence of ever using HTs for “moderate” users compared to “infrequent” users of skincare products was 10%.
3.5. Discussion
We found that use of LCA could identify a relatively small number of subgroups of women with distinct personal care product use and that personal care product use varied by race. We also showed that the women with the highest use of personal care products are more likely to have used the common exogenous hormone medications, OC or HT. Previous studies have examined correlation structure between specific personal care products [92-94], but such studies were not aimed at reducing the complexity of individual product usage patterns, nor did these studies evaluate associations between personal care product use and other exposures.
34
States [94]. Second, studies that have collected data on product use have described correlations between use patterns for only a limited numbers of products. Third, studies to date have not placed the personal care product exposures in context of other exposures, particularly those in relevant biological pathways.
Our analysis addresses some of these challenges. First, we used a large, nationwide study of personal care product use and other environmental exposures to study patterns of exposure. Second, we took a broad approach to characterizing exposure, incorporating information on 24 different personal care products included in the Sister Study’s personal care questionnaire. Finally, we used LCA to identify exposure patterns in the context of other, relevant exposures. However, with currently available data we cannot specify a commonality of chemical exposures, only a commonality of which products tend to be used together by different groups of women. Information about specific chemicals or ingredients in personal care products was not captured in the questionnaire.
35
Our results were consistent with some previous studies. We observed race-related patterns of hair product use similar to those observed in previous smaller studies [84, 95, 115, 116]. The class that was characterized by use of pomade and hair straightener contained the majority of black women, but only 3% of white women. In a small study with ten black and 206 white participants from California [94] African American women were more likely to have their hair treated permanently (including chemical straightening or relaxing). Although the National Health and Nutrition Examination Survey (NHANES) 1999-2000 did not collect questionnaire information on frequency of product use, a NHANES analysis of 2,540 participant samples found that compared to non-Hispanic white women, African American women had higher urinary levels of monoethyl phthalate, a phthalate found in personal care products [84]. The authors of the NHANES suggest that these differences were likely due to differences in hair texture and cultural practices. While our analyses did not link product exposure with specific internal dose markers, future application of LCA approaches, or the patterns identified here, could be used to link specific exposure biomarkers with self-reported exposure information.
36
Our analysis has several key strengths. LCA provides an objective method of
distinguishing between groups of women on the basis of their patterns of personal care product use and, thus, potential chemical exposures. The number of latent classes is determined, in part, by data-based metrics, and is small relative to the number of product use items. The component product-use probabilities are complex and objectively discerning overall product-use data from casual inspection would be difficult. The NIEHS Sister Study provided a large dataset for this purpose.
LCA provides an objective means of reducing data dimensionality; however, there are some limitations. For example, the classes can be difficult to interpret. Labels were assigned to different classes based on our observation and interpretation of the probability based weights for class membership. Although there is some subjectivity in choosing the shorthand label
descriptors for different classes, the precise item response probabilities are provided in
37
3.6. Conclusion
38
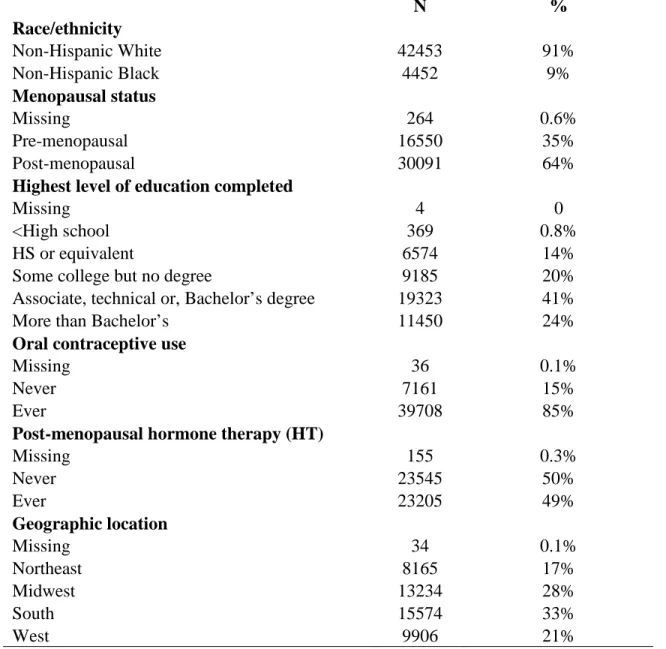
Table 3.1. Descriptive characteristics of sample population
N %
Race/ethnicity
Non-Hispanic White 42453 91%
Non-Hispanic Black 4452 9%
Menopausal status
Missing 264 0.6%
Pre-menopausal 16550 35%
Post-menopausal 30091 64%
Highest level of education completed
Missing 4 0
<High school 369 0.8%
HS or equivalent 6574 14%
Some college but no degree 9185 20%
Associate, technical or, Bachelor’s degree 19323 41%
More than Bachelor’s 11450 24%
Oral contraceptive use
Missing 36 0.1%
Never 7161 15%
Ever 39708 85%
Post-menopausal hormone therapy (HT)
Missing 155 0.3%
Never 23545 50%
Ever 23205 49%
Geographic location
Missing 34 0.1%
Northeast 8165 17%
Midwest 13234 28%
South 15574 33%
39 Table 3.2. Indicators of fit for latent class analysis
AIC BIC Entropy
Beauty classes
2 78666 78993 0.77
3 35717 36210 0.83
4 29716 30378 0.79
5 24355 25184 0.74
6 22393 23390 0.71
Hair classes
2 14239 14459 0.96
3 7936 8271 0.67
4 5237 5686 0.61
5 3416 3980 0.64
6 2046 2725 0.67
Skin classes
2 48055 48381 0.72
3 38337 38831 0.71
4 30150 30812 0.73
5 26769 27598 0.69
6 24092 25089 0.67
40 Table 3.3. Latent class distribution by race
Class descriptor White Black Total
N (%) N (%) N (%)
Beauty Products
Total 42558 4461 47019
Beauty A Infrequent users 9231 (22%) 1282 (29%) 10513 (22%) Beauty B Moderate users 16010 (38%) 2156 (48%) 18166 (39%)
Beauty C Frequent users 16762 (39%) 746 (17%) 17508 (37%)
Missing 555 (1%) 277 (6%) 832 (2%)
Hair Products
Total 42558 4461 47019
Hair A Infrequent users of hair spray
20950 (49%) 1011 (23%) 21961 (47%) Hair B Users of pomade and
hair straightener
1182 (3%) 2989 (67%) 4171 (9%) Hair C Frequent users of hair
spray and hair gel
19659 (46%) 173 (4%) 19832 (42%)
Missing 767 (2%) 288 (6%) 1055 (2%)
Skincare Products
Total 42558 4461 47019
Skin A Infrequent users 7954 (19%) 812 (18%) 8766 (19%)
Skin B Moderate users 18617 (44%) 2192 (49%) 20810 (44%)
Skin C Frequent users 10271 (24%) 551 (12%) 10822 (23%)
Skin D Talcum powder users 5158 (12%) 628 (14%) 5786 (12%)
41 Table 3.4. Latent class descriptions by product category
Category/class Label Description
Beauty product classes
A Infrequent users Infrequent use of eye shadow, eyeliner, mascara, foundation, and blush; relatively (to the other classes) infrequent use of make-up remover, perfume, and lipstick.
B Moderate users Intermediate use of eye shadow,
ner, mascara, foundation, blush, make-up over, perfume and lipstick (relative to the
r classes).
C Frequent users Frequent use of eye shadow, eyeliner,
mascara, foundation, blush, make-up remover, nail polish, and lipstick.
Hair product classes
A Infrequent users of hair spray
Relatively infrequent use of hair spray, hair gel compared to C (similar to class Hair-B); frequent use of shampoo, conditioner; infrequent use of pomade and hair straightener B Users of pomade and
hair straightener
Infrequent use of shampoo, hair gel;
intermediate use of pomade, hair straightener, and hair spray
C Frequent users of hair spray and hair gel
Frequent use of hair spray, hair gel, shampoo, conditioner; infrequent use of pomade and hair straightener
Skincare product classes
A Infrequent users Infrequent use of lotions, creams, talcum powder
B Moderate users Intermediate use of lotions, creams; infrequent use of talcum powder
C Frequent users Frequent use of face creams and lotions; infrequent use of talcum powder
42
43
Figure 3.2. Spearman correlation coefficients of posterior probabilities of latent class
44
45
CHAPTER 4: ASSOCIATION BETWEEN PERSONAL CARE PRODUCT USE PATTERNS AND BREAST CANCER RISK IN THE SISTER STUDY
4.1. Overview
Background: It is hypothesized that certain chemicals in personal care products may increase risk of breast cancer. The primary aim of this study was to evaluate whether patterns of beauty, hair, or skin-related personal care products, or individual products, were associated with breast cancer.
Methods: We evaluated data from non-Hispanic black and white women (N=46,905) in The Sister Study, a national prospective cohort study of breast cancer risk due to environmental and genetic exposures. Latent class analysis (LCA) was used to identify groups of individuals with similar patterns of personal care product use at cohort enrollment in 2003-2009. Multivariable Cox proportional hazards models were used to estimate hazard ratios (HRs) and 95% confidence intervals (CIs) for the association between product use and breast cancer risk.
46
Conclusions: This work generates novel hypotheses about personal care product use and breast cancer risk. Users of specific classes of personal care products appear to differ in their breast cancer risk. Whether these results are due to specific chemicals to other correlated behaviors needs to be evaluated.
Conclusions: Users of specific classes of personal care products appear to differ in their breast cancer risk. Whether this difference is due to specific chemicals in these products or to other correlated behaviors should be evaluated.
4.2. Introduction
There is concern that use of personal care products (e.g., cosmetics, lotions, and
fragrances) may be associated with breast cancer risk [67]. These products are a possible source of human exposure to endocrine disrupting chemicals, such as phthalates, parabens, and phenols [79, 97, 101, 120]. These chemicals have been linked to risk of reproductive and other
endocrine-related cancers [121-124], and have been hypothesized to mimic the carcinogenic effects of estrogenic exposures [98, 99].
Women are the primary consumers of many personal care products and are
47
phthalate metabolite concentrations [101]. However, few studies have evaluated the association between individual personal care products, or components of products, and breast cancer risk. Studies of deodorant/antiperspirant and hair dye have not strongly supported an association between personal care product use and increasing risk of breast cancer [88-91, 102, 105, 106].
However, a population based case-control study of women residing in northern Mexico, with 233
histopathologically confirmedbreast cancer cases and 221 age-matched controls, reported that
exposure to MEP may be associated with increased risk of breast cancer [102]. However, the same study also reported that exposure to other phthalates used in personal care products (i.e., monobenzyl phthalate (MBzP) and mono (3-carboxypropyl) phthalate (MCPP)) was inversely associated with breast cancer [102].
A challenge facing epidemiologic studies of personal care products lies in the fact that individual chemical exposures or personal care product usage may not capture overarching patterns of use across multiple products. We have previously observed that there are unique patterns of personal care product use, and these patterns were associated with breast cancer risk factors [127]. In this current work, we evaluated patterns of beauty, hair, and skin -related personal care product use in association with breast cancer risk.
4.3. Methods
4.3.1. Study Design and Population
48
that elicited information about environmental and reproductive exposures. The Sister Study was approved by the institutional review boards at the National Institute of Environmental Health Sciences and Copernicus Group. All study participants provided written informed consent.
4.3.2. Breast cancer ascertainment
Participants reported breast cancer diagnoses on annual and biennial health
questionnaires, or by calling the Sister Study helpline. Women who reported an incident breast cancer during follow-up were asked to authorize release of pertinent medical records. Response rates were >94% over follow-up [109]. Among participants in our sample population, 2,328 breast cancers were reported during 304,034 person-years (average follow-up ~5.4 years). By the time of the present analysis, pathology reports or medical records had been obtained for >80% of these cases (n=1,923). Confirmation of self-reported breast cancer diagnoses by medical record was very high [positive predictive value (PPV)=99.5%] [110]. After medical record review, self-reported ER status information was confirmed for 99% of ER positive cases, and 85% of ER negative cases. Because agreement between self-reported and medical abstracted data was high, we used self-reported tumor information when medical records were not available.
4.3.3. Personal care product exposure
49
difference in posterior probabilities between classes) Dean et al. [108]. Variables that did not contribute to the distinction between latent classes were removed from the model. Within each product category, latent classes were described and considered as exposure groups with the labels described in Table 1.
Starting with 48 individual personal care product use questions, we reduced data
dimensionality by identifying fourteen initial beauty product types. These were further reduced to nine contributing product items (Supplemental Table 1) and three latent classes. Analysis of fifteen hair product types was reduced to six contributing products and three latent classes. Finally, analysis of nineteen skincare product types was reduced to nine contributing products and four latent classes.
4.3.4. Statistical Analyses
The present analysis was limited to Hispanic white (n=42,453, 91%) and
non-Hispanic black (n=4,452, 9%) women (Table 2). Multivariable Cox proportional hazards models were used to estimate adjusted hazard ratios (adjHR) and 95% confidence intervals (CI) for the association between the personal care product latent classes and breast cancer risk. Statistical models used age as the time scale, where participants entered the analysis at their enrollment age (left-truncation) and accrued person-time until they exited at their cancer diagnosis or were administratively censored at their age at last follow-up. In analyses investigating associations by menopausal status at the time of breast cancer diagnosis, women who became postmenopausal during the follow-up period were censored at the time of menopause and the person-time that accumulated after menopause contributed to postmenopausal person-time at risk. The
50
All models were stratified by race. Women who reported that they had undergone natural menopause, hysterectomy, bilateral oophorectomy, irradiation to the ovaries, or otherwise
reported cessation of menstruation were classified as post-menopausal; women who reported that they were still cycling were classified as pre-menopausal. The following covariates, measured at baseline, were included in adjusted models: menopausal status at baseline (pre-menopausal or post-menopausal), age at menarche (<12 years or ≥12 years), age at first birth (nulliparous, <26 years, or ≥26 years), parity (nulliparous, 1-2 children, or ≥3 children) , duration of breastfeeding (<12 months or ≥12 months), oral contraceptive (OC) use (ever or never), post-menopausal hormone therapy (HT) use among women >50 years (ever or never), education (< high school or ≥high school),alcohol consumption (never drinker, former drinker, currently drink <1 drink/day or currently drink ≥1 drink/day), adult body mass index (BMI) (<25kg/m2
, 25 to <30kg/m2, or ≥30 kg/m2), family history (having one sister with breast cancer or ≥1 sister and/or a mother with breast cancer), smoking status (never smoker, former smoker, current smoker), and current region of residence (West, South, North, East). In sensitivity analyses among post-menopausal white women only, models were stratified by ER status (ER positive or ER negative according to the clinical record), and breast cancer type (in situ or invasive).
We also explored HRs for individual product types, using Bonferroni correction to adjust for multiple comparisons (p-value ≤ 0.001) . For all analyses, results are presented that included at least 20 exposed breast cancer cases. All analyses were performed using SAS statistical software (version 9.3; SAS Institute Inc, Cary, NC).
4.4. Results