Longitudinal identification of clinically distinct
neurophenotypes in young children with
fragile X syndrome
Jennifer L. Brunoa,1,2, David Romanoa,1,2, Paul Mazaikaa, Amy A. Lightbodya, Heather Cody Hazlettb, Joseph Pivenb,3, and Allan L. Reissa,c,d,3
aCenter for Interdisciplinary Brain Sciences Research, Department of Psychiatry and Behavioral Sciences, Stanford University, Stanford, CA 94305-5795; bCarolina Institute for Developmental Disabilities, University of North Carolina at Chapel Hill, Chapel Hill, NC 27599-2267;cDepartment of Radiology,
Stanford University, Stanford, CA 94305; anddDepartment of Pediatrics, Stanford University, Stanford, CA 94305
Edited by Marcus E. Raichle, Washington University in St. Louis, St. Louis, MO, and approved August 17, 2017 (received for review December 20, 2016)
Fragile X syndrome (FXS), due to mutations of theFMR1gene, is the most common known inherited cause of developmental dis-ability. The cognitive, behavioral, and neurological phenotypes observed in affected individuals can vary considerably, making it difficult to predict outcomes and determine the need for interven-tions. We sought to examine early structural brain growth as a potential marker for identification of clinically meaningful sub-groups. Participants included 42 very young boys with FXS who completed a T1-weighted anatomical MRI and cognitive/behavioral assessment at two longitudinal time points, with mean ages of 2.89 y and 4.91 y. Topological data analysis (TDA), an unsupervised approach to multivariate pattern analysis, was applied to the lon-gitudinal anatomical data to identify coherent but heretofore un-known subgroups. TDA revealed two large subgroups within the study population based solely on longitudinal MRI data. Post hoc comparisons of cognition, adaptive functioning, and autism sever-ity scores between these groups demonstrated that one group was consistently higher functioning on all measures at both time points, with pronounced and significant unidirectional differences (P<0.05 for time point 1 and/or time point 2 for each measure). These results support the existence of two longitudinally defined, neuroanatomically distinct, and clinically relevant phenotypes among boys with FXS. If confirmed by additional analyses, such information may be used to predict outcomes and guide design of targeted therapies. Furthermore, TDA of longitudinal anatomical MRI data may represent a useful method for reliably and objectively defin-ing subtypes within other neuropsychiatric disorders.
fragile X syndrome
|
autism spectrum behavior|
MRI|
multivariate pattern classification|
longitudinal developmentO
ver the past several decades, clinical neuroscience research has enhanced our understanding of the neurobiological and genetic bases for psychiatric disorders. This neurobiological and genetic information holds potential to inform disease-specific targeted interventions promising substantial improvement over current treatments (1). Fragile X syndrome (FXS) is the most common inherited cause for intellectual disability (2). The ge-netic etiology of FXS, a repeat expansion in the fragile X mental retardation-1 gene (FMR1) on the X chromosome, results in diminished levels of the fragile X mental retardation protein (FMRP), which plays an essential regulatory role in synaptic plasticity and dendritic pruning, processes critical for neuro-development (3). The known biological basis of FXS allows for investigation of cognitive and behavioral (e.g., autism) symptoms in an etiologically homogeneous genetic disorder (4).This well-characterized genetic disorder has also been the focus of targeted therapies aimed at correcting aberrant brain neurotransmitter systems such as up-regulation of metabotropic glutamate receptor 5 (mGluR5) signaling, which is disrupted in the Fmr1 knockout (KO) mouse model (5). Although several targeted therapies have demonstrated promising phenotype
rescue in animal models (6–8), they have been unsuccessful thus far in human trials (9). One potentially important factor to con-sider within this context is neurobiological heterogeneity within full mutation FXS. Identification of specific subtypes within this disorder may inform the design of targeted therapies and aid in the prediction and testing of response to these therapies.
Despite sharing similarFMR1 mutation genotypes, our pre-vious work suggests that there may be biologically defined sub-groups within boys with FXS, which exhibit clinically distinct behavioral profiles at a young age (mean=2.89 y). Specifically, classification based solely on anatomical MRI data revealed two large subgroups that differed in terms of neuroanatomical and cognitive/behavioral profiles (10). However, several important questions remain regarding development with respect to these subgroups. In particular, longitudinal research is critical in the case of FXS to increase our understanding of the developmental effects of FMRP on the brain (11). In the present study, we report results of a 2-y follow-up using longitudinal neuroimaging data and topological data analysis (TDA) to understand varia-tion in this well-characterized cohort of young boys with FXS. Specifically, we sought to understand if cognition and behavior developed differently depending on subgroup membership and if subgroup membership remained consistent over time.
Significance
We present a research study that uses early structural brain growth as a metric for defining subgroups within individuals with fragile X syndrome (FXS). Topological data analysis, a type of multivariate pattern classification, identified two large subgroups based solely on the longitudinal structural brain images. Post hoc analysis indicated significant, unidirectional differences in cogni-tion, adaptive functioning, and autism severity scores. Our results support the use of longitudinal topological data analysis (TDA) as a putative tool for differentiating individuals with FXS based on neuroanatomical data. This information may be used to predict outcomes and guide design of targeted therapies for individuals with FXS. Longitudinal TDA may be a useful analysis tool to ex-plore variation in other neuropsychiatric disorders.
Author contributions: D.R., H.C.H., J.P., and A.L.R. designed research; D.R. and A.A.L. performed research; J.L.B., D.R., P.M., and A.L.R. analyzed data; and J.L.B., D.R., P.M., A.A.L., H.C.H., J.P., and A.L.R. wrote the paper.
The authors declare no conflict of interest. This article is a PNAS Direct Submission.
1J.L.B. and D.R. contributed equally to this work.
2To whom correspondence may be addressed. Email: [email protected] or
3J.P. and A.L.R. contributed equally to this work.
This article contains supporting information online atwww.pnas.org/lookup/suppl/doi:10. 1073/pnas.1620994114/-/DCSupplemental.
NEUR
TDA is one of a general class of approaches to analyzing high-dimensional data known in the literature as multivariate pattern analysis (MVPA). Multivariate approaches are designed to de-tect effects that may be discernable within the relationships (patterns) among variables but which may elude detection when variables are examined in isolation. TDA is an unsupervised method of classification and it is used to identify coherent but potentially heretofore unknown groups within the study pop-ulation. Other examples of unsupervised approaches using MVPA include independent component analysis (12) and clustering via correlation matrices (13).
A distinct advantage of TDA is the resulting visual represen-tation called a Reeb graph. A Reeb graph is a compressed and easily readable visual representation of the data, which preserves its underlying geometric structure and facilitates identification of salient features (14). These features can encode not only in-formation about clusters that may exist within the data but also information about spectra (i.e., variation in the data due to un-derlying continuous parameters). Thus, TDA is“a methodology intermediate between modeling by algebraic equations, which is continuous but not very flexible, and cluster analysis, which is discrete and therefore misses continuous phenomena”(ref. 15, p. 109). Finally, another advantage of TDA is that it can be applied directly to very high-dimensional data and so is able to preserve finer characteristics of the population structure that may be obscured through the process of dimensionality reduction re-quired by other approaches to MVPA.
We hypothesized that TDA of longitudinal neuroimaging data would reveal clinically distinct subgroups similar to our cross-sectional analysis reported earlier (10). This hypothesis was tested by examining variables that were not included in the Reeb graph construction process. Specifically, we examined longitudinal changes in cognition and behavior within the groups defined by the TDA. We also examined neuroanatomical differences between the groups using a univariate analysis. Finally, we compared subgroup membership based on longitudinal analysis to subgroup member-ship based on the cross-sectional analysis previously reported (10). Participants included 52 boys with FXS who were part of an ongoing longitudinal brain imaging study (10, 11, 16–24). The mean age at enrollment was 2.89 y, SD = 0.63, and 41 of the original 52 individuals were followed up an average of 2.01 y later (SD=0.28). Demographic information is presented inTable S1.
Results
Multivariate Pattern Analysis.The primary outcome of the TDA is
a Reeb graph (Fig. 1) that displays connected nodes representing candidate subgroups within the data. Two large and distinct subgroups were present in the data: group A appearing on the left (n=13) and group B on the right (n=24). There are also three small, disconnected nodes (two containing a single par-ticipant each, one green and one purple, and one containing two participants, in yellow). Due to the limited sample size in these smaller groups, remaining analyses focus on the two larger groups, A and B. Cognitive and behavioral scores are presented for individuals in the smaller groups inTable S2.
Cognitive/Behavioral Results. There were no differences in age
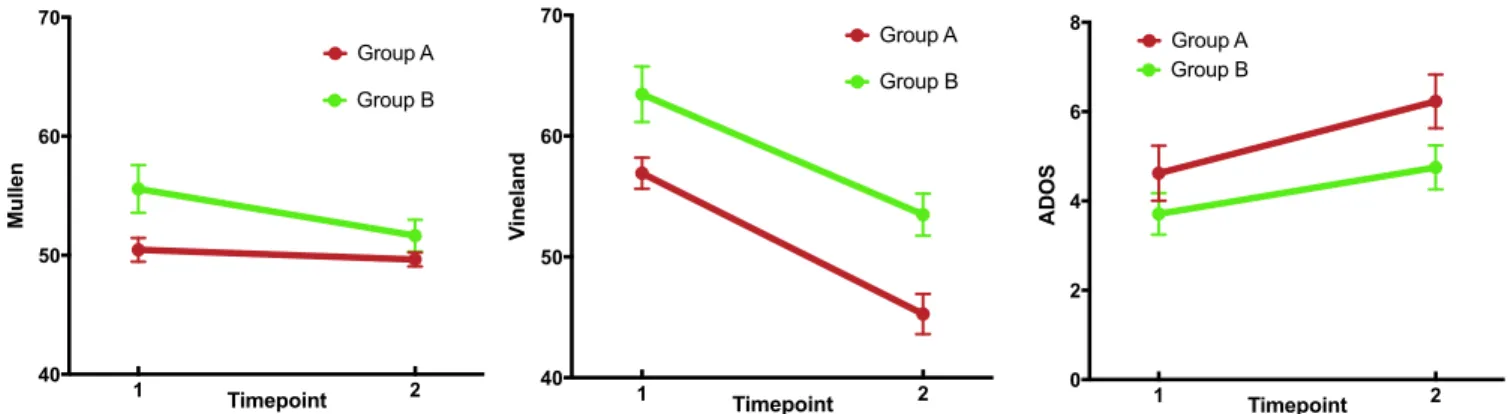
between groups A and B at time 1 or time 2, and the follow-up duration was not different between groups (allp>0.10; Fig. 2 and Table S3). Longitudinal analyses of cognitive/behavioral scores include a main effect of the anatomically defined sub-group, indicating higher performance of group B on the Vine-land Adaptive Behavior Scales (25) (P=0.016) and trends for the Mullen Scales of Early Learning (26) (P =0.090) and the Autism Diagnostic Observation Schedule–Generic (ADOS) (27) (P = 0.056) composite scores. Note that higher scores on the ADOS indicate higher severity of autism symptoms, whereas higher scores on the Vineland and Mullen indicate higher levels
of adaptive function and cognitive ability, respectively. Signifi-cant main effects of time indicate decreasing Vineland (P < 0.001) and increasing ADOS (P=0.015) scores for all individ-uals regardless of group and a trend for decreasing Mullen scores (P = 0.053) over time. Group-by-time interactions were not significant for any of the cognitive/behavioral measures global scales (allp>0.10; seeTable S4for subscale results).
Follow-up cross-sectionalttests at each time point indicated significantly higher scores for group B on the Vineland at both time points (time 1P=0.009 and time 2P=0.001) and on the Mullen at time 1 (P=0.015) and lower scores for group B on the ADOS at time 2 (P=0.033). We also observed a floor effect on Mullen scores: at time 1, 85% of individuals in group A and 42% in group B received a standard score of 49 (the lowest possible standard score). At time 2, 75% of individuals in group A and 67% in group B received a score of 49. Analysis of Mullen raw scores is presented inTable S5.
Post hoc analyses showed a significant group-by-time interac-tion for the Vineland daily living subscale (P=0.004) indicating a more rapid decline in standard scores for group A (Table S4). There was no significant group difference in FMRP percentages (P>0.10).
Univariate Neuroanatomical Results.Group A demonstrated
time 1 as a covariate (P>0.10, FDR corrected). Longitudinal analyses of total brain volume include a main effect of the an-atomically defined subgroup, indicating larger volumes for group A relative to group B and a significant main effect of time indi-cating larger volumes at time 2 (bothP<0.001, FDR corrected) but no group-by-time interaction (P > 0.10, FDR corrected). Follow-up t tests indicated that brain volumes were larger for group A at time 1 and time 2 (bothp<0.001, FDR corrected).
Comparison Between Longitudinal and Cross-Sectional TDA.We also
compared classification of subgroups based on longitudinal data to classification based on cross-sectional data that had been previously published (10). The longitudinally defined higher-functioning group B was consistent with the higher-higher-functioning group classified at mean age 2.89. Of the 16 individuals from the
original higher-functioning group who were followed longitudi-nally, all 16 were classified in the higher-functioning group based on their longitudinal data. The longitudinally based lower-functioning cross-sectional group was not as stable as the higher-functioning group. In fact, four of the individuals who were originally in the lower-functioning group were classified in the higher-functioning group based on their longitudinal data. In other words, these in-dividuals initially shared the neuroanatomical characteristics of the lower-functioning cross-sectional group but at time 2 follow-up were observed to have neuroanatomical trajectories that led to their inclusion in the higher-functioning longitudinal group. The change in Vineland scores for these individuals from time 1 to time 2 (which fall between −3.98 and −4.73) demonstrates a smaller decline in standard scores compared with the change in means of group A (−5.49) and group B (−5.05;Fig. S1).
Discussion
In this study, we hypothesized that TDA-based analysis of lon-gitudinal neuroanatomical data would identify clinically mean-ingful subgroups within a cohort of males with the FMR1 full mutation. Indeed, TDA classified the longitudinal anatomical data into two subgroups that were clinically distinct in terms of cogni-tive/behavioral performance. Group B demonstrated higher levels of adaptive function and cognition along with lower levels of au-tism symptoms and smaller total brain volumes relative to group A. These results suggest TDA applied to longitudinal neuro-imaging data can differentiate clinically meaningful subgroups that are not based on an a priori hypothesis. This information could have significant utility in characterizing subgroups within the larger FXS population by advancing understanding of different neurobiological mechanisms and/or unique brain–environment interactions within each subgroup. Further, subgroup-specific in-formation might be used in the future to inform targeted therapies and aid in predicting response to treatment.
The results demonstrated a higher level of adaptive func-tioning (Vineland) for group B relative to group A, and this difference was stable over time (no interaction with time). The Mullen and ADOS data revealed trends for higher performance and fewer autism symptoms for group B, but group differences were only significant at time 1 for Mullen and at time 2 for ADOS. We observed a floor effect on the Mullen scores, which may have prevented us from detecting effects of group or time. Analysis of raw Mullen scores revealed significantly lower scores on the expressive language subscale for group A at time 2 and a trend for a group-by-time interaction. Lack of significant dif-ference in the other raw Mullen scores may be due to generally low performance in both groups.
1 2
0 2 4 6 8
Timepoint
ADOS
Group A Group B
Main effect of group p = 0.056
1 2
40 50 60 70
Timepoint
V
ineland
Group A
Group B
Main effect of group p = 0.013
1 2
40 50 60 70
Timepoint
Mullen
Group A
Group B
Main effect of group p = 0.090
Fig. 2. Cognitive/behavioral results by timepoint. Standard scores are presented for the Mullen Scales of Early Learning (Left) and the Vineland Adaptive Behavior Scale (Middle). Higher scores for these scales indicate better performance. A floor effect was present in the Mullen scores (see text). Calibrated severity scores are presented for the ADOS (Right, higher scores indicate more autism symptoms).
Fig. 3. Univariate neuroanatomical results. Group differences are displayed on average gray matter template created from all participants (P<0.005, FWE corrected). (A) Regions of significantly enlarged gray matter for group A relative to group B at time point 1. (B) Regions of significantly enlarged gray matter for group A relative to group B at time point 2. (C) Regions of significantly enlarged white matter for group A relative to group B at time point 1. (D) Regions of significantly enlarged white matter for group A relative to group B at time point 2. These differences remain largely con-sistent over time; no significant group-by-time interaction was found. There were no regions for which group B demonstrated enlarged volume relative to group A.
NEUR
Group differences for ADOS scores were not seen at time point 1, perhaps because autism symptoms were not pronounced enough or the ADOS version we used lacked sensitivity. We used the original ADOS assessment for this study (27). However, since completion of our data collection, toddler (28) and infant (29) versions of the ADOS have been introduced. These age-appropriate assessments may be more sensitive to quantifying early autism symptoms. Nevertheless, the significant main ef-fect of time indicates increasing scores in both subgroups sug-gesting that autism symptoms increase with age in young boys with FXS and that early intervention should be considered for these individuals.
We noted a significant effect of time for Vineland and a trend for Mullen scores in the overall study sample with the change in scores indicting worse performance at later ages. Decreases in Vineland and Mullen standard scores indicate a slowing of the growth of adaptive and cognitive functioning. In other words, these individuals are falling farther behind their same-age typi-cally developing peers, but this does not represent a loss of function per se. Decreasing trajectories are consistent with lon-gitudinal analyses of adaptive behavior (30) and cognitive func-tioning (31) in individuals with FXS.
The lack of significant group-by-time interactions within any of the three assessment global scales suggests that the cognitive/ behavioral differences were consistent over time. It is possible that the tests were not sufficiently sensitive to capture differen-tial trajectories of cognitive/behavioral function within sub-groups. This lack of sensitivity is most apparent in the range of scores in the Mullen (for which we noted a floor effect) and ADOS severity scores, which range from 1 to 10 for this measure. The Vineland scores demonstrated a greater range, and we ob-served a group-by-time interaction for the daily living subscale. This result indicates a steeper slope or more rapid decline in standard scores for group A. The daily living subscale measures an individual’s skills in personal, domestic, and community do-mains. Recent longitudinal research in FXS indicates a weakness for the daily living domain relative to the socialization domain across development (30). Our results suggest that for a subset of individuals with FXS, daily living may be particularly vulnerable to a more rapid widening of the gap in scores relative to those of typically developing peers. Identification of individual strengths and weaknesses and knowledge of time-dependent changes in adaptive behavior profiles are critical for tailoring medical and behavioral interventions. Clearly, further longitudinal follow-up beyond age 5 will be required to bear out strengths and weakness of individual subgroups.
The longitudinal TDA revealed a complex multivariate pat-tern of subgroup differences in brain structure, and the results indicated significant, widespread group differences that were stable over time (no group-by-time interaction). The univariate results indicated enlarged volumes in group A for gray matter and white matter regions including caudate, thalamus, frontal lobe, temporal lobe, and cerebellum. These univariate results are consistent with what our group has found when comparing this entire cohort of individuals with FXS to typically developing groups and clinical comparison groups (11, 16, 17). Other studies have confirmed enlarged subcortical and cortical volume and increased cortical thickness in older individuals with FXS (32, 33). These neuroanatomical differences may result from aber-rant synaptic activity and altered dendritic pruning, which are downstream effects of FMR1 gene mutations (3). Our results demonstrate that the aforementioned subcortical and corti-cal enlargement is not homogeneous across males with the
FMR1full mutation. Within our study population, the subgroup with widespread enlarged brain regions (i.e., generally larger brain volume) presented with lower adaptive, behavioral, and cognitive scores.
In the longitudinal analysis, two major groups accounted for over 90% of the data, whereas in the single-time point analysis (10), two groups accounted for only 73% of the data (χ2=4.522, df = 1, P = 0.033). This difference suggests that subgroup identification based on longitudinal histories may lead to a clearer separation of the data than identification based on cross-sectional analysis. This finding is consistent with neuroimaging research demonstrating that longitudinal analysis is more pow-erful than cross-sectional analysis at detecting gene–brain rela-tionships (34). The enhanced classification in the present study cannot be explained by attrition alone: 4 of the 11 individuals lost to attrition were unclassified in the cross-sectional analysis, and 7 were classified into one of the two cross-sectional subgroups. Longer longitudinal studies are required to determine the stability of these groups across development, and replication in indepen-dent samples will be necessary to establish the generalizability of these results to other populations. Further, studies with larger sample sizes will be important for examining outcomes within indi-viduals who were not classified into one of the larger subgroups. There was no difference in FMRP levels between the lower-functioning and higher-lower-functioning groups, a finding that is consistent with our cross-sectional results (10). Thus, subgroups were identified among young children with FXS using factors other than FMRP. This discrimination is important: within males with FXS, FMRP levels are skewed to the lower end of the spectrum within a small range (in the present study FMRP levels range from 1 to 20%). However, FMRP levels may prove more meaningful for differentiation within more diverse samples of individuals with FXS. For example, previous studies have reported associations between FMRP and brain function in females (35, 36) and between FMRP and anatomy in mixed sex samples (18) where a larger range in FMRP levels is observed. Although FMRP is essential for regulating synaptic plasticity and dendritic pruning (3) it also interacts with several other proteins that have unique expression profiles during development (37). Follow-up studies examining other genetic factors, including relevant functional polymorphisms for other loci may be informative for under-standing complex gene–brain–behavior relationships in individ-uals with FXS.
A subset of participants was taking medications that are known to affect neurological functioning (Table S6). Higher medication use was present in the lower functioning group, which is in line with the higher levels of cognitive and behavioral dysfunction and lower adaptive functioning we observed in children comprising this group.
point data, consistent with improved performance using additional data. This information may be used to predict outcomes and guide design of targeted therapies for individuals with FXS. In addition, longitudinal TDA may represent an informative tool for exploration of neurodevelopmental variation in other specific and idiopathic disorders such as sex chromosome aneuploidy conditions, idio-pathic autism spectrum disorder, and attention deficit hyperactivity disorder.
Materials and Methods
Participants and Data Collection.Participants were recruited by collaborating
research teams at Stanford University and the University of North Carolina at Chapel Hill. The study protocols were approved by the human subjects committees at Stanford University and the University of North Carolina at Chapel Hill, and informed consent was obtained from all parents. Children with FXS were recruited through registry databases maintained by both institutions, through postings to the National Fragile X Foundation website and quarterly newsletter, and through mailings to other regional FXS or-ganizations.FMR1 full mutation was confirmed via Southern blot DNA analysis, and FMRP percentage was estimated based on the percentage of peripheral lymphocytes containing FMRP (38). Participants using medica-tions were included in the study (Table S6).
Participants completed the same battery of assessments at each time point, and all assessments were administered and scored under the supervision of a doctoral-level clinician. The Mullen Scales of Early Learning (26) assessed cognitive abilities. The Vineland Adaptive Behavior Scales, Interview Edition, Survey Form (25), was used to measure age-appropriate skills required for navigating daily life. The same parent completed the interview at each visit for all but four participants (one in group A, two in group B, and one in that was not assigned to either of the subgroups). When these participants were removed from the repeated measures analysis of Vineland composite scores, the pattern of results did not change. The main effect of group remained significant (higher scores for group B,P=0.024), the main effect of time remained significant (decreasing scores for all individuals,P<0.001), and the group-by-time interaction remained not significant (P>0.10). The group-by-time interaction for the daily living subscale also remained significant (P= 0.005). The Autism Diagnostic Observation Schedule–Generic (ADOS) (27) was administered and scored by a research-certified clinician or by indi-viduals who were directly trained by a research-certified administrator. The ADOS was administered by a different clinician at each time point with the exception of six cases. Reliability among administrators was ver-ified within and across sites via consensus scoring for 20% of the assess-ments. ADOS-G scores were converted using the ADOS-2 summary scores (39) and calibrated severity scores (40). The stability of the calibrated se-verity scores has been demonstrated over time and when administered by different clinicians (41). Thus, having a different administrator at time 1 and time 2 likely did not bias our longitudinal results. There were no significant site differences on any of the cognitive/behavioral variables (all p>0.05).
Whole brain T1-weighted MRI data were collected from participants at each time point (GE 1.5 T Signa, coronal orientation; inversion recovery preparation pulse=300 ms; repetition time=12 ms; echo time=5 ms; flip angle=20°; slice thickness=1.5 mm; excitations=1; field of view=20 cm; matrix = 256 × 192; voxels = 0.78 mm3). Plastic geometric phantoms
were scanned at regular intervals during the study to ensure calibration of MRI scanners across sites. Results of calibration procedures have been reported (17).
Voxel-Based Morphometry Preprocessing. Voxel-based morphometry (VBM)
preprocessing of MRI data was performed using Statistical Parametric Mapping 5 (SPM5) (www.fil.ion.ucl.ac.uk/spm) and VBM5.1 (dbm.neuro.uni-jena.de/vbm). Images were bias-field corrected and segmented to gray matter, white matter, and cerebrospinal fluid. A Hidden Markov Random Field (prior probability weight 0.3) incorporated spatial constraints from neighboring voxels. Images were normalized with a 12-parameter affine transformation with a spatial frequency cutoff of 25 in all three (x,y,z) directions and resampled to 1×1×1 mm voxels. Linear and nonlinear Jacobian modulation parameters were applied. For each time point, customized gray matter, white matter, and cerebrospinal fluid templates created using all participants in our previous studies (11) were used for VBM preprocessing. Segmentation and normalization accuracy were manually inspected for each image.
Multivariate Pattern Analysis Using Topological Data Analysis.Fig. S2
sum-marizes these procedures. The normalized images were smoothed to 4 mm
to reduce noise and enhance further computation. Next, gray and white matter images for all participants for both time points were combined into a single matrix,M, with the data for each individual entered as a row and voxel intensity as the columns,M=(# participants)×(# gray voxels time 1+# white voxels time 1+# gray voxels time 2+# white voxels time 2).
Ayasdi Core software, a more recent version of Iris (42), was used to construct a Reeb graph to identify topological (i.e., shape) features. Con-struction of a Reeb graph includes (i) column selection, (ii) metric selection, (iii) filter selection, and (iv) selection of gain and resolution values.
Column selection defines the subject space,S, a high-dimensional space in which each participant’s data represent a point. A subset of columns ofM was selected corresponding to voxels whose variance was at least 0.03 across participants. (In modulated and segmented images voxel intensities corre-spond to proportions of volume and thus range in value from 0 to 1.) Each selected column was mean centered and scaled to have a variance of 1 such that all voxels were weighted equally. The next step, metric selection, de-fined the distances withinSyielding a measure of similarity between par-ticipants. The metric chosen for the present study was Euclidean distance using all of the columns in M, which is a generalization of the usual distance between pointsP1=(x1,y1) andP2=(x2,y2) in the 2D coordinate plane:
dðP1,P2Þ= ffiffiffiffiffiffiffiffiffiffiffiffiffiffiffiffiffiffiffiffiffiffiffiffiffiffiffiffiffiffiffiffiffiffiffiffiffiffiffiffiffiffiffiffiffiðx2−x1Þ2 +ðy2−y1Þ2 q
.
Filter selection transforms the similarity information into a visual represen-tation, a 2D rendering of a 3D graph. The first two principal component scores (PC1 and PC2) of the variance-normalized data were used as filters, such that two participants were judged to be similar (i.e., shared the same bin) if both their PC1 and PC2 scores were sufficiently similar. Next, Euclidian distance was used to further cluster the participants within each bin, such that two par-ticipants within the same bin were merged into the same cluster if the dis-tance between them was sufficiently small; each cluster obtained in this way was then viewed as a node of the Reeb graph. Any two clusters (i.e., nodes) that shared a participant were then joined by an edge. Although bin size was governed by the resolution parameter, bins were allowed to overlap (i.e., share participants) to an extent governed by the gain parameter, and this overlap may lead clusters from different bins to share participants. Thus, resolution and gain determine the nodes and edges of the Reeb graph, which was projected onto a 2D plane for visualization. We may think of the resulting graph as a view of the data through a microscope, where the TDA gain and resolution parameters play roles analogous to level of light and level of magnification. The parameter values that clearly decomposed the data into subgroups were a gain of 4 for PC1 and PC2 and a resolution of 20 for PC1 and PC2.
Analysis of Cognitive/Behavioral Data.Repeated measures ANOVA was used
to assess longitudinal change with longitudinally based TDA group as the independent variable, Mullen, Vineland, or ADOS score as the dependent variables and time point as the repeated factor. Standardttests were used to compare cross-sectional cognitive/behavioral scores between subgroups at each time point.
Univariate Analyses of Magnetic Resonance Images. Post hoc descriptive
comparisons of gray and white matter volume, using age at time 1 as a covariate, were performed to illustrate cross-sectional structural brain dif-ferences between subgroups at time 1 and at time 2. Longitudinal gray and white matter images representing change in volume from time 1 to time 2 were also compared between groups statistically to illustrate differential changes between the groups over time. For both cross-sectional and longi-tudinal comparisons FSL’s randomize tool (https://fsl.fmrib.ox.ac.uk/fsl/ fslwiki/Randomise) was implemented with 5,000 permutations and thresh-old-free cluster enhancement (43). Clusters corresponding toP<0.005 (FWE corrected) were retained. We also compared total brain volumes longitu-dinally with repeated measures ANOVA and examined cross-sectional dif-ferences usingttests.
ACKNOWLEDGMENTS.We gratefully acknowledge the Canel family and the families who participated in this research. We acknowledge the sup-port of Grant R01 MH064708-07 (to A.L.R. and J.P.). This dataset was also presented as an abstract at the 71st annual meeting of the Society of Biological Psychiatry.
NEUR
1. Insel TR (2014) The NIMH Research Domain Criteria (RDoC) project: Precision medicine for psychiatry.Am J Psychiatry171:395–397.
2. Hagerman R, Hoem G, Hagerman P (2010) Fragile X and autism: Intertwined at the molecular level leading to targeted treatments.Mol Autism1:12.
3. Swanger SA, Bassell GJ (2011) Making and breaking synapses through local mRNA regulation.Curr Opin Genet Dev21:414–421.
4. Sinclair D, Oranje B, Razak KA, Siegel SJ, Schmid S (2017) Sensory processing in autism spectrum disorders and Fragile X syndrome—From the clinic to animal models.
Neurosci Biobehav Rev76:235–253.
5. Bear MF, Huber KM, Warren ST (2004) The mGluR theory of fragile X mental re-tardation.Trends Neurosci27:370–377.
6. Gantois I, et al. (2013) Chronic administration of AFQ056/Mavoglurant restores social behaviour in Fmr1 knockout mice.Behav Brain Res239:72–79.
7. Levenga J, et al. (2011) AFQ056, a new mGluR5 antagonist for treatment of fragile X syndrome.Neurobiol Dis42:311–317.
8. Pop AS, et al. (2014) Rescue of dendritic spine phenotype in Fmr1 KO mice with the mGluR5 antagonist AFQ056/Mavoglurant.Psychopharmacology (Berl)231:1227–1235. 9. Berry-Kravis E, et al. (2016) Mavoglurant in fragile X syndrome: Results of two
ran-domized, double-blind, placebo-controlled trials.Sci Transl Med8:321ra5. 10. Romano D, et al. (2014) Topological methods reveal high and low functioning
neuro-phenotypes within fragile X syndrome.Hum Brain Mapp35:4904–4915.
11. Hoeft F, et al. (2010) Region-specific alterations in brain development in one- to three-year-old boys with fragile X syndrome.Proc Natl Acad Sci USA107:9335–9339. 12. Calhoun VD, AdalıT (2012) Multisubject independent component analysis of fMRI: A decade of intrinsic networks, default mode, and neurodiagnostic discovery.IEEE Rev Biomed Eng5:60–73.
13. Fair DA, Bathula D, Nikolas MA, Nigg JT (2012) Distinct neuropsychological subgroups in typically developing youth inform heterogeneity in children with ADHD.Proc Natl Acad Sci USA109:6769–6774.
14. Carlsson G (2009) Topology and data.Bull Am Math Soc46:255–308. 15. Carlsson G (2016) The shape of biomedical data.Curr Opin Syst Biol1:109–113. 16. Hoeft F, et al. (2008) Morphometric spatial patterns differentiating boys with fragile
X syndrome, typically developing boys, and developmentally delayed boys aged 1 to 3 years.Arch Gen Psychiatry65:1087–1097.
17. Hoeft F, et al. (2011) Neuroanatomical differences in toddler boys with fragile x syndrome and idiopathic autism.Arch Gen Psychiatry68:295–305.
18. Gothelf D, et al. (2008) Neuroanatomy of fragile X syndrome is associated with ab-errant behavior and the fragile X mental retardation protein (FMRP).Ann Neurol63: 40–51.
19. Wolff JJ, Hazlett HC, Lightbody AA, Reiss AL, Piven J (2013) Repetitive and self-injurious behaviors : Associations with caudate volume in autism and fragile X syn-drome.J Neurodev Disord5:1–9.
20. Wolff JJ, et al. (2012) Evidence of a distinct behavioral phenotype in young boys with fragile X syndrome and autism.J Am Acad Child Adolesc Psychiatry51:1324–1332. 21. Hazlett HC, et al. (2009) Teasing apart the heterogeneity of autism: Same behavior,
different brains in toddlers with fragile X syndrome and autism.J Neurodev Disord1: 81–90.
22. Hazlett HC, et al. (2012) Trajectories of early brain volume development in fragile X syndrome and autism.J Am Acad Child Adolesc Psychiatry51:921–933.
23. Wassink TH, Hazlett HC, Davis LK, Reiss AL, Piven J (2014) Testing for association of the monoamine oxidase A promoter polymorphism with brain structure volumes in both autism and the fragile X syndrome.J Neurodev Disord6:6.
24. Haas BW, et al. (2009) Early white-matter abnormalities of the ventral frontostriatal pathway in fragile X syndrome.Dev Med Child Neurol51:593–599.
25. Sparrow S, Balla D, Cicchetti D (1984)Vineland Adaptive Behavior Scales(American Guidance Service, Circle Pines, MN).
26. Mullen EM (1995)Mullen Scales of Early Learning, AGS Edition: Manual and Item Administrative Books(American Guidance Service, Circle Pines, MN), pp 1–92. 27. Lord C, et al. (2000) The ADOS-G (Autism Diagnostic Observation Schedule-Generic): A
standard measure of social-communication deficits associated with the spectrum of autism.J Autism Dev Disord30:205–223.
28. Luyster R, et al. (2009) The Autism Diagnostic Observation Schedule-toddler module: A new module of a standardized diagnostic measure for autism spectrum disorders.
J Autism Dev Disord39:1305–1320.
29. Bryson SE, Zwaigenbaum L, McDermott C, Rombough V, Brian J (2008) The Autism Observation Scale for Infants: Scale development and reliability data.J Autism Dev Disord38:731–738.
30. Klaiman C, et al. (2014) Longitudinal profiles of adaptive behavior in fragile X syn-drome.Pediatrics134:315–324, and erratum (2015) 135:775.
31. Quintin E-M, et al. (2016) The cognitive developmental profile associated with fragile X syndrome: A longitudinal investigation of cognitive strengths and weaknesses through childhood and adolescence.Dev Psychopathol28:1457–1469.
32. Meguid NA, et al. (2012) Cognition and lobar morphology in full mutation boys with fragile X syndrome.Brain Cogn78:74–84.
33. Bray S, et al. (2011) Aberrant frontal lobe maturation in adolescents with fragile X syndrome is related to delayed cognitive maturation.Biol Psychiatry70:852–858. 34. Xu Z, Shen X, Pan W; Alzheimer’s Disease Neuroimaging Initiative (2014) Longitudinal
analysis is more powerful than cross-sectional analysis in detecting genetic association with neuroimaging phenotypes.PLoS One9:e102312.
35. Bruno JL, Garrett AS, Quintin EM, Mazaika PK, Reiss AL (2014) Aberrant face and gaze habituation in fragile x syndrome.Am J Psychiatry171:1099–1106.
36. Menon V, Leroux J, White CD, Reiss AL (2004) Frontostriatal deficits in fragile X syndrome: Relation to FMR1 gene expression.Proc Natl Acad Sci USA101:3615–3620. 37. Bonaccorso CM, et al. (2015) Fragile X mental retardation protein (FMRP) interacting proteins exhibit different expression patterns during development.Int J Dev Neurosci
42:15–23.
38. Willemsen R, et al. (1997) Rapid antibody test for diagnosing fragile X syndrome: A validation of the technique.Hum Genet99:308–311.
39. Lord C, et al. (2012)Autism Diagnostic Observation Schedule, Second Edition (ADOS-2) Manual (Part 1): Modules 1-4(Western Psychological Services, Torrance, CA). 40. Gotham K, Pickles A, Lord C (2009) Standardizing ADOS scores for a measure of
se-verity in autism spectrum disorders.J Autism Dev Disord39:693–705.
41. Gotham K, Pickles A, Lord C (2012) Trajectories of autism severity in children using standardized ADOS scores.Pediatrics130:e1278–e1284.
42. Lum PY, et al. (2013) Extracting insights from the shape of complex data using to-pology.Sci Rep3:1236.
43. Smith SM, Nichols TE (2009) Threshold-free cluster enhancement: Addressing prob-lems of smoothing, threshold dependence and localisation in cluster inference.