Occupational Physical Activity and Body
Mass Index: Results from the Hispanic
Community Health Study / Study of Latinos
Richard H. Singer1,2*, Mark Stoutenberg1, Marc D. Gellman3, Edward Archer4, SoniaM. Davis5, Nathan Gotman5, David X. Marquez6, Christina Buelna7, Yu Deng5, H. Dean Hosgood8, Ruth E. Zambrana9
1Department of Public Health Sciences, University of Miami Miller School of Medicine, Miami, Florida, United States of America,2College of Dental Medicine, Nova Southeastern University, Ft. Lauderdale, Florida, United States of America,3Department of Psychology, University of Miami, Miami, Florida United Sates of America,4Office of Energetics, Nutrition Obesity Research Center, University of Alabama Birmingham, Birmingham, Alabama, United States of America,5Department of Biostatistics, Gillings School of Global Public Health, University of North Carolina - Chapel Hill, Chapel Hill, North Carolina, United States of America,6Department of Kinesiology and Nutrition, University of Illinois at Chicago, Chicago, Illinois, United States of America,7Institute for Behavioral and Community Health, Graduate School of Public Health, San Diego State University, San Diego, California, United States of America,8Department of Epidemiology and Population Health, Albert Einstein College of Medicine, Bronx, New York, United States of America,9Department of Women's Studies, Director, Consortium on Race, Gender and Ethnicity, University of Maryland, College Park, Maryland, United States of America
Abstract
Purpose
To examine the associations between overweight/obesity and occupation among Hispan-ics/Latinos, the largest minority population in the U.S.
Methods
This study included 7,409 employed individuals in the Hispanic Community Health Study/ Study of Latinos (HCHS/SOL), a prospective study of Hispanic/Latino individuals aged 18– 74 in four communities in the U.S. We independently examined the relationships between BMI, Occupational Activity (OA), and Total Hours Worked, quantified via self-reported hours worked per week and occupation-assigned Metabolic Equivalents (METs).
Results
More than three quarters of the participants were either overweight (39.3%) or obese (37.8%). Individuals with a primary occupation and those employed in a secondary occupa-tion worked an average of 36.8 and 14.6 hrs/wk, respectively. The overall adjusted odds for being obese compared to normal weight were 3.2% (AOR = 1.03, 95% CI 1.01, 1.05) and 14.4% (AOR = 1.14 95% Cl 1.07, 1.23) greater for each 10 MET•hrs/wk unit of increased OA, and each 10-hrs/wk unit of Total Hours Worked, respectively.
OPEN ACCESS
Citation:Singer RH, Stoutenberg M, Gellman MD, Archer E, Davis SM, Gotman N, et al. (2016) Occupational Physical Activity and Body Mass Index: Results from the Hispanic Community Health Study / Study of Latinos. PLoS ONE 11(3): e0152339. doi:10.1371/journal.pone.0152339
Editor:Rebecca A Krukowski, University of Tennessee Health Science Center, UNITED STATES
Received:September 21, 2015
Accepted:March 11, 2016
Published:March 31, 2016
Copyright:© 2016 Singer et al. This is an open access article distributed under the terms of the Creative Commons Attribution License, which permits unrestricted use, distribution, and reproduction in any medium, provided the original author and source are credited.
Conclusion
This study presents the first findings on the association between OA with overweight/obe-sity among Hispanic/Latino individuals in the U.S. Increasing OA and Total Hours Worked per week were independently associated with increasing odds of overweight/obesity sug-gesting that the workplace is only one part of the overall energy expenditure dynamic. Our findings point to the need to emphasize engaging employed individuals in greater levels of PA outside of the work environment to impact overweight/obesity.
Introduction
The negative health consequences associated with the“obesity epidemic”have been well
docu-mented and present a significant impact upon public health [1,2]. Nearly one-third of the U.S.
adult population is obese and the prevalence among many minorities is even higher [3]. For
men and women together, the prevalence of obesity is greater for Hispanic/Latino (28.7%) and
non-Hispanic black (35.7%) adults, than for non-Hispanic white adults (23.7%) [3]. The
asso-ciation of obesity with hypertension, hyperlipidemia, and diabetes signifies that obese
individu-als are particularly at risk of death from CVD and its sequelae [4,5]. Yet, despite the public
health impact associated with increasing incidence of obesity, identification of the factors lead-ing to this phenomenon are still undetermined and have yet to be fully examined in Hispanic/ Latino populations.
Obesity is the result of a chronic positive energy balance achieved by consuming more energy
than is expended (weight change = energy consumed−energy expended). The primary
modifi-able varimodifi-able of the expenditure component is physical activity (PA) that is categorized into four domains: occupational, transportation, household, and leisure-time activities. Considering that leisure-time physical activity (LTPA) has not changed significantly over the period that the
prevalence of obesity has increased [6,7], most research has focused on the energy intake
(con-sumption) component of the model in an attempt to explain the rise in U.S. adult obesity [8–
10]. Recent questioning of the validity of population-level energy intake data [11,12] has led to
increasing attempts to quantify other domains of energy expenditure [13–15].
Based upon observations that time spent in LTPA represent a relatively small proportion of our waking hours and that a large segment of waking hours are spent at work, Church et al.
[15] developed a conceptual framework that argued that occupational PA has a greater
poten-tial impact than LTPA on daily total energy expenditure. He reported that over the past 50 years in the U.S., the progressive decrease in the percent of individuals employed in moderate
intensity occupations resulted in a reduction of>100 calories in daily energy expenditure. A
positive energy balance as little as 50 kcal/day can lead to an average gradual weight gain of 1–2
pounds per year [16–18]. Accordingly, the reduction in occupational PA advanced by Church
et al. [15] accounted for a significant proportion of the increase in mean body weight among U.
S. men and women.
Existing literature presents conflicting findings regarding the association between
occupa-tional energy expenditure and Body Mass Index (BMI) [19–27]. In some instances [19,26,27]
results are consistent with those of Church et al., [15] namely, that lower BMIs were associated
with occupations involving moderate to high levels of PA. Other studies [20–24] have reported
an inverse relationship between BMI and occupational level, where higher BMIs were associated
with higher energy expenditure occupations. Still others report no association [25,28]. Gender
differences appear to contribute further to the controversy [21–24] among employed individuals.
must first register on the BIOLINCC web site for access to this form.
Funding:The authors received no specific funding for this work.
Data from the U.S. Department of Labor, Bureau of Labor Statistics [29] point to disparities in occupational patterns between Hispanic and non-Hispanic segments of the U.S. population. A lower percent of Hispanics were employed in professional or management related occupa-tions and a larger percent were employed in trade or production occupaoccupa-tions than the total and non-Hispanic white populations. Such disparities may point to unique associations between occupational PA and the risk of being overweight and obese in Hispanic/Latino populations. While previous studies have examined the relationship between BMI and occupation in Thai
[19], Dutch [21], Spanish [22], Australian [23], Canadian [24], Polish [25], and general U.S.
populations [26], to our knowledge a focused examination of the relationship between BMI and
employment status or occupational PA has not been conducted in the U.S. Hispanic/Latino population. Identification of occupations that convey risk of overweight or obesity in the His-panic/Latino population may provide opportunities to identify ethnically appropriate strategies in the workplace that may be used for health promotion and prevention of obesity. Given the increasing prevalence of obesity and its associated morbidity, mortality, and economic impact, our principal aim is to obtain an understanding of the manner in which occupational PA con-tributes to, or protects against, the obesity epidemic in a Hispanic/Latino population.
Methods
Participants
The current study used data acquired in the Hispanic Community Health Study/Study of Lati-nos (HCHS/SOL). The HCHS/SOL is a prospective study that enrolled 16,415 self-identified
Hispanic/Latino individuals aged 18–74 in four U.S. communities (Bronx, Chicago, Miami,
San Diego) from diverse cultural origins. Recruitment, which began in 2008, was implemented
through a two-stage area household probability design [30].
The HCHS/SOL is conducted under the oversight of the Institutional Review Boards (IRB) at each of the following participating institutions constituting the regional field centers: Albert Einstein College of Medicine/Montefiore Medical Center; Feinberg School of Medicine, North-western University in collaboration with the Midwest Latino Health Research Training & Pol-icy Center at the University of Illinois at Chicago; Miller School of Medicine of the University of Miami; San Diego State University Graduate School of Public Health; and the HCHS/SOL Coordinating Center at the University of North Carolina. The participants provided written informed consent, in either Spanish or English, prior to data collection. Specific details regard-ing sample design, cohort selection and implementation of the HCHS/SOL have been
previ-ously described [30,31]. The study examination included multiple interviewer-administered
questionnaires, available in both Spanish and English.
Body Mass Index
The dependent variable in this study, BMI, was calculated from direct measurements of partici-pant height and weight and was categorized according to National Institute of Health (NHLBI/
NIH) guidelines [32] as follows: BMI<18.5 = underweight; 18.5BMI24.9 = normal
weight; 25BMI29.9 = overweight; and BMI30 = obese. This categorization permitted
the evaluation of differences among underweight, normal, overweight, and obese individuals, where normal weight served as the reference category.
Occupational Physical Activity
as currently employed (full-time or part-time) or unemployed. All other occupational mea-sures were limited to the subset of employed individuals. Employment was self-described as
full-time (40 hours/week) or part-time (<40 hrs/wk). Occupations were categorized into
one of 13 HCHS/SOL Occupational Categories included in our data set (S1 Table). The
pri-mary occupation was defined as the one in which individuals spent the most time. For people with more than one job, a secondary occupational category was also recorded. Equating the 13 occupational categories with activity levels was based upon the assignment of metabolic equiv-alent (MET) values attributed to the 2002 Census Occupational Classification System (OCS)
[33] by Tudor-Locke et al., [34] and followed by Church et al. [15]. Each key word and
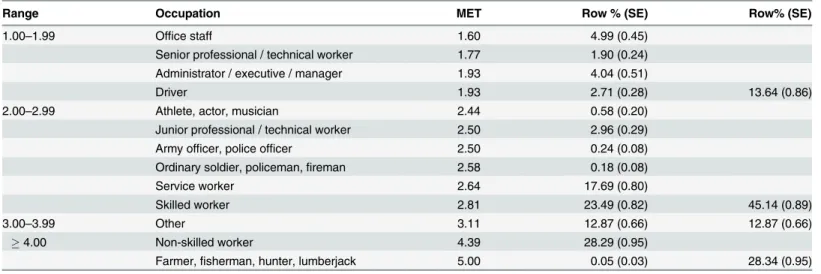
descriptor of the 13 self-reported HCHS/SOL occupational categories was cross-matched to the 509 detailed occupations in the OCS. For each HCHS/SOL occupational category (Table 1), the assigned MET value was calculated as the average of the cross-matched MET equivalents from the OCS database, to each of the descriptors from the HCHS/SOL
occupa-tional categories. Weekly OA (MET•hrs/wk) was calculated as the product of: (1) the assigned
MET value of the stated occupational category and (2) the hours worked per week in that occupation. For individuals with two jobs, the total Weekly OA was the sum of the Weekly OA for both occupations. For example, Weekly OA for an individual employed 8 hours per day, 6 days per week as a Senior professional (assigned value of 1.77 METs) was calculated as
(1.77 MET) x (8hr/day) x (6 day/week) = 70.8 MET•hrs/wk. A continuous variable describing
SROA(hrs/wk) was constructed from the sum of self-reported time spent in moderate
occu-pational PA, such as carrying light loads or brisk walking, and vigorous occuoccu-pational PA, such
as carrying heavy loads, digging or construction work, weighted by 2 [35,36]. Total Hours
Worked (hrs/wk) was a continuous variable defined for each individual as all of the hours worked per week across all jobs.
Covariates
Leisure-time Physical Activity (LTPA) was constructed categorically as“none”,“moderate”,
“vigorous”, or“moderate and vigorous”, based upon participant responses to the questions,
“Do you do any vigorous-intensity (or moderate-intensity) sports, fitness or recreational
Table 1. Occupational MET*Categorical Assignment Scheme (N = 7,336§).
Range Occupation MET Row % (SE) Row% (SE)
1.00–1.99 Office staff 1.60 4.99 (0.45)
Senior professional / technical worker 1.77 1.90 (0.24)
Administrator / executive / manager 1.93 4.04 (0.51)
Driver 1.93 2.71 (0.28) 13.64 (0.86)
2.00–2.99 Athlete, actor, musician 2.44 0.58 (0.20)
Junior professional / technical worker 2.50 2.96 (0.29)
Army officer, police officer 2.50 0.24 (0.08)
Ordinary soldier, policeman,fireman 2.58 0.18 (0.08)
Service worker 2.64 17.69 (0.80)
Skilled worker 2.81 23.49 (0.82) 45.14 (0.89)
3.00–3.99 Other 3.11 12.87 (0.66) 12.87 (0.66)
4.00 Non-skilled worker 4.39 28.29 (0.95)
Farmer,fisherman, hunter, lumberjack 5.00 0.05 (0.03) 28.34 (0.95)
*MET—Metabolic Equivalent of Task (kcal/kg*hr)
§7,336 individuals had non-missing values for METs and all covariates.
(leisure) activities that cause large (or small) increases in breathing or heart rate for at least 10
minutes continuously?”for vigorous and moderate LTPA, respectively. Transportation
Physi-cal Activity (TPA) was a categoriPhysi-cal variable coded as“no”or“yes”, where“yes”referred to
walking or bicycling continuously for at least 10 minutes to get from place to place. Energy Consumption was a derived variable based on two 24-Hour Dietary Recalls that were adminis-tered in-person at the field center, with a second dietary recall being adminisadminis-tered at least five days after the initial examination (and ideally within 45 days). Total energy intake was pre-dicted using a one-part nonlinear mixed model specified by the NCI method using single
com-ponent statistical macros developed at the NCI [37,38]. Socioeconomic Status (SES) was based
upon Annual Household Income in the HCHS/SOL Economic Questionnaire. Hispanic Back-ground was self-reported as either, Dominican or Dominican descent, Central American or Central American descent, Cuban or Cuban descent, Mexican or Mexican descent, Puerto Rican Puerto Rican descent, South American or South American descent, or more than one heritage/other. Acculturation was defined using the 6-question Short Acculturation Scale for Hispanics (SASH) language acculturation subscale and the 4-question SASH social accultura-tion subscale, each consisting of 5-point Likert-type responses with 1 = Only Spanish / All His-panic/Latino and 5 = Only English / All non-Hispanic/non-Latino. The degree of acculturation of participants is indicated by the averages of the 6 language subscale questions and 4 social
subscale questions respectively.Marital Statuswas categorized as single, married or living with
a partner, and separated, divorced or widowed. Cigarette Use was described by all participants, as never, former, or current smokers.
Statistical Analysis
Statistical analyses were conducted using SAS 9.4 software (SAS Institute, Cary, NC). The methodology employed for all analyses accounted for the complex sampling design, and applied the overall normalized sampling weights that were calibrated to the U.S. 2010 Census within the HCHS/SOL target areas, such that estimates reported generalize to the Hispanic/
Latino population age 18–74 living in these geographic areas [30,31]. Univariate analyses were
performed to provide summary statistics of the characteristics of the analytic sample (Table 2).
Bivariate associations for selected independent variables within the 4-level BMI classification, referenced to individuals with normal BMIs, were performed using unadjusted Rao-Scott Chi-Square tests for categorical variables and t-tests for comparing means of continuous variables (S2 Table). Multivariable polytomous survey logistic regression analysis of BMI categories were conducted to compute adjusted odds ratios (AOR) for BMI categories compared to normal BMI. Each model included a primary independent variable of interest, namely, Employment Status, SROA, Weekly OA, and Total Hours Worked, as well as the control covariates (age, income, Hispanic/Latino background, acculturation, cigarette use, dietary energy consump-tion, as well as TPA and LTPA). Moreover, stratification of the multivariable analyses was per-formed by domain analysis for employment (i.e., employed vs. unemployed) and gender in order to permit valid estimates of sample variance. P-values were not adjusted for multiple comparisons.
Results
Approximately half of the 16,415 participants in the HCHS/SOL sample were employed (N = 8,156). Covariate data was missing for 747 (9.2%) of the employed individuals that resulted in their exclusion from the analysis and produced a final analytic sample of 7,409. Pop-ulation estimates of the demographics, employment characteristics, PA domains, and total
Table 2. Demographic characteristics of employed individuals participating in the Hispanic Community Health Study/Study of Latinos (HCHS/ SOL), United States 2008–2011 (n = 7,409). Unadjusted column percent (95% CL), Mean (SE).
Overall Overall
Univariate Characteristic (N = 7,409)* Univariate Characteristic (N = 7,409)*
Col. Percent (95% CL) Col. Percent (95% CL)
Mean (SE) Mean (SE)
GENDER PRIMARY OCCUPATION§
Male 56.24 (54.56, 57.92) Office staff 4.94 (4.06, 5.82)
Female 43.76 (42.08, 45.44) Senior professional/technical worker 1.88 (1.42, 2.35)
Administrator/executive/manager 4.01 (3.01, 5.00)
AGE 38.95 (0.25) Driver 2.68 (2.13, 3.23)
18–29 years 26.95 (25.13, 28.77) Athlete, actor, musician 0.58 (0.19, 0.96)
30–39 years 25.78 (24.02, 27.55) Junior professional/Technical worker 2.93 (2.37, 3.48)
40–49 years 25.30 (23.93, 26.66) Army officer, police officer 0.24 (0.09, 0.39)
50–59 years 15.67 (14.66, 16.68) Ordinary soldier, policeman 0.18 (0.01, 0.34)
60–69 years 5.68 (4.96, 6.40) Service worker 17.53 (15.98, 19.09)
70–74 years 0.62 (0.38, 0.86) Skilled worker 23.28 (21.68, 24.87)
Otherc 12.76 (11.47, 14.05)
EDUCATIONa Non-skilled worker 28.03 (26.20, 29.86)
<HS 14.96 (13.75, 16.17) Farmer,fisherman, hunter 0.05 (0.01, 0.10)
HS (or Preparatory School) 39.12 (37.07, 41.18) Don’t know/refused 0.91 (0.57, 1.24) Trade or Vocational School 11.36 (10.11, 12.61)
University or College 32.92 (30.83, 35.01) PRIMARY OCCUPATION(hrs/wk) 36.77 (0.23)
Other 1.63 (1.20, 2.06)
SECONDARY OCCUPATION§
HOUSEHOLD INCOME Office staff 1.50 (0.44, 2.57)
<$10,000 7.32 (6.39, 8.24) Senior professional/technical worker 1.73 (0.60, 2.85)
$10,001–20,000 27.77 (25.85, 29.70) Administrator/executive/manager 3.67 (1.59, 5.76)
$20,001–40,000 37.99 (36.19, 39.79) Driver 1.11 (0.19, 2.03)
$40,001–75,000 18.85 (17.18, 20.52) Athlete, actor, musician 2.06 (1.03, 3.09)
>$75,000 8.07 (6.48, 9.67) Junior professional/Technical worker 2.53 (1.15, 3.92) Army officer, police officer 0.24 (0.00, 0.52)
MARITAL STATUSb Ordinary soldier, policeman 0.47 (0.00, 1.21)
Single 33.06 (31.22, 34.91) Service worker 17.51 (13.69, 21.34)
Married or living with a partner 53.33 (51.27, 55.39) Skilled worker 19.11 (14.44, 23.77)
Separated, divorced, or widow(er) 13.61 (12.50, 14.71) Otherc 17.35 (12.54, 22.15)
Non-skilled worker 24.26 (18.44, 30.08)
BMI 29.10 (0.11) Farmer,fisherman, hunter 0.16 (0.00, 0.40)
Underweight (<18.5) 0.75 (0.41, 1.10) Don’t know/refused 8.30 (2.84, 13.76)
Normal (18.5–24.9) 22.16 (20.78, 23.54)
Overweight (25.0–29.9) 39.30 (37.65, 40.95) SECONDARY OCCUPATION(hrs/wk) 14.61 (0.57)
Obese (30) 37.79 (35.98, 39.60)
TOTAL HOURS WORKED(hrs/wk) 38.33 (0.24)
ACCULTURATION
Language Subscale 2.15 (0.03) EMPLOYMENT
Language Subscale 2.27 (0.01) Part-time (<40 hrs/wk) 39.28 (37.51, 41.06)
Full-Time (40 hrs/wk) 60.72 (58.94, 62.49)
BACKGROUND PHYSICAL ACTIVITY
Dominican 9.42 (7.85, 11.00) Leisure Time (10 continuous min)
Central American 8.26 (6.89, 9.63) None 54.61 (52.49, 56.72)
and 53.3% were married or living with a partner. Individuals of Mexican descent comprised the largest estimated component of the population (44%), followed by individuals of Cuban (16%) and Puerto Rican (13%) backgrounds. Seventy-three percent of the household incomes were $40,000 or less. The population was predominantly non-smokers (64%), with 18% former
smokers. The mean BMI was 29.1 kg/m2, with more than three-quarters of the participants
either overweight (39.3%) or obese (37.8%).
The majority of the employed individuals were employed full-time (60.7%), with the remainder employed part-time (39.3%). Individuals with a single occupation worked an aver-age of 36.8 hrs/wk and those with a second occupation, an estimated 10.6% of the population, worked a mean of 14.6 additional hrs/wk. Overall, the estimated mean total hours worked was 38.8 hrs/wk. Less than half (44.9%) walked or bicycled for transportation, and greater than half (54.6%) responded that they did not participate in LTPA.
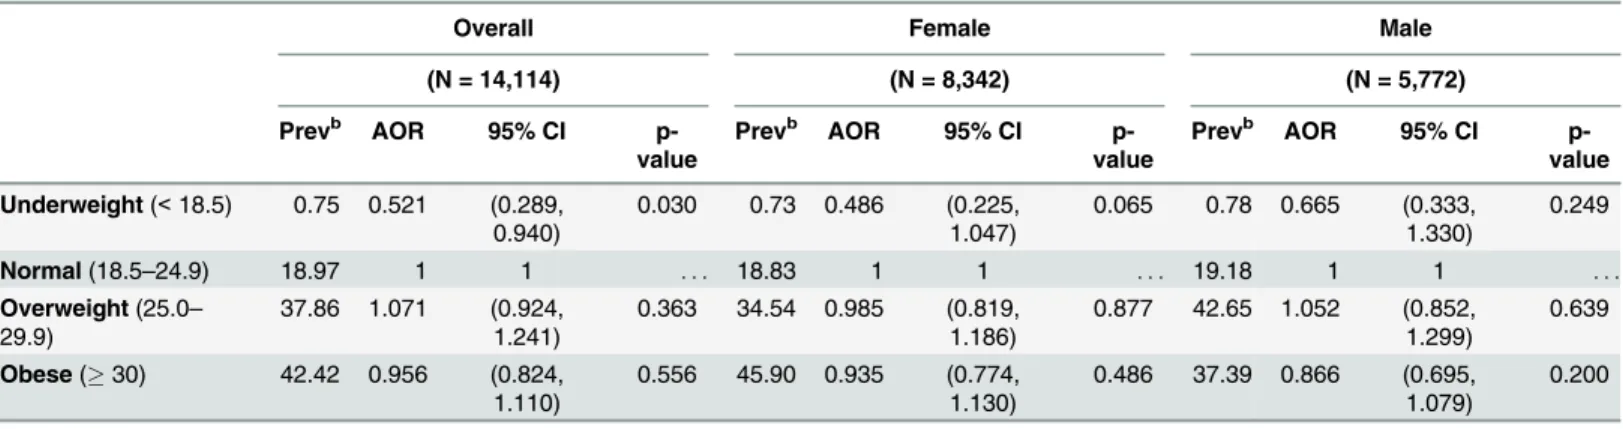
The population estimated associations between BMI categories and employment status inferred from the entire HCHS/SOL sample with non-missing covariates (N = 14,114) are
dis-played inTable 3. After adjusting for the covariates, the odds of being underweight compared
to normal weight were 47.9% lower (AOR = 0.521, 95% CI 0.289, 0.940) in employed compared to unemployed individuals. No other main effects were observed between BMI categories and employment status in this model. Moreover, no significant associations between BMI category and employment status were identified after stratification by gender.
The model presented inTable 4presents the relationship between BMI categories and
SROA (hrs/wk). After accounting for the covariates, there were no significant overall or gen-der-specific associations with BMI.
Table 2. (Continued)
Overall Overall
Univariate Characteristic (N = 7,409)* Univariate Characteristic (N = 7,409)*
Col. Percent (95% CL) Col. Percent (95% CL)
Mean (SE) Mean (SE)
Cuban 15.57 (12.60, 18.55) Moderate 16.16 (15.03, 17.28)
Mexican 43.52 (40.02, 47.02) Vigorous 13.37 (11.97, 14.78)
Puerto Rican 12.70 (11.16, 14.24) Moderate & Vigorous 15.86 (14.24, 17.49)
South American 6.03 (5.10, 6.97) Occupational Energy Expenditure (kcal/wk) 9,849.24 (96.01) More than one/Other heritage 4.49 (3.58, 5.40) Occupational Activity (MET*hrs/wk) 117.33 (1.02) Self-Reported Occupational Physical Activity (hrs/wk) 38.27 (0.87)
CIGARETTE USE Transportation (walk or bicycle10min)
Never 64.12 (62.37, 65.88) No 55.08 (52.90, 57.25)
Former 17.75 (16.55, 18.94) Yes 44.92 (42.75, 47.10)
Current 18.13 (16.68, 19.59) DIETARY COMPOSITION
Total Energy Consumption (kcal/day) 2,074.73 (9.93)
Note: Total number of participants in the HCHS/SOL was 16,415 individuals, of these 8,259 (50.31%) were not currently employed; the characteristics of the employed participants with non-missing data for Age, BMI, Income, Background, Acculturation, Cigarette Use, Energy Consumed, Transportation Physical Activity, and Leisure Time Physical Activity (N = 7,409, 45.14%) are presented above.
§
Occupations in order of increasing MET equivalents; Secondary Occupation refers to employment in addition to the primary occupation (i.e., a second job).
a.Responses missing for 34 individuals b.Responses missing for 7 individuals
c.MET equivalent for occupation“Other”was the population based weighted mean of all other occupations.
Table 5shows the association between BMI categories and Weekly OA, described in units
of 10 MET•hrs/wk. After adjusting for the covariates, the overall adjusted odds for being
over-weight were 3.8% greater than the odds of being normal over-weight for each 10 MET•hrs/wk unit
of increased Weekly OA (AOR = 1.04, 95% CI 1.02, 1.06). Similarly, there was a 3.2% increased
odds of being obese compared to normal weight for each 10 unit increase in MET•hrs/wk
(AOR = 1.03, 95% CI 1.01, 1.05). Males exhibited trends similar to the overall population with a 4.5% and 4.0% increased risk of being overweight (AOR = 1.05, 95% CI 1.02, 1.07) or obese (AOR = 1.04, 95% CI 1.01, 1.07) vs. normal weight, respectively, for each increasing 10 Table 3. Categorical polytomous BMI outcomes regressed upon Employment Status (Employed vs. Unemployed) among individuals participating in the HCHS/SOL study, stratified by gender (N = 14,114a).
Overall Female Male
(N = 14,114) (N = 8,342) (N = 5,772)
Prevb AOR 95% CI
p-value
Prevb AOR 95% CI
p-value
Prevb AOR 95% CI
p-value
Underweight(<18.5) 0.75 0.521 (0.289, 0.940)
0.030 0.73 0.486 (0.225, 1.047)
0.065 0.78 0.665 (0.333, 1.330)
0.249
Normal(18.5–24.9) 18.97 1 1 . . . 18.83 1 1 . . . 19.18 1 1 . . .
Overweight(25.0– 29.9)
37.86 1.071 (0.924, 1.241)
0.363 34.54 0.985 (0.819, 1.186)
0.877 42.65 1.052 (0.852, 1.299)
0.639
Obese(30) 42.42 0.956 (0.824, 1.110)
0.556 45.90 0.935 (0.774, 1.130)
0.486 37.39 0.866 (0.695, 1.079)
0.200
Variables forced into the model as covariates: Age, Income, Background, Acculturation, Cigarette Use, Energy Consumed, Transportation Physical Activity, and Leisure Time Physical Activity.
a.2,301 individuals were missing values for some or all covariates. b.Adjusted prevalence.
doi:10.1371/journal.pone.0152339.t003
Table 4. Categorical polytomous BMI outcomes regressed upon Self-Reported Occupational Activity§among employed individuals participating in the HCHS / SOL study, stratified by gender (N = 3,951a).
Overall Female Male
(N = 3,951) (N = 1,797) (N = 2,154)
Prevb AOR 95% CI
p-value
Prevb AOR 95% CI
p-value
Prevb AOR 95% CI
p-value
Underweight(<18.5) 0.81 0.991 (0.977, 1.006)
0.258 1.00 1.003 (0.980, 1.027)
0.782 0.70 0.988 (0.970, 1.007)
0.206
Normal(18.5–24.9) 22.47 1 1 . . . 24.33 1 1 . . . 21.41 1 1 . . .
Overweight(25.0– 29.9)
39.53 1.001 (0.998, 1.004)
0.520 34.05 1.001 (0.994, 1.007)
0.825 42.65 1.001 (0.997, 1.004)
0.783
Obese(30) 37.19 1.003 (1.000, 1.007)
0.061 40.61 1.005 (0.999, 1.011)
0.120 35.23 1.002 (0.998, 1.006)
0.307
§Self-Reported Occupational Activity (SROA) reported in units of hours x week-1
AOR—Adjusted Odds Ratio.
Variables forced into the model as covariates: Age, Income, Background, Acculturation, Cigarette Use, Energy Consumed, Transportation Physical Activity, and Leisure Time Physical Activity.
a.3,951 individuals had non-missing values for SROA and all covariates. b.Adjusted prevalence.
MET•hours/wk of Weekly OA. There were no significant associations for females when exam-ining the relationship between Weekly OA and BMI. Moreover, inclusion of an interaction term between Weekly OA and gender into the model (i.e., a test of moderation of Weekly OA
by gender) was not statistically significant (ΔR2= 0.007, WaldΧ2
(3)= 1.327, p = 0.723).
Further exploration of the results presented inTable 5led to the examination of the relative
contribution of each of the components of Weekly OA, namely Total Hours Worked and occu-pational METs, to the outcome. When polytomous BMI categories were regressed upon Weekly OA, controlling for Total Hours Worked, Weekly OA was no longer a statistically sig-nificant predictor of BMI outcomes neither for the overall population nor for males. However, when an identical model was analyzed, controlling for occupational METs instead of Total
Hours Worked, we observed outcomes analogous to those presented inTable 5, i.e., Weekly
OA maintaining statistical significance for the overall population and for males. The results of this component exploration suggested an additional need to examine the association of BMI and Total Hours Worked.
Table 6demonstrates the results of the polytomous BMI categorical outcomes regressed
upon Total Hours Worked. After adjusting for the covariates, the estimated overall adjusted odds for being overweight were 16.3% greater than the odds of being normal weight for each additional 10 hrs/wk of work (AOR = 1.16, 95% CI 1.01, 1.24). Similarly, there was a 14.4% increased odds of being obese compared to normal weight for each additional 10 hrs/wk of Total Hours Worked (AOR = 1.14, 95% CI 1.07, 1.23). Males exhibited trends similar to the overall population in that the odds of being overweight or obese, vs. normal weight, for each increasing 10 hrs/wk of Total Hours Worked was 24.5% (AOR = 1.25, 95% CI 1.14, 1.36) and 19.0% (AOR = 1.19, 95% CI 1.08, 1.32) greater, respectively. There were no significant associations for females when examining the relationship between BMI and Total Hours Worked.
Table 5. Categorical polytomous BMI outcomes regressed upon Occupational Activity§among employed individuals participating in the HCHS/ SOL study, stratified by gender (N = 7,354a).
Overall Female* Male*
(N = 7,354) (N = 3,948) (N = 3,406)
Prevb AOR 95% CI p-value Prevb AOR 95% CI
p-value
Prevb AOR 95% CI
p-value
Underweight(<18.5) 0.76 1.051 (0.971, 1.138)
0.218 0.90 1.056 (0.962, 1.159)
0.253 0.65 1.083 (0.954, 1.229)
0.218
Normal(18.5–24.9) 22.13 1 1 . . . 24.25 1 1 . . . 20.47 1 1 . . .
Overweight(25.0– 29.9)
39.23 1.038 (1.021, 1.056)
<0.0001 34.18 1.011 (0.982, 1.040)
0.463 43.17 1.045 (1.018, 1.072)
0.001
Obese(30) 37.89 1.032 (1.014, 1.050)
<0.001 40.66 1.011 (0.986, 1.037)
0.377 35.72 1.040 (1.013, 1.068)
0.004
§Occupational Activity = 10 MET x hours x week-1
*Test for moderation of OA by gender (i.e. OA*Gender) was not statistically significant (ΔR2= 0.007, WaldΧ2
(3)= 1.327, p = 0.723). AOR—Adjusted Odds Ratio.
Variables forced into the model as covariates: Age, Income, Background, Acculturation, Cigarette Use, Energy Consumed, Transportation Physical Activity, and Leisure Time Physical Activity.
MET equivalent for occupation“Other”was the population based weighted mean of all other occupations. a.7,354 individuals had non-missing values for OA and all covariates.
b.Adjusted prevalence.
Discussion
The HCHS/SOL represents a rich data set derived from a population-based prospective cohort, multi-site study that permits the evaluation of multiple health outcomes among Hispanic/ Latino individuals. Our study represents one of the first attempts to characterize the association between overweight/obesity and occupational parameters in a Hispanic/Latino population. By classifying our sample into BMI categories, we were able to examine population-estimated associations with Employment Status, SROA, Weekly OA, and Total Hours Worked. We found that increasing Weekly OA and Total Hours Worked for the overall population and for males were significantly associated with being overweight and obese. Further analysis indicated that Total Hours Worked might be the most important indicator of risk of being overweight/ obese.
The prevalence of overweight/obesity in our cross-sectional analysis of employed U.S. His-panic/Latino individuals in this study (77.1%) was greater than that reported by Ogden et al. for the U.S. adult population (69%), yet is consistent with their findings for Hispanic
individu-als (77.1%) [39]. Our study found no association between Employment Status and overweight/
obese status. This suggests that after taking into account the socioeconomic benefits attributed to being employed, employment was neither a protective nor a risk factor for
overweight/obe-sity. In contrast, Martin et al., [22] found a higher risk of obesity among unemployed vs.
actively employed individuals. It may be noteworthy that among those employed, Martin et al.
[22] distinguished between those who worked from home and those who did not, a distinction
not present in the current study. Although there was a low prevalence of underweight in our study, our findings suggested that employed individuals were less likely to be underweight compared to normal weight. While there is sparse literature regarding the association between
employment status and underweight, our finding is in agreement with Ali and Lindstrom [40]
who found that among Swedish women aged 18–34 years, employment was less common
among underweight, compared to normal weight women. Moreover, Imai et al. [41] found that
disability was more common among underweight persons of both genders compared to normal Table 6. Categorical polytomous BMI outcomes regressed upon Total Hours Worked§among employed individuals participating in the HCHS/ SOL study, stratified by gender (N = 7,354a).
Overall Female* Male*
(N = 7,354) (N = 3,948) (N = 3,406)
Prevb AOR 95% CI p-value Prevb AOR 95% CI
p-value
Prevb AOR 95% CI p-value
Underweight(<18.5) 0.57 1.058 (0.902, 1.488)
0.2150 0.61 1.238 (0.983, 1.561)
0.070 0.53 1.145 (0.729, 1.798)
0.556
Normal(18.5–24.9) 19.87 1 1 . . . 20.95 1 1 . . . 18.61 1 1 . . .
Overweight(25.0– 29.9)
40.01 1.163 (1.093, 1.237)
<0.0001 35.89 0.997 (0.905, 1.099)
0.952 44.77 1.245 (1.138, 1.362)
<0.0001
Obese(30) 39.56 1.144 (1.068, 1.226)
<0.001 42.55 1.056 (0.955, 1.168)
0.288 36.08 1.191 (1.078, 1.315)
<0.001
§Total Hours Worked = 10 hours x week-1. Where: Total hours worked = (Primary Occupation (hrs/wk) + (Secondary Occupation (hrs/wk)). AOR—Adjusted Odds Ratio.
Variables forced into the model as covariates: Age, Income, Background, Acculturation, Cigarette Use, Energy Consumed, Transportation Physical Activity, and Leisure Time Physical Activity.
a.7,354 individuals had non-missing values for total hours worked and all covariates. b.Adjusted prevalence.
weight individuals. By extension, being underweight may be negatively associated with employ-ment due to the effects of poor health and disability rather than BMI.
Our lack of significant findings with the SROA data, which are in line with findings from
Chau et al. [42], contrast with our findings that used constructed measures of Weekly OA.
When we examined the association of Weekly OA and overweight/obesity, for our overall pop-ulation, as well as males, we observed a positive association with the adjusted odds of being either overweight or obese compared to normal weight. The more occupationally active partici-pants were, the greater their adjusted likelihood of being overweight or obese. Such results appear to be counterintuitive from the perspective of energy balance considerations. However, there were several factors that we were only partially account for (i.e., LTPA and TPA) and that may have contributed to an overall positive energy balance. In contrast to our study, previous
studies [27,42,43] have demonstrated a higher association of overweight and obesity with low
activity occupations compared to high activity occupations.
The unadjusted associations of LTPA with BMI categories in our study demonstrated a greater proportion of overweight and obese individuals who reported no LTPA, and a smaller proportion of overweight and obese individuals who reported vigorous LTPA compared to
normal weight individuals (S2 Table), consistent with 2004–2006 NHANES data as reported
by Archer et al. [44]. Such observations may underscore the potential importance of LTPA as a
determinant of overweight/obesity and highlight the need to explore the dynamics of the rela-tionships among Weekly OA, Total Hours Worked, and LTPA.
In light of these considerations, we explored the impact of the Total Hours Worked per week on overweight/obesity. Our results demonstrated that for both overall population and for males, adjusted odds of being overweight or obese compared to normal weight, increased sig-nificantly for each 10-hour increment of work per week, whether in one or more than one
occupation. Similarly, Luckhaupt et al. [45] and Jang et al. [46] reported significant associations
of long work hours with obesity for all workers, and for males employed in“manual”
occupa-tions, respectively. These findings support the observation, that working extended hours, inde-pendent of the physical activity attributable to the occupation, is the critical factor linking
occupation and overweight/obesity. Perhaps, it is that long work hours“crowd out”time and
motivation available for LTPA.
Access to LTPA, as a consistent part of one’s lifestyle, may be dependent upon available
time and money, both of which are likely to accrue through higher education and income.
Bonauto et al. [43] found that workers with higher SES tended to have healthier behaviors than
those with lower SES. Kaleta et al. [47] reported significantly increased risk of obesity both
among workers with a primary education compared to university-educated workers, and among low income workers compared to high-income workers, yet no association of BMI with
OA. McLaren [48] demonstrated that the socioeconomic disparities associated with increased
risk of obesity may be explained by higher educational attainment and income, which may cor-relate with higher expectations specific to personal health, appearance, and adequate economic capacity to purchase healthy but more expensive food items, and increased opportunities for LTPA.
We found that employed participants in the HCHS/SOL tended to have low income levels
and almost 55% reported no LTPA. Trivedi, et al. [49] reported that a higher prevalence of
obe-sity among rural residents was accompanied by higher prevalence of no LTPA and failure to meet recommended LTPA levels compared to urban dwellers. Moreover, Caban-Martinez
et al. [50] found a lower prevalence of recommended LTPA levels reported among Hispanic
multifactorial manner, owing to diminished physical capacity after a demanding work sched-ule, lack of free time to engage in such activities, or limited economic resources that preclude participation in LTPA.
Strengths and Limitations
One of the strengths of this study is that the HCHS/SOL is a large, population-based cohort that used a sampling method that permits findings that are free of outcome-based selection bias. Probability sampling of the participants, from communities selected for Hispanic/Latino background diversity, allow for inferences beyond the selected sample to urban dwelling
His-panic/Latino populations within the four geographical regions [30]. However, the
cross-sec-tional nature of the study design and data analysis precludes provision of temporal relations or causal inferences for the associations found. Additionally, selected variables in the analyses are based upon self-report and, as such, differential recall may have been a factor affecting data by under- or over-reporting.
An additional strength of our findings is that the measures used to estimate Weekly OA
were derived from detailed, population-based MET estimates assigned to occupations [34], as
opposed to self-report data. The estimates of energy consumption were collected via methods
that have been validated in comparison to objective measures by some authors [37,38] yet
questioned by others [11,12,51]. Although our multivariable analyses attempted to apply
energy balance considerations, quantative measures of several PA domains were missing, restricting the control of a comprehensive energy balance equation. An important direction for future research could be to combine objective PA assessment (e.g., accelerometer) with a diary of PA domains over the same time period. This way the objective measure of PA levels can be better separated by activity domain (OA, LTPA, TPA, lifestyle, etc.) and provide a more com-prehensive examination of energy expenditure.
Conclusions
This study presents the first findings on the association between OA with overweight/obesity among Hispanics/Latinos in the U.S. The size and rapid growth of this segment of the popula-tion, combined with the high prevalence of overweight (39%) and obesity (38%) reported for employed individuals in this study, underscores the importance of better identifying and understanding the determinants of the obesity epidemic among U.S. Hispanics/Latinos. The finding that increasing Weekly OA was associated with increasing odds of overweight and obe-sity compared to normal weight suggests that the workplace is only one part of the overall energy expenditure dynamic contributing to overweight/obesity. Moreover, our finding that the Total Hours Worked may be the critical factor in workplace, rather than the activity level of the particular occupation, underscores that time in the workplace may impact energy expen-diture outside of work, particularly with respect to LTPA. An implication of this study, consis-tent with the goals of Healthy People 2020 to increase health promotion programs in the
workplace [52] is to increase workplace interventions and target occupations where risk of
obe-sity is greatest. Perhaps, targeting individuals in“high-risk”occupations that require especially
long work hours, by promoting and incentivizing LTPA interventions, may prove to be effec-tive instruments to combat the obesity epidemic.
Supporting Information
S1 Table. Occupational Categories.S2 Table. Unadjusted bivariate associations within BMI categories and characteristics of employed individuals participating in the Hispanic Community Health Study/Study of Latinos (HCHS/SOL), United States 2008–2011 (n = 7,409).Unadjusted column percent (95% CL), Mean (SE).
(DOCX)
Acknowledgments
The authors thank the staff and participants of HCHS/SOL for their important contributions.
Investigators website—http://www.cscc.unc.edu/hchs/.
Author Contributions
Conceived and designed the experiments: RHS MS. Analyzed the data: RHS MS SMD NMG. Wrote the paper: RHS MS MDG EA. Drafted the work or revised it critically for important intellectual content: MS MDG EA SMD NMG DMX CB YD HDH REZ. Provided final approval of the version to be published: MS MDG EA SMD NMG DXM CB YD HDH REZ. Agreed to be accountable for all aspects of the work in ensuring that questions related to the accuracy or integrity of any part of the work are appropriately investigated and resolved: MS MDG EA SMD NMG DXM CB YD HDH REZ.
References
1. Flegal KM, Carroll MD, Ogden CL, Curtin LR. (2010) Prevalence and trends in obesity among US adults, 1999–2008. JAMA 303: 235–241. doi:10.1001/jama.2009.2014PMID:20071471
2. Flegal KM, Graubard BI, Williamson DF, Gail MH. (2005) Excess deaths associated with underweight, overweight, and obesity. JAMA 293: 1861–1867. PMID:15840860
3. Centers for Disease Control and Prevention (CDC) (2009) Differences in prevalence of obesity among black, white, and Hispanic adults—United States, 2006–2008. Available:http://www.cdc.gov/mmwr/ preview/mmwrhtml/mm5827a2.htm, Accessed: April 29, 2012 23:27.
4. Prospective Studies Collaboration, Whitlock G, Lewington S, Sherliker P, Clarke R, Emberson J, et al. (2009) Body-mass index and cause-specific mortality in 900 000 adults: collaborative analyses of 57 prospective studies. Lancet 373: 1083–1096. doi:10.1016/S0140-6736(09)60318-4PMID:19299006
5. Finkelstein EA, Fiebelkorn IC, Wang G. (2003) National medical spending attributable to overweight and obesity: how much, and who's paying? Health Aff (Millwood) Suppl Web Exclusives: : W3-219-26.
6. Centers for Disease Control and Prevention (CDC). (2004) Prevalence of no leisure-time physical activ-ity—35 States and the District of Columbia, 1988–2002. MMWR Morb Mortal Wkly Rep 53: 82–86. PMID:14762333
7. Centers for Disease Control and Prevention (2010) 1988–2008 No Leisure-Time Physical Activity Trend Chart. Available:http://www.cdc.gov/nccdphp/dnpa/physical/stats/leisure_time.htm. Accessed: Nov. 4, 2012 17:54.
8. Duffey KJ, Popkin BM. (2011) Energy density, portion size, and eating occasions: contributions to increased energy intake in the United States, 1977–2006. PLoS Med 8: e1001050. doi:10.1371/ journal.pmed.1001050PMID:21738451
9. Shao Q, Chin KV. (2011) Survey of American food trends and the growing obesity epidemic. Nutr Res Pract 5: 253–259. doi:10.4162/nrp.2011.5.3.253PMID:21779530
10. Hasselbalch AL, Heitmann BL, Kyvik KO, Sorensen TI. (2010) Associations between dietary intake and body fat independent of genetic and familial environmental background. Int J Obes (Lond) 34: 892– 898.
11. Archer E, Hand GA, Blair SN. (2013) Validity of U.S. nutritional surveillance: National Health and Nutri-tion ExaminaNutri-tion Survey caloric energy intake data, 1971–2010. PLoS One 8: e76632. doi:10.1371/ journal.pone.0076632PMID:24130784
13. Archer E, Lavie CJ, McDonald SM, Thomas DM, Hebert JR, Taverno Ross SE, et al. (2013) Maternal inactivity: 45-year trends in mothers' use of time. Mayo Clin Proc 88: 1368–1377. doi:10.1016/j. mayocp.2013.09.009PMID:24290110
14. Archer E, Shook RP, Thomas DM, Church TS, Katzmarzyk PT, Hébert JR, et al. (2013) 45-Year trends in women's use of time and household management energy expenditure. PLoS One 8: e56620. doi: 10.1371/journal.pone.0056620PMID:23437187
15. Church TS, Thomas DM, Tudor-Locke C, Katzmarzyk PT, Earnest CP, Rodarte RQ, et al. (2011) Trends over 5 decades in U.S. occupation-related physical activity and their associations with obesity. PLoS One 6: e19657. doi:10.1371/journal.pone.0019657PMID:21647427
16. Hill JO. (2006) Understanding and addressing the epidemic of obesity: an energy balance perspective. Endocr Rev 27: 750–761. PMID:17122359
17. Thomas DM, Ciesla A, Levine JA, Stevens JG, Martin CK. (2009) A mathematical model of weight change with adaptation. Math Biosci Eng 6: 873–887. doi:10.3934/mbe.2009.6.873PMID:19835433
18. Hall KD, Sacks G, Chandramohan D, Chow CC, Wang YC, Gortmaker SL, et al. (2011) Quantification of the effect of energy imbalance on bodyweight. Lancet 378: 826–837. doi:10.1016/S0140-6736(11) 60812-XPMID:21872751
19. Jitnarin N, Kosulwat V, Rojroongwasinkul N, Boonpraderm A, Haddock CK, Poston WS. (2010) Risk factors for overweight and obesity among Thai adults: results of the National Thai Food Consumption Survey. Nutrients 2: 60–74. doi:10.3390/nu20100060PMID:22253992
20. Singh GK, Siahpush M, Hiatt RA, Timsina LR. (2011) Dramatic increases in obesity and overweight prevalence and body mass index among ethnic-immigrant and social class groups in the United States, 1976–2008. J Community Health 36: 94–110. doi:10.1007/s10900-010-9287-9PMID:20549318
21. Proper KI, Hildebrandt VH. (2010) Overweight and obesity among Dutch workers: differences between occupational groups and sectors. Int Arch Occup Environ Health 83: 61–68. doi: 10.1007/s00420-009-0438-1PMID:19506894
22. Martin AR, Nieto JM, Ruiz JP, Jimenez LE. (2008) Overweight and obesity: the role of education, employment and income in Spanish adults. Appetite 51: 266–272. doi:10.1016/j.appet.2008.02.021 PMID:18406494
23. Allman-Farinelli MA, Chey T, Merom D, Bauman AE. (2010) Occupational risk of overweight and obe-sity: an analysis of the Australian Health Survey. J Occup Med Toxicol 5: 14. doi: 10.1186/1745-6673-5-14PMID:20550716
24. McLaren L, Godley J. (2009) Social class and BMI among Canadian adults: a focus on occupational prestige. Obesity (Silver Spring) 17: 290–299.
25. Panasiuk L, Wdowiak L, Paprzycki P, Lukas W. (2008) Occurrence of overweight and obesity among adult rural population in Eastern Poland. Relationship between obesity and selected socio-economic factors. Ann Agric Environ Med 15: 149–152. PMID:18581994
26. King GA, Fitzhugh EC, Bassett DR Jr, McLaughlin JE, Strath SJ, Swartz AM, et al. (2001) Relationship of leisure-time physical activity and occupational activity to the prevalence of obesity. Int J Obes Relat Metab Disord 25: 606–612. PMID:11360141
27. Steeves JA, Bassett DR Jr, Thompson DL, Fitzhugh EC. (2012) Relationships of occupational and non-occupational physical activity to abdominal obesity. Int J Obes (Lond) 36: 100–106.
28. Barberio A, McLaren L. (2011) Occupational physical activity and body mass index (BMI) among Cana-dian adults: does physical activity at work help to explain the socio-economic patterning of body weight? Can J Public Health 102: 169–173. PMID:21714313
29. U.S. Bureau of Labor Statistics (2014) Labor Force Statistics from the Current Population Survey: Employed persons by occupation, race, Hispanic or Latino ethnicity, and sex. Available:http://www.bls. gov/cps/cpsaat10.htm. Accessed: June 30, 2014 14:22.
30. LaVange LM, Kalsbeek WD, Sorlie PD, Aviles-Santa LM, Kaplan RC, Barnhart J, et al. (2010) Sample design and cohort selection in the Hispanic Community Health Study/Study of Latinos. Ann Epidemiol 20: 642–649. doi:10.1016/j.annepidem.2010.05.006PMID:20609344
31. Sorlie PD, Aviles-Santa LM, Wassertheil-Smoller S, Kaplan RC, Daviglus ML, Giachello AL, et al. (2010) Design and implementation of the Hispanic Community Health Study/Study of Latinos. Ann Epi-demiol 20: 629–641. doi:10.1016/j.annepidem.2010.03.015PMID:20609343
32. National Heart, Lung, and Blood Institute. (2012) Aim for a Healthy Weight: Assessing Your Weight and Health Risk. Available:https://www.nhlbi.nih.gov/health/public/heart/obesity/lose_wt/risk.htm. Accessed: April 9, 2013.
34. Tudor-Locke C, Ainsworth BE, Washington TL, Troiano R. (2011) Assigning metabolic equivalent val-ues to the 2002 census occupational classification system. J Phys Act Health 8: 581–586. PMID: 21597131
35. E. Patterson (2010) Guidelines for Data Processing and Analysis of the International Physical Activity Questionnaire (IPAQ)–Short and Long Forms. Available:https://docs.google.com/viewer?
a=v&pid=sites&srcid=ZGVmYXVsdGRvbWFpbnx0aGVpcGFxfGd4OjE0NDgxMDk3NDU1YWRlZTM. Accessed: June 7, 2014.
36. Physical Activity Guidelines Advisory Committee. (2008) Physical Activity Guidelines Advisory Commit-tee Report. Washington, DC: U.S. Department of Health and Human Services, 2008.
37. Tooze JA, Kipnis V, Buckman DW, Carroll RJ, Freedman LS, Guenther PM, et al. (2010) A mixed-effects model approach for estimating the distribution of usual intake of nutrients: the NCI method. Stat Med 29: 2857–2868. doi:10.1002/sim.4063PMID:20862656
38. National Cancer Institute, U.S. NIH (2013) Usual Dietary Intake: The NCI Method. Available:http:// appliedresearch.cancer.gov/diet/usualintakes/. Accessed: January 8, 2014 15:52.
39. Ogden CL, Carroll MD, Kit BK, Flegal KM. (2014) Prevalence of childhood and adult obesity in the United States, 2011–2012. JAMA 311: 806–814. doi:10.1001/jama.2014.732PMID:24570244
40. Ali SM, Lindstrom M. (2006) Socioeconomic, psychosocial, behavioural, and psychological determi-nants of BMI among young women: differing patterns for underweight and overweight/obesity. Eur J Public Health 16: 325–331. PMID:16162598
41. Imai K, Gregg EW, Chen YJ, Zhang P, de Rekeneire N, Williamson DF. (2008) The association of BMI with functional status and self-rated health in US adults. Obesity (Silver Spring) 16: 402–408.
42. Chau JY, van der Ploeg HP, Merom D, Chey T, Bauman AE. (2012) Cross-sectional associations between occupational and leisure-time sitting, physical activity and obesity in working adults. Prev Med 54: 195–200. doi:10.1016/j.ypmed.2011.12.020PMID:22227284
43. Bonauto DK, Lu D, Fan ZJ. (2014) Obesity prevalence by occupation in Washington State, Behavioral Risk Factor Surveillance System. Prev Chronic Dis 11: 130219. doi:10.5888/pcd11.130219PMID: 24406093
44. Archer E, Hand GA, Hébert JR, Lau EY, Wang X, Shook RP, et al. (2013) Validation of a novel protocol for calculating estimated energy requirements and average daily physical activity ratio for the US popu-lation: 2005–2006. Mayo Clin Proc 88: 1398–1407. doi:10.1016/j.mayocp.2013.08.019PMID: 24290113
45. Luckhaupt SE, Cohen MA, Li J, Calvert GM. (2014) Prevalence of obesity among U.S. workers and associations with occupational factors. Am J Prev Med 46: 237–248. doi:10.1016/j.amepre.2013.11. 002PMID:24512862
46. Jang TW, Kim HR, Lee HE, Myong JP, Koo JW. (2014) Long work hours and obesity in Korean adult workers. J Occup Health 55: 359–366. PMID:23892643
47. Kaleta D, Makowiec-Dabrowska T, Jegier A. (2007) Occupational and leisure-time energy expenditure and body mass index. Int J Occup Med Environ Health 20: 9–16. PMID:17509966
48. McLaren L. (2007) Socioeconomic status and obesity. Epidemiol Rev 29: 29–48. PMID:17478442
49. Trivedi T, Liu J, Probst J, Merchant A, Jhones S, Martin AB. (2015) Obesity and obesity-related behav-iors among rural and urban adults in the USA. Rural Remote Health 15: 3267. PMID:26458564
50. Caban-Martinez AJ, Lee DJ, Fleming LE, LeBlanc WG, Arheart KL, Chung-Bridges K, et al. (2007) Lei-sure-time physical activity levels of the US workforce. Prev Med 44: 432–436. PMID:17321584
51. Ioannidis JP. (2013) Implausible results in human nutrition research. BMJ 347: f6698. doi:10.1136/ bmj.f6698PMID:24231028