MICRORNA PROFILING OF MONOCYTE TO OSTEOCLAST DIFFERENTIATION REVEALS MRNA TARGETS LINKED TO OSTEOCLASTOGENESIS
Katherine A. Guilfoyle
A dissertation submitted to the faculty of the University of North Carolina at Chapel Hill in partial fulfillment of the requirements for the degree of Master of Science in the Department of Periodontology
in the School of Dentistry.
Chapel Hill 2014
Approved by:
Salvador Nares
Ricardo Padilla
ii © 2014
iii
ABSTRACT
Katherine A. Guilfoyle: MiRNA Profiling of Monocyte to Osteoclast Differentiation Reveals mRNA Targets Linked to Osteoclastogenesis
(Under the direction of Salvador Nares)
OBJECTIVES: To investigate differentially expressed microRNAs (miRNAs) and predicted
target genes over 12 days of osteoclastogenesis. METHODS: Leukophoresed buffy coats were
obtained from healthy human donors (N=4) and CD14+ monocytes isolated. Osteoclastogenesis
was induced by culturing cells with sRANKL and M-CSF. Freshly isolated monocytes and
monocytes cultured with M-CSF alone were utilized as controls. At 4 time points, RNA was
isolated and miRNA levels interrogated using microarrays (N=36.) MiRNA-mRNA target
interactions for differentially expressed miRNAs were investigated using publically available
algorithms. RESULTS: MiRNA profiling revealed conserved and differentially expressed
miRNAs; both novel and previously reported in osteoclastogenesis. Several differentially
expressed miRNAs shared predicted mRNA targets and given targets were targeted by multiple
miRNAs. CONCLUSIONS: MiRNA profiling osteoclastogenesis identified previously
associated miRNAs and novel miRNAs not previously described in osteoclast differentiation.
iv
TABLE OF CONTENTS
LIST OF TABLES………..……iv
LIST OF FIGURES………..…..vi
LIST OF ABBREVIATIONS………...………vii
CHAPTER 1: A REVIEW OF OSTEOCLASTOGENESIS AND THE ROLE OF MICRORNA ON OSTEOCLAST DIFFERENTIATION AND FUNCTION...………..1
Introduction………...1
Differentiation………..………2
Osteoclast Action……….……3
Disease Pathogenesis……….………..4
MicroRNA Action in Osteoclastogenesis………....9
Conclusion……….12
CHAPTER 2: MIRNA PROFILING OF MONOCYTE TO OSTEOCLAST DIFFERENTIATION REVEALS MRNA TARGETS LINKED TO OSTEOCLASTOGENESIS...14
v
Materials and Methods……….……..17
Isolation of Monocytes and Differentiation into Macrophages and Osteoclasts………...………17
Flow Cytometry……….17
TRAP Staining………..……….19
Osteolyse™ Assay………...……..19
Cell Viability………..……19
Total RNA Isolation……….………..20
MicroRNA Arrays……….……20
Statistical Analysis……….……20
Network Analysis………...……21
Target Selection………...……..21
Results………...……….22
Discussion……….………….27
FIGURES AND TABLES……….………32
vi
LIST OF FIGURES
Figure 1: Phenotyping data………32
Figure 2: TRAP stain data………..……33
Figure 3: Microscopy data……….……34
Figure 4: Representative Osteolyse™ results………...…….35
Table 1: MiRNAs differentially expressed after Benjamini Hochberg Adjustment….………….36
Figure 5: MiRNAs differentially expressed in M-CSF + sRANKL cells…………...…………...37
Table 2: MiRNAs differentially expressed after Bonferroni correction………38
Figure 6: Signal intensity over time………..…….39
Figure 7: Pathway analysis………40
Table 3: Target gene function from pathway analysis………..….41
Table 4: MiRNAs differentially expressed and osteoclast related gene targets…………...…….44
Figure 8: Signal intensity in up-regulated miRNAs……….…….46
vii
LIST OF ABBREVIATIONS
µL Microliter
ANOVA Analysis of variance
APCs Antigen presenting cells
Ago2 Argonaute RISC catalytic component 2
ASOs Antisense oligonucleotides
BMMs Bone Marrow-derived Monocyte/Macrophages
C5a Complement component 5a
CATK Cathepsin K
CD14 Cluster of Differentiation 14
CD14 Cluster of Differentiation 14 positive
CD28 Cluster of Differentiation 28
CD80 Cluster of Differentiation 80
CD86 Cluster of Differentiation 86
CDw93 Cluster of Differentiation 93
C1qRp C1q Receptor for Phagocytosis Enhancement
CO2 Carbon dioxide
CTLA-4 Cytotoxic T-Lymphocyte Antigen 4
DGCR8 DGCR8 microprocessor complex unit
dH2O Distilled water
EDTA Ethylenediaminetetraacetic acid
ETS E26
FACS Fluorescence-activated Cell Sorting
FBS Fetal bovine serum
viii FITC Fluorescein isothiocyanate
FOSL2 Fos-like antigen 2
Fra-1 Fos-related Antigen
IFN-β Interferon Beta
IGF-1 Insulin-like Growth Factor-1
IgG Immunoglobulin G
IL-1 Interleukin 1
logFc Log fold change
LPS Lipopolysaccharide
M Molar
MAPK Mitogen-activated Protein Kinase
MCP-1 Monocyte Chemoattractant Protein-1
M-CSF Macrophage Colony-stimulating Factor
M-CSFR Macrophage Colony-stimulating Factor Receptor
MIP-1α Macrophage Inflammatory Protein 1 alpha
MITF Microphthalmia-associated Transcription Factor
miRNAs MicroRNA
mL Mililiter
MMPs Matrix metalloproteinases
NFATc1 Nuclear Factor of Activated T-cells Cytoplasmic 1
NFI-A Nuclear Factor 1-A
NF-κβ Nuclear Factor Kappa Beta
Ng Nanogram
Nm Nanometer
ix PBS Phosphate buffered saline
PDCD4 Programmed Cell Death 4
PFA Paraformaldehyde
PI3K Phosphoinositide 3-kinase
PTH Parathyroid hormone
RANK Receptor for Activation of Nuclear Factor Kappa Beta
RANKL Receptor for Activation of Nuclear Factor Kappa Beta Ligand
RANTES Regulated on Activation Normal T Cell Expressed and Secreted
RNA Ribonucleic acid
RT-PCR Real-time polymerase chain reaction
SDF-1α Stromal Cell-derived Factor 1 alpha
SOCS1 Suppressor of Cytokine Signaling 1
sRANKL Soluble Receptor for Activation of Nuclear Factor Kappa Beta Ligand TGFβR1 Transforming growth factor, beta receptor
TIMPs Tissue inhibitors of metalloproteinase
TNF-α Tumor necrosis factor-alpha
TRAF6 Tumor Necrosis Factor Receptor-associated Factor 6
TRANKL TRAF Family Member-associated Nuclear Factor Kappa Beta Ligand
TRAP Tartrate resistant acid phosphatase
1
A REVIEW OF OSTEOCLASTOGENESIS AND THE ROLE OF MICRORNA ON OSTEOCLAST DIFFERENTIATIONAND FUNCTION
Introduction
Osteoclasts are multinucleated cells derived from a myeloid lineage, which, through the process
of osteoclastogenesis, differentiate from their hematopoietic precursors;
monocytes/macrophages.1 Osteoclasts were originally confirmed to have a hematopoietic origin
when osteopetrotic mice were apparently cured following injection of normal spleen cells2 and
the hematopoietic origin was later confirmed in humans following a brother-to-sister bone
marrow transplant.3 These observations that the presence of spleen or bone marrow cells together
with stromal cells in fact yielded osteoclasts, was key in our understanding of
osteoclastogenesis.4 These cells play a key role in the remodeling of bone, and thus the
regulation of skeletal mass as resorptive cells; they are unique cells in that they resorb bone.5
When imbalance occurs between the resorptive action of osteoclasts and the bone-forming action
of osteoblasts, pathological conditions, such as osteoporosis may exist. The individual with this
disorder may experience pathological bone fractures due to a reduction in the density of skeletal
mass. A deep understanding of the osteoclast; how it is formed and its action, as well as the
regulation of these processes is important in acquiring an understanding of such disorders, and
may impact future therapeutic goals. MicroRNAs (miRNAs) influence the differentiation
process of osteoclasts on a genetic level. Expression profiles obtained through miRNA analysis,
showing which miRNAs, and thus, which likely target genes are up/down regulated throughout
2
Differentiation
In 1990, Udagawa et al. noted that marrow stromal cells or osteoblast progeny must be
present for the in vitro maturation of macrophages to osteoclasts to occur.1 Two molecules are expressed that are necessary to promote osteoclastogenesis: macrophage colony-stimulating
factor (M-CSF), a polypeptide growth factor, and receptor for activation of nuclear factor kappa
beta (NF-κβ) (RANK) ligand (RANKL), a TNF-related cytokine.6, 7 M-CSF promotes the
proliferation and survival of osteoclast progenitor cells, while RANKL prompts the
differentiation through the osteoclast lineage and acts as both an activating and survival factor
for mature osteoclasts.8-10 M-CSF1 binds its receptor c-FMs on osteoclast precursors and signals
the survival and proliferation of the cells. For osteoclastogenesis to occur, osteoclast precursors
must be in contact with stromal cells or osteoblasts, 1 as RANK, found on osteoclasts and their
precursors, interacts with RANKL, which resides on stromal cells.7 RANK-RANKL binding is
essential for bone remodeling, as shown in mice deficient in either RANK or RANKL, sharing
the same phenotype.11-14 RANK-RANKL interaction stimulates downstream signaling cascades,
including mitogen-activated protein kinase (MAPK) pathway, phosphoinositide 3-kinase (PI3K)
and NF-κβ.10, 15 RANKL is able to activate mature osteoclasts in vitro in a dose-dependent
manner and activate pre-existing osteoclasts in vivo; rapidly leading to bone resorption.11, 16, 17 It leads to induction of osteoclastogenic transcription factors c-Fos, fos-related antigen 1 (Fra-1)
and cytoplasmic, calcineurin-dependent nuclear factor of activated T-cells cytoplasmic 1
(NFATc1.)10, 18-21 M-CSF and RANKL are both necessary for the promotion of
osteoclastogenesis, and they are needed to induce expression of genes that encode
3
so that mature osteoclasts may develop.11 Simon et al. noted in 1997 that overexpression of
osteoprotegrin (OPG) blunts osteoclastogenesis in mice, and those animals lacking OPG were
noted to have accelerated osteoclastogenesis and thus developed osteoporosis22. OPG, a secreted
TNFR-related protein which regulates density and mass of bone, 22, 23 is a “decoy” receptor,
which competes with RANK on osteoclasts and their precursors for RANKL.7 The amount of
bone resorbed is dictated by a shift in balance between RANKL, which stimulates
osteoclastogenesis; and OPG, the inhibitor.24 As further evidence that the protein complex, NF-κβ plays a key role in osteoclastogenesis, mice that lack the p50 and p52 subunits of the complex
develop osteopetrosis due to the inability of osteoclasts to differentiate from macrophages.25 The
survival of the mature osteoclast is regulated by hormones and cytokines11, 26 and it has been
shown that RANKL and interleukin (IL)-1 increase survival time both in vitro and in vivo; possibly due to their ability to induce NF-κβ.27, 28
Osteoclast Action
Osteoclasts are unique, multinucleated, bone resorptive cells, which degrade bone tissue
in a multistep process. With its “ruffled membrane,” the osteoclast is able to polarize on bone,
forming a resorptive organelle, which is only present when the cell is attached to bone tissue.29
Polarization of the osteoclast cell body occurs in response to RANK activation by RANKL16
leading to structural changes, including the rearrangement of the actin cytoskeleton and the
formation of a tight junction, a sealed compartment between the bone and basal membrane of the
cell.11, 16 The export of hydrogen ions leads to the acidification of this “vacuole” 11, 30 and lytic
enzymes, such as tartrate resistant acid phosphatase (TRAP) and pro-cathepsin K (pro-CATK)
4
products are produced, including fragments of collagen and solubilized calcium and phosphate;
which after processing by the osteoclast, are released into circulation.11
Several genes or loci regulate osteoclastogenesis and the activation of the mature
osteoclast in either positive or negative fashions. This has been shown through both naturally
occurring mutations and targeted knockout mutations in animals and humans.11, 31, 32 Disruption
of gene activity may lead to osteopetrosis or osteopenic conditions. The effects of genes may be
exerted at various steps of osteoclast development and activation; for example, PU.1 and op/CSF-1 act during the formation and survival of osteoclast precursor cells, while other genes, such as RANK, p50/p52 rel and fos affect the differentiation of these precursor cells towards a multinucleated cell,11 as discussed previously. PU.1 encodes a transcription factor of the E26 or ETS family and activates gene expression during myeloid cell development, while op/CSF-1,
encodes a key cytokine to macrophage production, differentiation and function. Other genes,
such as src, oc/Tcirg and CATK affect the actions of the mature osteoclast, such as its ability to adhere to bone and perform lytic functions11.
Disease Pathogenesis
In health and in young adults, the destruction and formation of bone is balanced, with
osteoclasts resorbing bone in approximately 3 weeks per site, and osteoblasts forming new bone
tissue in approximately 3-4 months.29 This process is normal and necessary for bone to carry out
its supportive and mechanical functions. The influences by mechanical use33, 34 as well as the
likely influence of central homeostatic factors35 help guide the resorption and rebuilding of bone,
to maintain a steady state.36 A majority of skeletal diseases occurring in adults are due to an
5
that resorption is increased.36 Such skeletal diseases include osteoporosis, periodontal disease,
rheumatoid arthritis, multiple myeloma and metastatic cancers.11
Osteoporosis is a systemic skeletal disease which is characterized by a decrease in bone
mass, leading to increased bone fragility and risk of fracture.37 Approximately 70 million
individuals worldwide are at risk, and bone fractures in those with osteoporosis may potentially
be life-threatening occurrences.11 The peak bone mass is reached in the third decade of life; and although a ‘physiologic’ age-related change, the mass decreases approximately 0.5% per year.38, 39
Several factors, such as genetics, nutrition and physical activity increase the risk of fractures
along with age-related bone loss; however, this bone loss alone does not necessarily predispose
one to fractures.39, 40 Two types of osteoporosis have been classified; due to pathophysiology
and regions affected: post-menopausal osteoporosis and senile osteoporosis. Post-menopausal
osteoporosis is due to decreased estrogen levels in post-menopausal women, it mainly affects
trabecular bone, and is associated with vertebral and wrist fractures.39, 41 Estrogen helps to
regulate the activity of osteoclasts, and so, low estrogen levels during menopause facilitate the
differentiation and activity of osteoclasts. Simultaneously, available osteoblast numbers, as well
as osteoblastic activity is decreased due to hormone-independent mechanisms.39, 42 Senile
osteoporosis occurs at a similar rate in both sexes, usually after the sixth decade of life, and
affects cortical bone most frequently; predisposing individuals to hip fracture.39, 43 In senile
osteoporosis; osteoclast activity levels are high and osteoblast availability/activity is reduced due
to decreased osteoblast differentiation from mesenchymal cells, which have undergone a shift to
differentiate into adipocytes; an increasing marrow fat infiltration that affects survival and
function of osteoblasts; and high levels of osteoblast apoptosis. These mechanisms, which occur
6
areas that have weakened; and so, leaving it predisposed to the occurrence of fracture.39, 43, 44
Changes in cell-to-cell communication which occur with age, also affect osteoporotic bone,
making it more fracture-prone; the most common changes being an increase in RANKL, a
decrease in OPG45 and an increased level of sclerostin,46 which is released by osteocytes and
inhibits osteoblast activity.39
Osteopetrosis is condition which is characterized by abnormally high levels of
mineralized bone and cartilage; and occurs when the development and/or function of mature
osteoclasts is negatively affected.11 There are either a decreased number of osteoclasts or the
cells are defective in function.47 The condition was first reported in 1904 by Albers-Schönberg,
who described it as “marble bone disease.”47, 48 A variety of manifestations result from
osteopetrosis, ranging from mild symptoms to death at an early age.47 The bone marrow space
may become crowded, leading to inability to produce red blood cells, white blood cells and
platelets,47, 49, 50 thus resulting in anemic conditions and chronic infections47 due to these reduced
blood cell counts. These effects upon the bone marrow are usually noted in the autosomal
recessive form of osteopetrosis; with other manifestations including hearing loss, blindness,
macrocephaly hepatosplenomegaly, short stature, abnormalities in the dentition and failure to
thrive Children affected by this condition have a 98-99% mortality rate by the age of 10 years.47, 49, 50
An autosomal dominant form exists, with less severe manifestations and a typically later
diagnosis. Loss of vision with optic atrophy is a common neurological finding, occurring due to
bony encroachment upon the optic nerve47, 49, 51 Pathological bone fractures occur as well, and
this finding typically leads to the diagnosis in later childhood or adulthood.47, 49, 51 One must
7
the bone present is not of the same quality as that formed through normal resorption and
remodeling processes. Fractures occur due to the bone quality, not quantity.
Periodontal disease and peri-implant bone loss are affected by the actions of osteoclasts.
In periodontal disease, periodontal pathogens trigger inflammatory and immune responses,
which affect the clinical outcome of the condition; such as loss of alveolar bone and connective
tissue attachment. Inflammatory mediators trigger the bone resorption and proteases which
degrade the extracellular matrix, leading to tissue destruction.52-56 To this day, much remains
unknown with regards to the activation of osteoclasts as it relates to periodontal disease
pathology, and a better understanding is key in the evolution of new treatments for
periodontitis.57 Garlet et al. 2004 investigated expression patterns of mRNAs which encoded for
matrix metalloproteinases (MMPs), tissue inhibitors of metalloproteinase (TIMPs), RANKL and
OPG by real-time polymerase chain reaction (RT-PCR) and correlated patterns with cytokine
expression within gingival biopsies from healthy subjects and those with chronic and aggressive
periodontitis. The study noted that the aggressive and chronic periodontitis groups displayed
similar levels of expression of MMPs, RANKL and TNF-α; however, the expression of TIMPs,
OPG and IL-10 were higher in those with chronic periodontitis. The authors suggest that the
higher expression of OPG in those with chronic periodontitis (compared to those with aggressive
periodontitis) could perhaps partially control the alveolar bone loss driven by RANKL, reducing
the progression rate and severity of this form of periodontal disease. Lower expression of OPG
in aggressive periodontitis would then be a potential influence of more severe disease56 with
regard to progression rate of bone loss. The study concludes that the pattern of cytokines
expressed in the two disease forms affects the progression and severity of disease through effects
8
effects of chemoattractants in periodontitis tissues upon osteoclast chemotaxis using the
EZ-TAXIScan™ method, which measures the chemotactic speed and angle through a concentration
gradient between a glass plate and thin microfabricated silicon chip, or channel.57 The
chemotactic responses of day 3 and 6 osteoclasts to several chemoattractants expressed in
periodontitis tissue were measured, including MCP-1, MIP-1α, RANTES, SDF-1α and C5a. The
highest chemotactic response of day 6 osteoclasts, with regards to chemotactic speed, direct
migration and percentage of chemotactic cells, was noted to be towards C5a. Furthermore, the
speed of chemotaxis towards C5a increased from day 3 to day 6; these findings were in
agreement with Ignatius et al., who found that the expression of the C5a receptor increases
throughout osteoclast differentiation.57, 58 Previous studies have shown that Porphyromonas gingivalis produces Arginine-specific protease gingipain, which results in increased C5a
production.57, 59, 60 C5a is reported to inhibit neutrophil immune activation when within a range
of 10-100nm61-63 and Niwa et al. reported that 100nm of C5a induced the highest chemotactic
response for the day 6 osteoclasts. The authors state that a P. gingivalis-induced increase in C5a must play a role in the progression of periodontitis by suppressing the immune response of
neutrophils while increasing the chemotaxis of osteoclasts.57 Lastly, the Niwa et al. study found
that H-8135, a selective C5a receptor antagonist inhibits both day 3 and 6 osteoclast chemotaxis
towards C5a. Antagonistic activity inhibiting the recruitment of osteoclasts would thus inhibit
the bone resorption by osteoclasts;57 fueling interest in such antagonists for future therapeutic
methods.
A recent study by Kadkhodazadeh et al. investigated the possibility of the RANKL gene
being a genetic determinant for peri-implantitis.64, 65 The study found that a particular genotype
peri-9
implantitis in an Iranian population, and suggested that it could be considered as a genetic
determinant for peri-implantitis.65 Rakic et al. studied the levels of biomarkers in gingival
crevicular fluid associated with osteoclastogenesis (sRANKL, RANK and OPG) in subjects with
peri-implantitis and compared them to levels in those with healthy peri-implant sites and severe
chronic periodontitis sites. When compared to healthy sites, levels of sRANKL, RANK and
OPG were all significantly higher in peri-implantitis sites, although the sRANKL/OPG ratios
were not statistically significantly different. When compared to periodontitis sites, RANK was
significantly higher in peri-implantitis sites; however, sRANKL and the sRANKL/OPG ratio
were significantly higher in periodontitis sites. The authors concluded that while there were
differences in the patterns of the biomarkers in comparison with periodontitis sites, all three were
associated with peri-implant tissue destruction.66
MicroRNA Action in Osteoclastogenesis
As previously discussed in this review, the regulation of osteoclastogenesis is influenced
by M-CSF and RANKL, as well as sex steroids, parathyroid hormone (PTH), vitamin D,
insulin-like growth factor-1 (IGF-1), calcitonin, prostaglandins5, 67 and transcription factors, such as
c-fos, PU.1, NFκβ (p50 and p52 subunits) and nuclear factor of activated T cells cytoplasmic 1
(NFATc1).18, 21, 68-71 Recent studies have shown that microRNAs (miRNAs) are also necessary
for osteoclastogenesis, as they influence osteoclast differentiation, function and survival.71 Gene
silencing studies of DGCR8, Dicer and Ago2 have verified the role of miRNAs in osteoclast
differentiation and function; as these genes are needed for miRNA homeostasis.72-74
MiRNAs are small, non-coding, single-stranded RNAs that measure approximately 19-25
nucleotides in length, and which have been found to regulate several pathways in the cell cycle,
10
expression of an estimated 8000 genes, which amounts to approximately 30% of the human
genome.76-78 Each miRNA may suppress multiple genes; approximately 200, on average; and a
single mRNA can be targeted by multiple miRNAs.77, 79-81 In eukaryotes, miRNAs form
imperfect hybrids, as there is only partial complementarity, with the 3’ untranslated region
(UTR) sequences of target mRNAs, enabling regulation. As a result, translational repression
and/or mRNA degradation occurs.82 MiRNAs have been shown to be associated with actively
translating mRNA83 and several mechanisms may contribute to miRNA-mediated regulation of
genes; which may vary depending on the gene, cell and condition.84
Particular miRNAs have been identified as influential in osteoblast differentiation and
bone formation; while there is limited knowledge regarding the regulatory role of miRNAs in
osteoclastogenesis. MiRNAs involved in osteoblast differentiation and bone formation include,
but are not limited to71 miR-125b,85 miR-26a,86 miR-133 and miR-135,87 miR-204/211,88
miR-29a,89 miR-141 and miR-200a,90 miR-206,91 miR-29b,92 miR-210,93 miR-196a94 and
miR-2861.95
While miRNA function in osteoclastogenesis is not yet completely understood; several
miRNAs have been noted to play a role. Sugatani et al. studied the miRNA signature of
RANKL-induced osteoclastogenesis and showed that 38 miRNAs were elevated and 33 were
downregulated.96 MiRNAs with a known role in the differentiation and function of osteoclasts
include miR-21, miR-223, miR-155 and miR-146a. The overexpression of miR-21 leads to
promotion of c-Fos (a transcription factor which is critical in osteoclastogenesis) through the
down-regulation of programmed cell death 4 (PDCD4) protein levels, via repression removal
from c-Fos.97 Thus, a positive feedback loop exists between miR-21, c-Fos and PDCD4; related
11
RANKL-induced osteoclastogenesis.71, 97 MiR-223 has been shown to stimulate the expression
of macrophage colony-stimulating factor receptor (M-CSFR); however, overexpression of
pre-miR-223 has been found to block the formation of osteoclasts.98 Induction of PU.1 by M-CSF,
will stimulate the expression of this miRNA, which thus down regulates NFI-A, which is needed
to up-regulate M-CSFR levels. Increased expression levels of PU.1, microphthalmia-associated
transcription factor (MITF) and c-Fos are induced by M-CSF and 99RANKL through the
up-regulation of M-CSFR and RANK.73
Sugatani et al. used chemically modified antisense oligonucleotides (ASOs), also known
as antagomirs, which are complementary to specific miRNAs to investigate how essential the
roles of miR-21 and mir-223 were to osteoclastogenesis. Antagomirs were developed for
investigative and therapeutic approaches to silencing miRNAs in vivo. They are cholesterol-conjugated, single-stranded RNA analogs, which can transiently interfere with miRNA.71, 100-102
The ability of antagomirs as specific silencers of endogenous miRNAs have made them useful in
investigating gene functions both in vitro and in vivo71, 99, 103 and in clinical trials via antisense therapeutics.71, 104, 105 Sugatani et al. transduced bone marrow-derived monocyte/macrophage
precursors (BMMs) with antisense miR-21-containing lentivirus and found extreme
up-regulation of PDCD4, which is targeted by miR-21. Remarkable down-up-regulation of
RANKL-induction of c-Fos phosphorylation, and expression of NFATc1 and cathepsin K protein were
noted in cells with reduced levels of miR-21 due to the silencing effect. Thus, normal expression
of miR-21 is relevant to osteoclastogenesis.71, 97 The same group investigated the role of
miR-223 in osteoclastogenesis using antagomirs. It was found that the inhibition of miR-miR-223 induced
up-12
regulated, which resulted in a decrease of M-CSFR levels. It was suggested that miR-223 is
essential for osteoclastogenesis as well, via expression of M-CSFR.71, 73
MiR-155 and miR-146a have been found to significantly down-regulate MITF and
NFATc1, respectively, both of which play important roles in osteoclast differentiation.106, 107
Zhang et al. studied miR-155 targeting of suppressor of cytokine signaling 1 (SOCS1) and MITF
in a murine model. It has been previously shown that miR-155 is induced by IFN-β and that
IFN-β suppresses the differentiation of osteoclasts.10, 107, 108 SOCS1 and MITF promote
osteoclast differentiation by inhibiting IFN-β downstream signaling and by cooperating with
NFATc1,10, 11, 109 respectively.10 Zhang et al. found that mir-155, which is an IFN-β inducible
miRNA, can target SOCS1 and MITF and mediate the suppressive effect of IFN-β on
osteoclastogenesis.10
The effects of miR-146a overexpression upon osteoclastogenesis were studied by Nakasa
et al. in 2001. This study showed in a murine model that miR-146a led to a significant
down-regulation of c-Jun, NFATc1, PU.1 and TRAP. Results further suggested that one mechanism of
osteoclastogenesis suppression was the down-regulation of TNF receptor-associated factor 6,
(TRAF6), a validated target of miR-146a110 and critical signaling molecule in RANKL-mediated
osteoclastogenesis.111-113
Conclusion
The differentiation of monocytes to multinucleated osteoclasts is a complex process
affected by several different transcription factors and genes. As this review discusses, several
pathological conditions arise from a lack of balance between the function of osteoblasts, forming
13
osteoclastogenesis will enable further treatment modalities to be developed for individuals
suffering from these diseases, and perhaps help in prevention someday. The small miRNA, only
approximately 22 nucleotides in length, can have major impacts upon osteoclastogenesis and
disease pathogenesis through the regulation of gene targets. Studies have identified several
miRNAs that play roles in osteoblast and osteoclast differentiation and function; however, as
miRNAs have been studied for only a short period of time thus far, further research into the
identification and characterization of additional miRNAs is needed The future will likely hold
vast and exciting discoveries through the investigation of miRNAs, which may deeply impact
14
MIRNA PROFILING OF MONOCYTE TO OSTEOCLAST DIFFERENTIATION REVEALS MRNA TARGETS LINKED TO OSTEOCLASTOGENESIS
Introduction
Osteoclastogenesis is the process by which bone resorptive cells, osteoclasts, differentiate
from their hematopoietic precursors; monocytes and macrophages.1 The role osteoclasts play in
bone remodeling is important for the regulation of skeletal mass5 and in keeping balance with the
action of bone-forming cells, osteoblasts. In order for osteoclasts to differentiate from their
precursors, two molecules must be expressed: macrophage colony stimulating factor (M-CSF),
which is a polypeptide growth factor; and receptor for activation of nuclear factor kappa β
(NF-κβ) (RANK) ligand (RANKL), which is a TNF-related cytokine.6, 7 These molecules are
necessary as M-CSF promotes both the proliferation and survival of osteoclast progenitors and
RANKL prompts the differentiation along the osteoclast lineage, behaving as an activating and
survival factor for mature osteoclasts.8-10 RANK on the osteoclast must interact with RANKL,
which resides on the stromal cells, for osteoclastogenesis to occur.7 This interaction stimulates
downstream signaling cascades, which include the mitogen-activated protein kinase (MAPK)
pathway, phosphoinositide 3-kinase (PI3K) and NFκβ.10, 15 RANKL induces osteoclastogenic
transcription factors c-Fos, fos-related antigen 1 (Fra-1) and cytoplasmic, calcineurin-dependent
nuclear factor of activated T-cells cytoplasmic 1 (NFATc1.)10, 18-21 Together, M-CSF and
RANKL promote osteoclastogenesis by also inducing the expression of genes that encode
15
integrin7, enabling mature osteoclasts to develop.11 These and many other molecules, including
hormones and cytokines,11, 26 do affect the differentiation and survival of the osteoclast.
Through genetic mutations, occurring both naturally and through targeted knockouts,
several genes or loci have been found to regulate osteoclastogenesis, as well as the activation of
the mature osteoclast.11, 31, 32 Genes may exert their effects at various stages of osteoclast
development and activation, such as the formation and survival of precursor cells, differentiation
to osteoclasts, or survival of the mature osteoclast.11 Disruption of gene activity may influence
occurrence of pathological conditions. Conditions such as osteoporosis and osteopetrosis may
occur when an imbalance exists between osteoclast and osteoblast activity. A deeper
understanding of the process of osteoclastogenesis may help in one day developing new
therapeutic or preventative interventions for such conditions. The study of microRNAs
(miRNAs) may be an informative path to gaining better understanding of osteoclastogenesis and
bone resorptive disease pathogenesis.
MiRNAs are small, non-coding, single-stranded RNAs measuring approximately 19-25
nucleotides in length and have been found to regulate several cellular pathways.75 They have
been found to regulate the expression of an estimated 8000 genes, or approximately 30% of the
human genome.76-78 In eukaryotes, miRNAs form imperfect hybrids with their targets, the 3’
untranslated region (UTR) sequences of mRNAs.82 With this partial complementarity, a miRNA
may target and suppress multiple genes; approximately 200 on average; and a single mRNA may
be targeted by multiple different miRNAs.77, 79-81 MiRNAs have been shown to be necessary for
16
Several miRNAs have been identified as being influential in osteoblast differentiation
and bone formation71, including, miR-125b85, miR-26a86, miR-133, miR-13587, miR-204/21188,
miR-29a89, miR-141, miR-200a90, miR-20691miR-29b 92, miR-21093, miR-196a94 and
miR-286195. Fewer studies have investigated the role of miRNAs in osteoclastogenesis, although
some have been identified. MiRNAs with a known role in the differentiation and function of
osteoclasts include, but are not necessarily limited to miR-21, miR-223, miR-155 and miR-146a.
Mir-21 overexpression has been found to lead to the promotion of C-Fos97, a key
regulator in the osteoclast lineage determination.18 MiR-21 was also found to be robustly
stimulated in RANKL-induced osteoclastogenesis.71, 97 MiR-223 has been shown to stimulate
the expression of M-CSFR; however, overexpression of pre-miR-223 blocks the formation of
osteoclasts.98 Inhibition of miR-223 was noted to down-regulate TRAP-positive osteoclast
formation and decrease M-CSFR levels.71, 73 Zhang et al. found that miR-155, an interferon-β
(IFN-β) inducible miRNA, can target suppressor of cytokine signaling 1 (SOCS1) and
microphthalmia-associated transcription factor (MITF) and mediate the suppressive effects of
IFN-β on osteoclastogenesis.10 Overexpression of miR-146a has been shown to lead to a
significant regulation of c-Jun, NFATc1, transcription factor PU.1 and TRAP. The
down-regulation of TNF receptor-associated factor 6 (TRAF6), a validated target of miR-146a and
critical signaling molecule in RANKL-mediated osteoclastogenesis111-113 has been found to
suppress osteoclastogenesis.110, 111, 113, 114
The aim of this study was to investigate the miRNA profiles of monocyte-to-osteoclast
differentiation using microarrays over a 12 day period. The secondary aim was to identify
differentially expressed miRNAs not previously associated with osteoclast differentiation and
17
Materials and Methods
Isolation of Monocytes and Differentiation into Macrophages and Osteoclasts
Peripheral blood mononuclear cells (PBMCs) were collected from buffy coats
derived from four healthy, human, independent donors (Oklahoma Blood Institute, Oklahoma
City, OK) by density gradient centrifugation, using Ficoll-paque (Amersham, Uppsala, Sweden.)
Monocytes were isolated using CD14 MicroBeads (Miltenyi Biotec, Auburn, CA) following the manufacturer’s instructions and cultured as previously described115, 116
Briefly, the isolated
monocytes are plated in duplicate onto 24-well tissue culture-treated plates (BD Biosciences, San
Jose, CA) at a density of 1.2 x 10⁶cells/cm2 in media consisting of RPMI (Cellgro, Manassas,
VA) at 37 C, 5 % CO2. 10% heat-inactivated fetal bovine serum (FBS, Invitrogen, Carlsbad,
CA) and 50µg/mL gentamycin (Sigma, St. Louis, MO) was added after 2 hours.115, 116 Media
was replaced every 3 days throughout the experiment.
For osteoclast differentiation, monocytes were cultured in the presence of a33ng/ML
M-CSF and 100ng/ML sRANKL (Peptrotech, Offenbach, Germany) over 12 days. Media was
replaced every 3rd day with fresh media containing M-CSF and sRANKL. Freshly isolated
monocytes and monocytes cultured in the presence of M-CSF alone were utilized as controls.
Day 0, 1, 3, 6 and 12, cultures were used for the study.
Flow Cytometry
For phenotyping of monocytes and macrophages, day 0 monocytes and day 6
macrophages were examined via FACS analysis with regards to the antibodies against CD14FITC,
CD86FITC and CDw93FITC. Antibodies were purchased from AbD Serotec (Raleigh, NC) and
used in the following dilutions and formats: CD14FITC 1/400 dilution, IgG1, mouse α-human;
18
α-human. Cells were transferred to a 96-well V bottom plate (BD Falcon), kept on ice for 10
minutes and a pipette tip was used to scrape and vigorously pipette up and down. Plates were
centrifuged at 1600rpm for 5 minutes and re-suspended in 200µL of FACS buffer (ice-cold PBS,
2mM EDTA, 0.5% FBS.) Centrifugation at 1600rpm was repeated for an additional 5 minutes,
then cells were re-suspended in 50µL of FcR block (1/200 dilution, Miltenyi Biotech, α-human.)
50µL of the respective antibodies were diluted 1/100, 50µL of the respective antibody was then
added (2x final concentration for 15 minutes.) Centrifugation was repeated at 1600rpm for 5
minutes. Cells were re-suspended in 200µL of FACS buffer, centrifugation repeated at 1600rpm
for 5 minutes and cells re-suspended once again in 200µL of 4% paraformaldehyde (PFA) (USB,
Affymetrix.) All samples were analyzed by FACS using DellQuest software and data analyzed
using FloJo software (TreeStar Inc., Ashland, OR, USA)
IgG is purified and conjugated to Fluorescein Isothiocyanate Isomer 1 (FITC)- liquid.
CD14 is a glycoprotein containing multiple leucin-rich repeats, and is found anchored to the cell
membrane via glycosylphosphatidylinositol117 and in a soluble form.118 CD14 is expressed on
the surface of monocytes and macrophage, as well as some non-myeloid cells119 and serves as a
pattern recognition receptor120, 121 for several ligands, including leukopolysaccharide (LPS.) In
coordination with other proteins, CD14 helps to mediate the innate immune response to LPS.122
CD86 is expressed on antigen presenting cells (APCs) and provides co-stimulatory signals for
the activation and survival of T-cells. CD86 has been shown to be expressed on freshly isolated
monocytes123 and serves as a co-stimulatory ligand, along with CD80, for CD28/CTLA-4.124
CDw93 is used to mark differentiation of monocytes to macrophages as expression ceases
throughout the differentiation process and is not expressed on macrophages.125 Previously
19
TRAP Staining
Tartrate resistant acid phosphatase (TRAP) staining was performed on day 0, 3, 6 and 12
using 10mg Naphtol AS-MX phosphate, 1mL dH2O, 0.2M sodium acetate, 0.2M acetic acid,
0.3M sodium tartrate, 0.1M acetate buffer and TRAP buffer (pH = 5) at 37°C. Following
removal of medium and washing with PBS, cells were fixed with 10% glutaraldehyde for 15
minutes at 37°C. Following two subsequent washes with PBS, TRAP stain was added for 5
minutes at 37°C. TRAP stain was removed, wells washed with PBS and cells observed using
light microscopy at 20x magnification, to confirm differentiation to osteoclasts.
OsteoLyseTM Assay
The OsteoLyseTM Assay was performed on days 3, 6, and 12. Differentiation was confirmed by microscopy, TRAP + staining and bone resorption using the Osteolyse™ bone
resorption kit (Lonza, Walkersville, MD) according to the manufacturer’s recommendations.
Cells in media containing M-CSF and sRANKL were seeded at a density of 4x10⁵ cells/cm2 onto
the OsteoLyseTM Cell Culture Plate. The macrophages (cultured in the absence of sRANKL)
served as a control group for comparison. Cells were cultured for 6 days, then 200µL of
Fluorophore releasing Reagent was placed in each well of the included black 96-well assay plate.
10µL of cell culture supernatant was added to these wells and after mixing, fluorescence was
measured for each well with excitation of 340nm and emission at 615nm.
Cell Viability
20
96-well plate and 20µL of reagent was added to each well. Following 2 hours of incubation at
37°C, the absorbance was recorded at 490nm using a 96-well plate reader.
Total RNA Isolation
At the indicated collection points, the supernatant was removed and stored separately at
-80◦C. Total RNA was isolated using the miRNeasy mini kit (Qiagen, Gaithersburg, MD) according to manufacturer’s instructions. Isolation was performed on 12 samples
simultaneously. Total RNA concentrations and integrity was evaluated using a NanoDrop
Spectrophotometer (Thermo Scientific, Wilmington, DE) and Bioanalyzer (Agilent, Foster City,
CA), respectively.
MicroRNA Arrays
RNA samples (N=36) were randomly labeled 1-36 (for blinding purposes) and sent to
Exiqon Services (Vedbaek, Denmark) for microarray analysis. RNA quality was confirmed by
Exiqon Services. 225ng of RNA were labeled using the miRCURY LNATM microRNA
Hi-Power Labeling Kit Hy3TM/HY5TM and subsequently hybridized on the miRCURY LNATM
microRNA Array (7th) MicroRNA levels were probed using miRCURY LNATM microRNA
Arrays following the procedures described by the manufacturer.
Statistical Analysis
Statistical analyses of the microarray data were provided by Exiqon services. P-values were corrected for multiple testing by the Benjamini and Hochberg adjustment method. Genes
that have been found to be significant via the one-way ANOVA test were subjected to the
Tukey’s ‘Honest Significant Difference’ test, thus determining which groups contribute the
greatest to the significant difference noted. However, we performed Bonferroni correction upon
21
Benjamini and Hochberg adjustment and Tukey’s ‘Honest Significant Difference,’ a subset of
219 miRNAs (p<0.05) were identified out of the 422 total miRNAs analyzed. Following the Bonferroni correction using the original data, 69 miRNAs were found to be significantly
differentially expressed. Fold change was calculated using the minimum and maximum group
averages, indicating that a fold change was calculated from the greatest change in signal
throughout the differentiation process, not necessarily from day 0-12, although in some miRNAs,
the greatest change occurred from day 0 to day12. Thus, a significant change in expression
levels occurred between two time points within the differentiation period.
Network Analysis
Ingenuity® Pathway Analysis was used to examine networks relating the miRNAs which
were determined to be differentially expressed during osteoclast differentiation (Bonferroni
p<0.05). All miRNAs which had calculated Bonferroni p<0.05 were input and this analysis was not limited to those with a signal intensity in the range of 7.5-14.5, nor a 2-fold change
requirement.
Target Selection
The miRNAs deemed to be significantly differentially expressed, as per Bonferroni
correction were further investigated. Many of these miRNAs were also noted in the top 30
(ranked by p-value) differentially expressed miRNAs throughout differentiation from monocytes to osteoclasts which were provided from Exiqon Services in their data analysis summary. Prior
to target selection, Exiqon Services recommended limiting selection to miRNAs with a fold
change of at least 2-fold as well as average signal intensity in the range of 7.5-14.5. In-silico analysis was performed using MiRWalk127
22
these miRNAs. Genes noted to be predicted targets of a significant, differentially expressed
human miRNA were investigated for involvement in cell differentiation or specifically
osteoclastogenesis and osteoclast function; if the status as a predicted target was agreed upon by
a minimum of three of the four following database programs: miRWalk, miRanda (August 2010
release, http://www.microrna.org/microrna.do), miRDB (April 2009 release,
http://mirdb.org/miRDB/), and TargetScan Version 5.1 (http://targetscan.org/).
Results
Examination of the flow cytometry data reveals that macrophages had differentiated from
peripheral blood monocytes. Figure 1 shows the phenotyping results comparing day 0
monocytes and day 6 monocytes (cultured in M-CSF following monocyte isolation.) Cultures
tested positive for CD14, CD86 and CD93. Data represented in red signifies unstained sample,
blue coloring represents control for the specific isotype; together these account for background
noise and control. Green represents stained sample and the amount of cells positive for the
specific cluster of differentiation. Both freshly isolated monocytes and those cultured with
M-CSF were CD14+ and CD86+; however, only the monocytes were CD93+. This is consistent
with differentiation of the monocytes cultured in M-CSF to macrophages as these latter cells are
CD93-. This phenotyping data confirmed the presence of macrophages through successful
differentiation.
We next sought to confirm the differentiation of monocytes cultured with M-CSF and
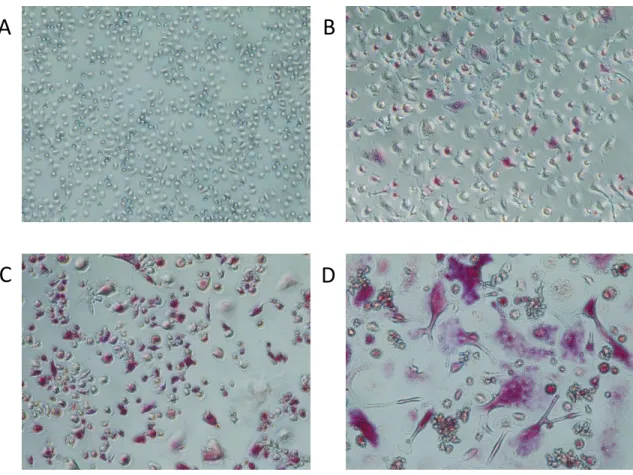
sRANKL to osteoclasts. Figure 2 displays the TRAP staining data for day 0 monocytes and
those cultured in M-CSF and sRANKL at days 3, 6 and 12. TRAP is a glycosylated monomeric
metalloenzyme, which is expressed in mammals,128 which tends to be localized within the ruffled
23
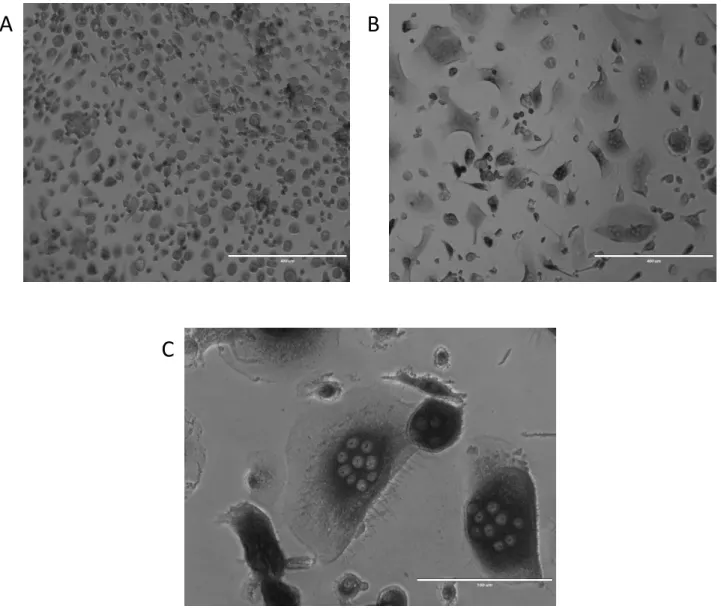
predominant with differentiation to osteoclasts and the multinucleated osteoclasts can be seen
under closer higher magnification. Figure 3 shows day 12 osteoclasts at 40x magnification,
differentiated from the peripheral blood monocytes, clearly noting multiple nuclei and the
fingerlike processes that make up the ruffled border, the structure that facilitates delivery of
enzymes and thus creates an acidic environment for bone degradation.
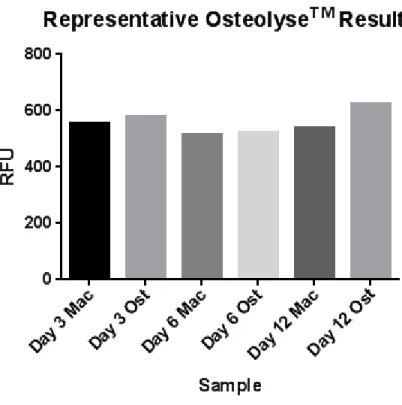
The OsteoLyse™ Assays were performed on days 3, 6 and 12 for cells cultured for the
macrophage lineage (M-CSF) as well as the osteoclast lineage (M-CSF +sRANKL.) This assay
quantitatively measures in vitro osteoclast-mediated bone resorption by directly measuring the release of matrix metalloproteinases into the resorption lacuna of the osteoclast.130 The release
of Eu-labeled collagen fragments was measured after the cell culture supernatant was added to
Fluorophore-Releasing Reagent and counted using time-resolved fluorescence.131 As can be
noted in Figure 4, these results demonstrate very minimal differences at early time points
between macrophage and osteoclasts, prior to day 12. However, the large, multinucleated,
TRAP+ cells noted at day 12 indicate osteoclast differentiation was progressing normally, as
their morphology was clearly different compared to macrophage cultures (Figure 3.)
RNA samples were labeled using the miRCURY LNA™ microRNA Hi-Power Labeling
Kit Hy3™/Hy5™ and hybridized on the miRCURY LNA™ microRNA Array (7th
.) MiRNA
levels were then interrogated using miRCURY LNA™ microRNA Arrays. The manufacturer
reports that the Hi-Power Labeling Kit allows highly efficient and uniform labeling, the
hybridization and washing steps are fully automated, allowing for excellent reproducibility and
arrays are scanned in an ozone-free environment to minimize day to day variation. P-values and Bonferroni correction were calculated for maximum change of expression for each miRNA.
24
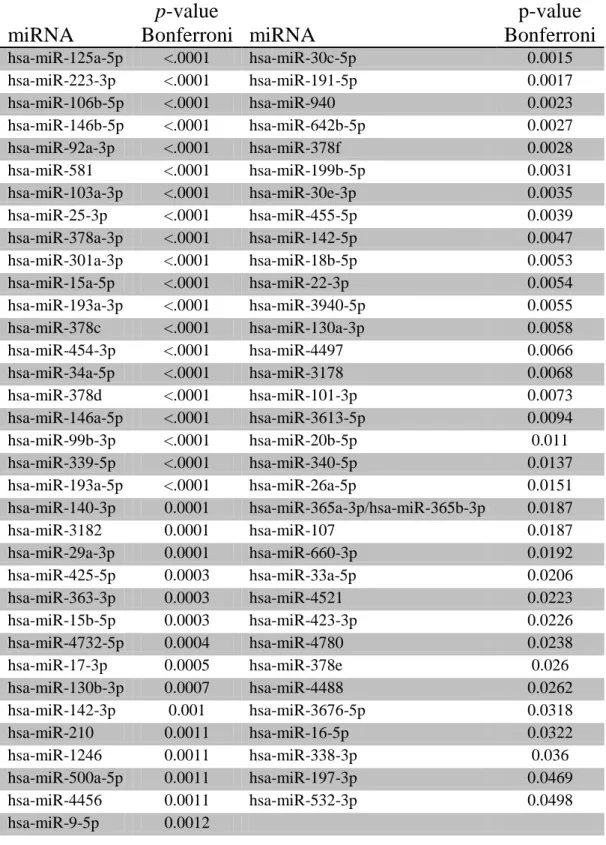
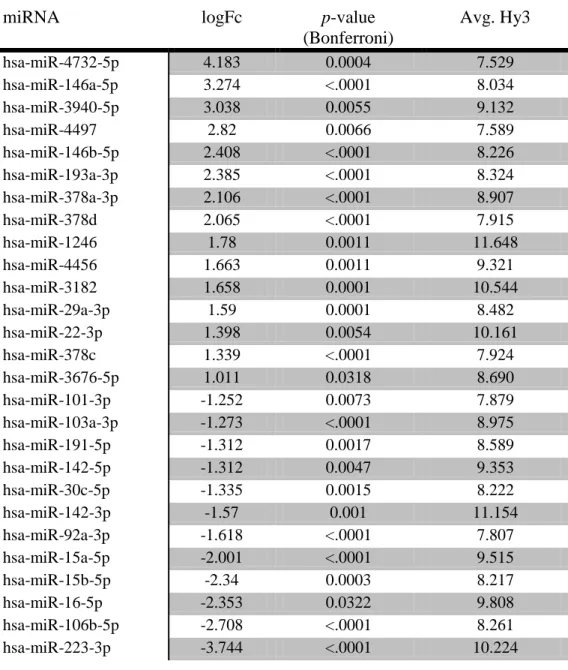
occurred between two different time points. Table 1 lists the 69 miRNAs that were differentially
expressed throughout osteoclast differentiation as per Bonferroni correction (p<0.5). Using these 69 miRNAs, ANCOVA p-values were then calculated for the change in expression value for each day compared to the baseline, day 0. Figure 5 shows that from day 1 to day 12, the number
of miRNAs differentially expressed as compared to baseline increases from 58 on day1 to 64 on
day 3, 67 on day 6 and 69 miRNAs on day 12. Further analysis of target mRNAs was limited to
those with an expression level (average Hy3) within a range of 7.5-14.5 as well as a fold change
of at least 2 (log fold change >1.0, Exicon.) Table 2 shows the 27 remaining miRNAs from the
original list of 69 which were stated to be differentially expressed based on Bonferroni correction
alone. Table 2 lists the miRNAs in order of log fold change, with those at the top being those
that were up-regulated with the greatest log fold change and those at the bottom being those that
were regulated with the greatest log fold change. The negative value indicates
down-regulation of the particular miRNA. 15 of 27 miRNAs were up-regulated throughout the
differentiation of osteoclasts. These include miR-4732-5p, miR-146a-5p, miR-3940, miR-4497,
146b-5p, 193a-3p, 378a-3p, 378d, 1246, 4456, 3182,
miR-29a-3p, miR-22-3p, miR-378c and miR-3676-5p. 12 of the 27 miRNAs were down-regulated
throughout osteoclastogenesis and include miR-101-3p, miR-103a-3p, miR-191-5p, miR-142-5p,
miR-30c-5p, miR-142-3p, miR-92a-3p, miR-15a-5p, miR-15b-5p, miR-16-5p, miR-106b-5p and
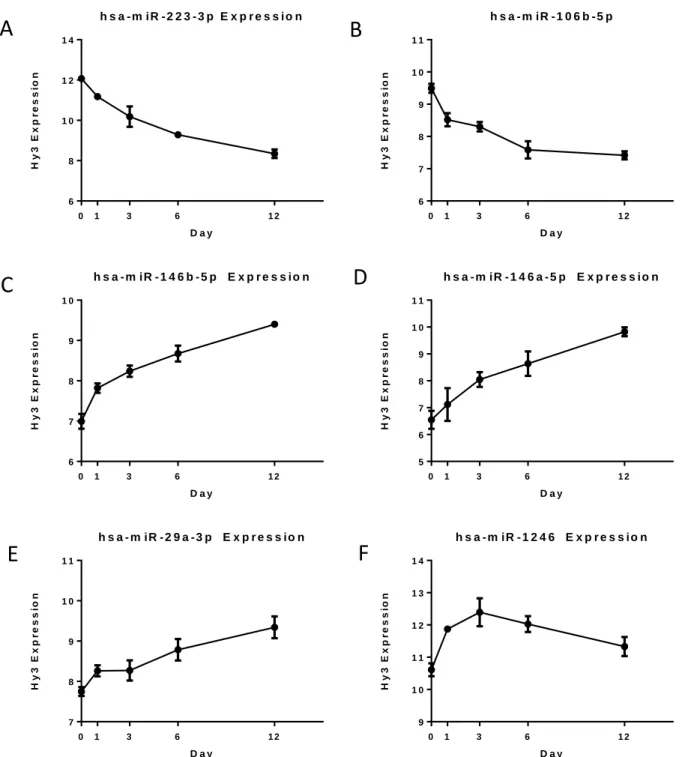
miR-223-3p. Figures 6a-f display the signal or Hy3 expression from day 0-12 for six of these
miRNAs; miR-146b-5p, miR-146a-5p, miR-29a-3p and miR-1246 which have been
up-regulated, and miR-223-3p and miR-106b-5p which have been down-regulated. While the
expression levels of miR-1246 decrease after an initial increase from day 0 to 3, the overall
25
have been entered at each time point and the error bars show mi deviation at each time point.
For a given miRNA, the patterns in expression level change have been fairly consistent between
the donors.
The top 69 differentially expressed miRNAs, as per Bonferroni correction only, were
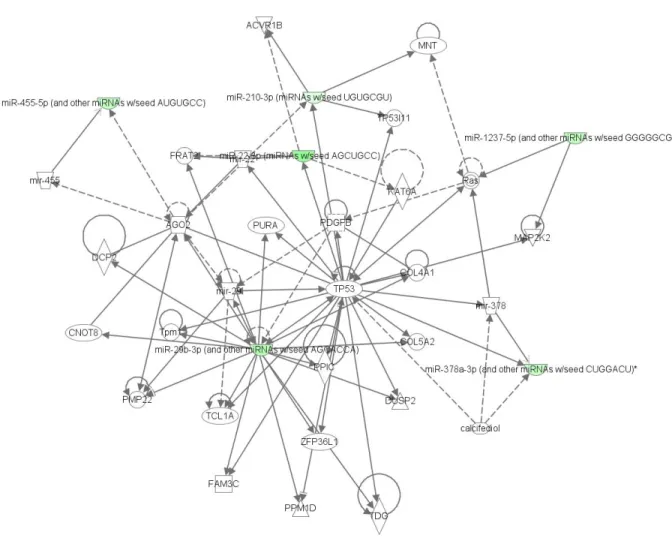
entered into Ingenuity® Pathway Analysis. Figure 7 shows the associated network functions in
relation to cancer, gastrointestinal disease, cellular assembly and organization. MiRNAs
miR-455-5p, miR-455, miR-22-3p, miR-210-3p, miR-29, mir-29b-3p, miR-1237-5p, miR-378 and
miR-378a-3p are shown in this network along with the relationships with the other molecules in
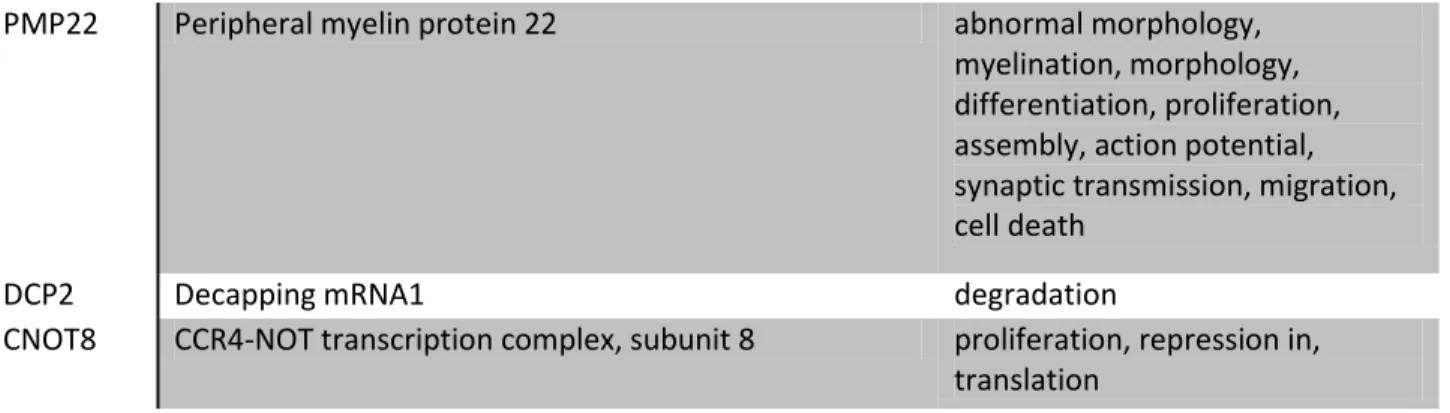
the network. Table 3 lists the genes and their function. The majority of these listed functions
relate cellular proliferation, differentiation and growth, and in some cases, apoptosis.
Target mRNAs were investigated from 27 differentially expressed miRNAs, as per p -value with Bonferroni correction, and limiting for those with expression -value within range of
7.5-14.5 and fold change >2. Targets were initially identified with the miRWALK database,
allowing for comparison with 3 other publically available databases. Table 4 includes a list of
these 27 top differentially expressed miRNAs and target mRNAs noted in miRWALK with a
brief gene description. Only those mRNAs that were noted to have functions or roles in
osteoclastogenesis, and were predicted targets in at least 3 of the 4 databases were included.
When a search did not yield information on targets for a given miRNA on miRWALK, the
miRDB database was used; these mRNAs are marked with an asterisk, as miRDB does not
examine agreement between multiple programs as miRWALK does. Each of the top 30 mRNA
targets was investigated for each miRNA, whether in miRWALK or miRDB. After this, a
manual search was conducted for particular mRNAs known to be associated with
26
column, including miR-3940-5p, miR-4497, miR-378d, miR-378c, miR-3676-5p and
miR-191-5p. For these miRNAs, the investigation did not yield any predicted mRNA targets that were
associated with osteoclastogenesis. Several of the mRNA targets are listed as predicted targets
for multiple miRNAs. For example, FOSL2 is targeted by both miR-193a-3p and miR-92a-3p,
and the members of the FOS gene family have been implicated in regulatory roles of cell
proliferation and differentiation. These are not the only miRNAs that target FOSL2; the miRDB
database indicates that FOSL2 is predicted to target 34 different miRNAs. FOS and FOSB are
also members of this same gene family and are targeted by miR-101-3p and miR-142-5p,
respectively. TGFBR1, which is predicted to be targeted by 151 miRNAs in miRDB, was
targeted by 6 of our top 27 miRNAs, including miR-193a-3p, miR-3182, miR-22-3p,
miR-101-3p, miR-142-5p and miR-142-3p. ITGB3 was predicted to be targeted by miRNAs in miRDB,
and was targeted by 4 of our top 27 miRNAs, including miR-146b-5p, miR-193a-3p, miR-1246
and miR-92a-3p. Both of these genes were proposed to have key roles in RANKL and M-CSF
induced differentiation of osteoclasts as they interacted with many proteins and were noted to be
key nodes in signaling transduction.132
Figures 8 and 9 display the significantly differentially expressed miRNAs that have been
up-regulated and down-regulated, respectively. The least square means were calculated using
the expression values for each donor at every time point for these miRNA. Among the donors,
the expression values for a given miRNA at each time point were closely related (data not
shown.) Both figures display that the levels of expression (average Hy3) at each time point vary
for the different miRNAs, and for a given miRNA, the expression values vary at different time
27
Discussion
The present study examines the miRNA profile and predicted mRNA targets throughout
the process of osteoclastogenesis. Peripheral blood monocytes were isolated from 4
independent, healthy, human donors and cultured in media containing M-CSF and sRANKL to
induce osteoclastogenesis. Day 0 monocytes and macrophages cultured with M-CSF and no
sRANKL were used as for controls for comparison, particularly in confirmation of
differentiation to osteoclasts. Flow cytometry was used to phenotype monocytes and
macrophages, confirming the differentiation to macrophages by comparing day 0 to day 6
samples. At day 6, samples were both CD14 and CD86+ but negative for CDw93, although the
day 0 samples were CDw93+. These findings were typical of differentiation to macrophages as
CDw93 expression is typically lost in monocyte-to-macrophage differentiation. TRAP staining
and the Osteolyse™ assay were then used to confirm differentiation to osteoclasts in the
appropriate samples. In comparison of TRAP stain for samples at days 0, 3, 6 and 12; TRAP
positivity increases with expected osteoclast differentiation. The Osteolyse™ assay was
performed on days 3, 6 and 12 on both samples cultured for macrophage differentiation and
those cultured for osteoclast differentiation. Interestingly, there was little to no difference up to
day 12, between macrophages and osteoclasts. This pattern was consistent in the Osteolyse™
data for all 4 donors. Cody et al. 2011 proposed a different method for generation of osteoclasts
in vitro, by differentiating osteoclasts from bone marrow cells. However, in this study, although they confirmed TRAP+ staining at an earlier time point, they confirmed the presence of
resorption pits using scanning electron microscopy, upon the devitalized bovine cortical bone
their osteoclast precursors were seeded upon. Cody et al. maintained cultures in osteoclastogenic
28
explanation for the similarity in Osteolyse™ data between our samples may be the time point at
which we conducted the assay, which was a maximum of 12 days. However, the large,
multinucleated, TRAP+ cells noted at day 12 clearly indicate osteoclast differentiation was
progressing normally (Figure 3.)
Following total RNA isolation, samples were randomly labeled 1-36 to minimize bias
during the labeling of samples and hybridization onto the arrays. Quality control measures were
repeated by Exiqon to confirm quantity and integrity of the RNA. In addition, Exiqon services
examined the number of miRNAs above background threshold. Numbers were found to be
within the expected range and were found to be comparable for all samples, indicating
comparable quality of samples.
Microarray technology has been used successfully in the past in genomic and biologic
research71, 134 and has been found to enhance binding affinity as well as improve specificity and
sensitivity of miRNA detection.71, 135 To account for high throughput experimental procedures,
such as microarrays, being prone to giving false positive results, Exiqon Services provided
p-values which have been corrected for multiple testing by Benjamini and Hochberg adjustment
method. Controlling for the number of false positives when a large number of statistical tests are
completed simultaneously helps to prevent type I error, where the null hypothesis is incorrectly
rejected.136 MiRNAs which were found to be significantly differentially expressed by one-way ANOVA test were subjected to Tukey’s ‘Honest Significant Difference’ test in order to
determine which groups contributed the most to the significant difference. With the analysis,
throughout monocyte to osteoclast differentiation, 403 of 422 miRNAs analyzed were found to
be up or down regulated, and a subset of 219 miRNAs were shown to be significantly
29
a Bonferroni correction. 69 miRNAs were found to be significantly, differentially expressed (p <0.05) between two time points within the 12 days. MiRNAs with expression levels (Hy3)
within a range of 7.5-14.5 and with a minimum 2-fold change were further selected before
analyzing for target genes (Exiqon.) 27 miRNAs formed the final list of differentially expressed
miRNAs throughout osteoclastogenesis. It is recognized that a less stringent selection criteria
would have revealed more miRNAs and thus targets could be investigated. For example,
miR-210, which was listed in our 69 differentially expressed miRNA but not selected in our final 27,
has been suggested to be involved in TNFα-regulated osteoclast differentiation.137 Future studies
with greater numbers of replicates are required for further evaluation.
Target selection was completed using the publically available mirWALK database, which
allowed for comparison between multiple similar databases. The three that were chosen for
comparison with mirWALK were TargetScan, miRANDA and miRDB. Such programs predict miRNA targets by identifying conserved complementary motifs in the 3’ UTR of target mRNAs
and the seed sequence, or 5’ proximal end of a mature mRNA.71, 138
TargetScan139 and
miRANDA140 are among the most commonly used target prediction programs.71 In 2006,
Sethupathy et al. compared the performance of different computational methods, studying 84
miRNA-target gene interactions, involving a total of 32 miRNAs. The three algorithms
investigated (PiCTar, TargetScan and miRANDA), identified approximately 65% of conserved,
unbiased interactions, which were supported by experiments.77, 141 Although the different
programs do have their individual false positive rates, the comparison of the predictions from the
programs can lead to enhancement of the specificity for prediction of targets. The combination
of the programs could predict approximately 92% of the conserved and verified interactions
30
probability predictions, as algorithms are combined, false negatives may become problematic,
highlighting that the selection of algorithms is critical.142 Thus far, the in silico approach to identifying miRNA targets has been the main method, and it does allow for the identification of
biological roles of miRNAs.77
Our search through mirWALK and miRDB for target mRNAs did not yield any related to
osteoclastogenesis for some of the miRNAs. Although such predicted targets could not be
determined in the present study, this does not mean they do not exist, and future research may
ascertain osteoclast-related targets of these miRNAs. As can be noted in Table 4, miRNAs target
multiple mRNAs, and a given mRNA may be a target for multiple miRNAs. This results from
the partial complementarity with which miRNAs bind to their targets, and as this is over a short
sequence, therein lays a challenge to the identification of target genes.143
This study has some limitations. Although we used biological replicates (4 independent
donors) and evaluated miRNA expression over 12 days (N=36 arrays), a greater number of
replicates and a longer differentiation period (ex. up to 20 days) would likely reveal additional
miRNAs important in the differentiation process. RT-PCR validation will be required to confirm
our array findings, in addition to functional assays (overexpression/knockdown) to confirm the
in-silico findings. Furthermore, as our Osteolyse™ data illustrates, the differentiation process in the present study yielded pre-functional osteoclasts.
In conclusion, 27 miRNAs were differentially expressed throughout 12 day of
osteoclastogenesis, culturing of peripheral blood monocytes in media containing M-CSF and
sRANKL. Several predicted targets associated with osteoclastogenesis were identified for these
31
multiple mRNAs and that individual mRNAs were also targets for multiple miRNA. It has
previously been reported that miRNAs, such as miR-223 and miR-146a are associated with
osteoclastogenesis98,110 To our knowledge, miR-378a and miR-3182, identified in this study,
have not been reported to be associated with osteoclastogenesis in the literature. The miRNAs
investigated in this study may play a crucial role in osteoclastogenesis and thus bone resorptive
disease, providing a basis for further investigations into mRNA targets, disease pathogenesis and
32
FIGURE 1
Figure 1: Phenotyping of day 0 monocytes and day 6 cells cultured with M-CSF using Flow Cytometry with FITC to confirm differentiation to macrophages. Red- unstained, blue- isotype control, green- sample. Both samples are CD14 and CD86 positive. Only the monocytes are CD93+ which is consistent with differentiation to macrophages
33
FIGURE 2
Figure 2: Representative TRAP stain of differentiating osteoclasts (20x magnification.) A) Day 0 monocytes B) Day 3 C) Day 6 D) Day 12 noting progressively larger cells and gain in staining intensity. Note multinucleated
morphology of day 12 cultures.
A
B
34
FIGURE 3
Figure 3: Representative cells at two time points. A) Day 0 monocyte B) Day 12 osteoclast, note multinucleated cells C) Day 12 osteoclast note large, multinucleated cell with ruffled borders.
A
B
35
FIGURE 4
Figure 4: Representative Osteolyse™ results; performed on days 3, 6 and 12 on macrophage and osteoclast lineage samples. Note little to no difference between time points and between macrophages and osteoclasts up to day 12.
36
TABLE 1
miRNA
p
-value
Bonferroni
miRNA
p-value
Bonferroni
hsa-miR-125a-5p <.0001 hsa-miR-30c-5p 0.0015 hsa-miR-223-3p <.0001 hsa-miR-191-5p 0.0017
hsa-miR-106b-5p <.0001 hsa-miR-940 0.0023
hsa-miR-146b-5p <.0001 hsa-miR-642b-5p 0.0027
hsa-miR-92a-3p <.0001 hsa-miR-378f 0.0028
hsa-miR-581 <.0001 hsa-miR-199b-5p 0.0031
hsa-miR-103a-3p <.0001 hsa-miR-30e-3p 0.0035
hsa-miR-25-3p <.0001 hsa-miR-455-5p 0.0039
hsa-miR-378a-3p <.0001 hsa-miR-142-5p 0.0047 hsa-miR-301a-3p <.0001 hsa-miR-18b-5p 0.0053
hsa-miR-15a-5p <.0001 hsa-miR-22-3p 0.0054
hsa-miR-193a-3p <.0001 hsa-miR-3940-5p 0.0055
hsa-miR-378c <.0001 hsa-miR-130a-3p 0.0058
hsa-miR-454-3p <.0001 hsa-miR-4497 0.0066
hsa-miR-34a-5p <.0001 hsa-miR-3178 0.0068
hsa-miR-378d <.0001 hsa-miR-101-3p 0.0073
hsa-miR-146a-5p <.0001 hsa-miR-3613-5p 0.0094 hsa-miR-99b-3p <.0001 hsa-miR-20b-5p 0.011 hsa-miR-339-5p <.0001 hsa-miR-340-5p 0.0137 hsa-miR-193a-5p <.0001 hsa-miR-26a-5p 0.0151 hsa-miR-140-3p 0.0001 hsa-miR-365a-3p/hsa-miR-365b-3p 0.0187
hsa-miR-3182 0.0001 hsa-miR-107 0.0187
hsa-miR-29a-3p 0.0001 hsa-miR-660-3p 0.0192
hsa-miR-425-5p 0.0003 hsa-miR-33a-5p 0.0206
hsa-miR-363-3p 0.0003 hsa-miR-4521 0.0223
hsa-miR-15b-5p 0.0003 hsa-miR-423-3p 0.0226
hsa-miR-4732-5p 0.0004 hsa-miR-4780 0.0238
hsa-miR-17-3p 0.0005 hsa-miR-378e 0.026
hsa-miR-130b-3p 0.0007 hsa-miR-4488 0.0262
hsa-miR-142-3p 0.001 hsa-miR-3676-5p 0.0318
hsa-miR-210 0.0011 hsa-miR-16-5p 0.0322
hsa-miR-1246 0.0011 hsa-miR-338-3p 0.036
hsa-miR-500a-5p 0.0011 hsa-miR-197-3p 0.0469
hsa-miR-4456 0.0011 hsa-miR-532-3p 0.0498
hsa-miR-9-5p 0.0012
37
FIGURE 5
Figure 5: Number of miRNAs differentially expressed in M-CSF + sRANKL cells at each time point (Bonferroni p <0.05) for expression for expression change of miRNA within 12 days and ANCOVA (p <0.05) at specific time
point compared to baseline (day 0)
1 3 6 1 2
0 2 0 4 0 6 0 8 0
M iR N A s D if f e r e n t ia lly E x p r e s s e d in M - C S F + s R A N K L C e lls
D a y s
N
u
m
b
e
r
m
iR
N
A
38
TABLE 2
miRNA logFc p-value
(Bonferroni)
Avg. Hy3
hsa-miR-4732-5p 4.183 0.0004 7.529
hsa-miR-146a-5p 3.274 <.0001 8.034
hsa-miR-3940-5p 3.038 0.0055 9.132
hsa-miR-4497 2.82 0.0066 7.589
hsa-miR-146b-5p 2.408 <.0001 8.226
hsa-miR-193a-3p 2.385 <.0001 8.324
hsa-miR-378a-3p 2.106 <.0001 8.907
hsa-miR-378d 2.065 <.0001 7.915
hsa-miR-1246 1.78 0.0011 11.648
hsa-miR-4456 1.663 0.0011 9.321
hsa-miR-3182 1.658 0.0001 10.544
hsa-miR-29a-3p 1.59 0.0001 8.482
hsa-miR-22-3p 1.398 0.0054 10.161
hsa-miR-378c 1.339 <.0001 7.924
hsa-miR-3676-5p 1.011 0.0318 8.690
hsa-miR-101-3p -1.252 0.0073 7.879
hsa-miR-103a-3p -1.273 <.0001 8.975
hsa-miR-191-5p -1.312 0.0017 8.589
hsa-miR-142-5p -1.312 0.0047 9.353
hsa-miR-30c-5p -1.335 0.0015 8.222
hsa-miR-142-3p -1.57 0.001 11.154
hsa-miR-92a-3p -1.618 <.0001 7.807
hsa-miR-15a-5p -2.001 <.0001 9.515
hsa-miR-15b-5p -2.34 0.0003 8.217
hsa-miR-16-5p -2.353 0.0322 9.808
hsa-miR-106b-5p -2.708 <.0001 8.261
hsa-miR-223-3p -3.744 <.0001 10.224
Table 2: 27 miRNAs found to be significantly differentially expressed throughout osteoclast differentiation. Bonferroni correction applied to p-values. MiRNAs listed by logFc with positive values representing up-regulation