A Functionally Conserved Gene Regulatory
Network Module Governing Olfactory Neuron
Diversity
Qingyun Li1☯, Scott Barish1☯, Sumie Okuwa1, Abigail Maciejewski1, Alicia T. Brandt2,
Dominik Reinhold3,4, Corbin D. Jones2,3, Pelin Cayirlioglu Volkan1,5*
1Department of Biology, Duke University, Durham, North Carolina, United States of America,2Department of Biology, University of North Carolina at Chapel Hill, Chapel Hill, North Carolina, United States of America, 3Carolina Center for Genome Sciences, University of North Carolina at Chapel Hill, Chapel Hill, North Carolina, United States of America,4Department of Mathematics and Computer Science, Clark University, Worcester, Massachusetts, United States of America,5Duke Institute for Brain Sciences, Duke University, Durham, North Carolina, United States of America
☯These authors contributed equally to this work. *[email protected]
Abstract
Sensory neuron diversity is required for organisms to decipher complex environmental cues. InDrosophila, the olfactory environment is detected by 50 different olfactory receptor neuron (ORN) classes that are clustered in combinations within distinct sensilla subtypes. Each sensilla subtype houses stereotypically clustered 1–4 ORN identities that arise through asymmetric divisions from a single multipotent sensory organ precursor (SOP). How each class of SOPs acquires a unique differentiation potential that accounts for ORN diversity is unknown. Previously, we reported a critical component of SOP diversification program, Rotund (Rn), increases ORN diversity by generating novel developmental trajec-tories from existing precursors within each independent sensilla type lineages. Here, we show that Rn, along with BarH1/H2 (Bar), Bric-à-brac (Bab), Apterous (Ap) and Dachshund (Dac), constitutes a transcription factor (TF) network that patterns the developing olfactory tissue. This network was previously shown to pattern the segmentation of the leg, which suggests that this network is functionally conserved. In antennal imaginal discs, precursors with diverse ORN differentiation potentials are selected from concentric rings defined by unique combinations of these TFs along the proximodistal axis of the developing antennal disc. The combinatorial code that demarcates each precursor field is set up by cross-regula-tory interactions among different factors within the network. Modifications of this network lead to predictable changes in the diversity of sensilla subtypes and ORN pools. In light of our data, we propose a molecular map that defines each unique SOP fate. Our results high-light the importance of the early prepatterning gene regulatory network as a modulator of SOP and terminally differentiated ORN diversity. Finally, our model illustrates how con-served developmental strategies are used to generate neuronal diversity.
OPEN ACCESS
Citation:Li Q, Barish S, Okuwa S, Maciejewski A, Brandt AT, Reinhold D, et al. (2016) A Functionally Conserved Gene Regulatory Network Module Governing Olfactory Neuron Diversity. PLoS Genet 12(1): e1005780. doi:10.1371/journal.pgen.1005780
Editor:Claude Desplan, New York University, UNITED STATES
Received:October 26, 2015
Accepted:December 8, 2015
Published:January 14, 2016
Copyright:© 2016 Li et al. This is an open access
article distributed under the terms of theCreative
Commons Attribution License, which permits unrestricted use, distribution, and reproduction in any medium, provided the original author and source are credited.
Data Availability Statement:All relevant data are within the paper and its Supporting Information except for sequence files for the transcriptome
analysis, which are available from:http://www.ncbi.
nlm.nih.gov/geo/query/acc.cgi?acc=GSE75986.
Funding:PCV received funding from the National Science Foundation Division of Environmental Biology, grant number 1457690. The funders had no role in study design, data collection and analysis, decision to publish, or preparation of the manuscript.
Author Summary
Drosophilauses 50 different olfactory receptor neuron (ORN) classes that are clustered in combinations within distinct sensilla subtypes to decipher a complex chemical environ-ment. Each sensilla subtype houses 1–4 ORN identities that arise through asymmetric divi-sions from a single multipotent sensory organ precursor (SOP). How each class of SOPs acquires a unique differentiation potential that accounts for ORN diversity is unknown. Here, we show that Rn, along with BarH1/H2 (Bar), Bric-à-brac (Bab), Apterous (Ap) and Dachshund (Dac), is part of a conserved proximodistal (PD) gene regulatory network module that patterns the antennal disc into seven concentric rings and diversifies SOP identities. Each ring expresses a unique combination of the aforementioned transcription factors, and encodes the differentiation potentials for a limited number of sensilla sub-types. Genetic perturbations of the network lead to predictable changes in ORN diversity. These data suggest that the diversification of precursor fields by the prepatterning network is the first step to neuronal diversification, followed by SOP selection by proneural genes, and Notch-mediated neurogenesis. As each step operates in a context-dependent manner, deployment of the same transcription factor network module may regulate neuronal diver-sity in parallel systems with completely different fate outputs.
Introduction
Making sense of a complex environment requires a high level of functional diversity in neuro-nal classes that comprise both the peripheral and central nervous system. Little is known about how limited genetic resources are utilized to reproducibly spawn a large number of neuronal classes. Sensory systems, especially the olfactory system, are prime examples of both this neuro-nal diversity and how it enables organisms to survive in a complex world. The olfactory system drives behaviors fundamental to organisms’survival, like foraging, toxin and predetor avoid-ance, as well as social behaviors such as courtship, aggression and parenting [1]. To detect and decifer the chemical cues shaping these behaviors, animals are equipped with a diverse array of olfactory receptors (ORs) that evolve rapidly [2–6].
TheDrosophilaolfactory system is a great model to study neuronal diversification because: (1) the organizational principle of the olfactory system is conserved across species; (2) it is a complex system with sufficient diversity that calls for sophisticated mechanisms of differentia-tion; yet, (3) its numerical complexity is much reduced as compared to mammals, which makes systems-level investigation possible. Adult flies have two pairs of olfactory sensory appendages: the third segment of antenna (funiculus) and the maxillary palp [7]. The surfaces of these olfactory organs are covered by multiporous sensory hairs, called“sensilla”. Each antenna and maxillary palp contains about 410 and 60 sensilla, respectively, that house clusters of 1–4 olfactory receptor neurons (ORNs) [8,9]. There are approximately 1300 ORNs per antenna and 130 per maxillary palp [8,10]. Each ORN typically expresses a single receptor gene from a repertoire of 80 genes, creating a total of 50 adult ORN classes that are clustered into stereotypical combinations within 22 individual sensilla subtypes [11].
that express conventional insect OR genes, except for two ORN classes (Gr21a/Gr63a- and Or10a/Gr10a-expressing neurons) in the large basiconic subtype ab1 that (co-)express gusta-tory receptors (GRs) [13,14]. Coeloconic sensilla generally contain ionotropic receptor (IR)-expressing ORNs [15–17]. Because of the zonal localization of sensilla types/subtypes and their defined relationships to olfactory receptor genes, the expression of a given receptor is accord-ingly restricted to a specific zone, and thus all ORNs collectively form a sensory map on the antenna [7,18–20]. Interestingly, despite the evolutionary separation betweenDrosophilaand mammals, the principle of zonal restriction of OR expression seems to be conserved [21–23]. It is unclear, however, how different zones are generated and how they regulate the distribution and diversity of different ORN classes.
In flies, the olfactory appendages develop from the antennal discs, which are specified by Distal-less (Dll), Homothorax (Hth) and Extradenticle (Exd) [24,25].hthis an anterior-poste-rior (A/P) homeotic selector gene that is sufficient to confer antennal identity in other tissues. Likewise, the homeotic geneantennapedia(antp) induces leg fate and a gustatory appendage [25–29]. The legs contain gustatory receptor neurons (GRNs) that sense non-volatile chemi-cals, and GRNs also display neuronal diversity with distinct receptor profiles [30–32]. Both the antennae and legs are ventral, segmented appendages and parallels between them have been drawn for years [26–29]. Indeed forced expression ofantpcan transform antennae into legs [26–28]. In either case, the proximodistal (PD) axis of the 3D adult tissue is constructed by the extension of the 2D sheet-like imaginal disc from the center. True joints are formed along this axis in both appendages, although the legs are more segmented [11,33,34]. In addition, the alignment between segments appears to be more linear in the leg, reflecting the“telescope-out” motion of the disc during the morphogenic event as opposed to the“fanning”motion in the antenna. Both sensilla-covered chemosensory organs (funiculus and tarsi) develop from the distal regions of the corresponding discs. The tarsi are further segmented, which sets natural boundaries for the position of a given GRN class. In contrast, the funiculus possesses a contigu-ous anatomy allowing the flow of ORN precursors within a certain range [11,33,35]. It is believed that fly antennae and legs are evolutionarily related, and some common molecules have been discovered to account for the segmental features of their tissue-level analogy along the PD axis [27,28,36,37]. However, how the differentiation of the cellular components, espe-cially the complex array of chemosensory neurons housed in the antennae/legs, is coordinated with or by these morphogenic events remains a mystery.
We recently reported that therotund (rn)gene locus, known to control tarsal segmenta-tion, has a critical function in diversifying ORN classes during the antennal disc development [38,39]. Rn is required in a subset of sensory organ precursors (SOPs) to confer novel sensilla subtype differentiation potentials from some default potentials within each sensilla type line-age. Inrnmutants, ORNs inrn-positive sensilla subtype SOPs are converted to lineage-spe-cific defaultrn-negative fates, resulting in only half of the normal ORN diversity. Through a developmental transcriptome analysis and in light of the knowledge about leg development, we found that Rn, together with BarH1/H2 (B-H1/2, Bar or B), Apterous (Ap), Dachshund (Dac), and Bric-à-brac (Bab), is part of the conserved PD gene regulatory network module that plays a crucial role in patterning the antennal precursor field prior to proneural gene-mediated SOP selection. Interactions among these PD genes separate the developing anten-nal disc into seven concentric domains. Each ring is represented by a unique combination of the aforementioned transcription factors, and encodes the differentiation potentials for a limited number of sensilla subtypes. Genetic perturbations of the network lead to predictable changes in the ratios of different sensilla subtypes and corresponding ORN classes. In addi-tion, using endogenously tagged Rn proteinin vivo, we show direct binding of Rn toBarand
shown to control the segmentation of tarsi in the developing leg and we show that Rn con-trols neuronal development of the GRNs in the leg as well. We propose a three-step mecha-nism to explain ORN diversification, beginning with the prepatterning of the precursor field by a gene regulatory network, followed by SOP selection by proneural genes, and Notch-mediated neurogenesis leading to terminal differentiation. The final precursor potentials are largely determined by the prepatterning phase. In our model, each step operates in a context-dependent manner: in a different context, the same transcription factor network with the same logic steps can result in completely different neuronal identity outputs. This combina-torial approach enables the same small, conserved set of genes to specify, in parallel, a broad range of chemosensory neurons.
Results
A time-course RNAseq analysis reveals mis-regulation of
developmentally critical genes in
rn
mutant
Previously, we demonstrated that the Krüppel-like transcription factor Rn cell-autonomously diversifies ORN classes by branching off novel sensilla subtype lineages from parallel default ones. Inrnmutants, ORN diversity is reduced almost by half. Neurons from at4 sensilla in the trichoid zone, ac2 in the coeloconic zone, and ab1 and ab9 in the basiconic zone are all expanded at the expense of specific ORNs inrn-positive sensilla subtypes [38]. To reveal the molecular mechanism by which Rn modulates ORN precursor identities, we compared tran-script abundances from a time-course RNAseq analysis in wild type (w1118), heterozygous and homozygousrnmutant flies (seeMaterials and Methods) at four temporal landmarks during antennal development. We surveyed the prepatterning (larval), SOP selection (8hr pupal), neu-rogenesis (40hr pupal) and terminally differentiated adult stages [38,40–44]. For the adult stage, changes in OR expression inrnmutants were consistent with the overall trend described from our previous report (S2 Fig), suggesting that our experiment effectively identifies genes whose expression is affected byrn.
To find key developmental genes likely acting downstream of Rn, we focused on the three early stages. As Rn is only expressed during larval and early pupal periods, we reasoned that the genes under direct Rn control would show differential expression in one or more of these early time points. A Venn diagram generated from the final lists for all early stages reveals that some genes may be misregulated only in one particular stage, while others show misregulation
—both up and down—across multiple stages (S1A and S1B Fig, also seeMaterials and Methods).
GO term analysis showed an excess of misregulated genes with potential functions in devel-opment, such as transcription factors and signaling molecules (an in-depth analysis of the data-set is beyond the scope of this study, and will be published elsewhere). In addition, functional clustering analysis using the online tool, DAVID [45,46], for each category in the Venn dia-gram, uncovered a functional group including homeodomain(-like) proteins BarH1/2 (B-H1/ 2, Bar or B) and Bric-à-brac1 (Bab1) as being modified inrnmutants. Interestingly, both
B-H1/2andbab1showed changes in transcription levels only during early developmental stages (Fig 1A). It is important to note that B-H1 and B-H2, as well as Bab1 and Bab2, are func-tionally redundant, and have extensively overlapping expression patterns (S3B Fig) [47,48]. Because onlybab1but notbab2was included in the initial functional clustering analysis, we re-examined the RNAseq datasets forbab2. We found thatbab2had an overall higher level of expression thanbab1, and similar trend of misregulation exists forbab2(Fig 1A). While thep
genes andrnsuggested that they together might have an important role in ORN diversity. Thus, we focused on B-H1/2 and Bab1/2 in this study and explored their roles in ORN diversi-fication further.
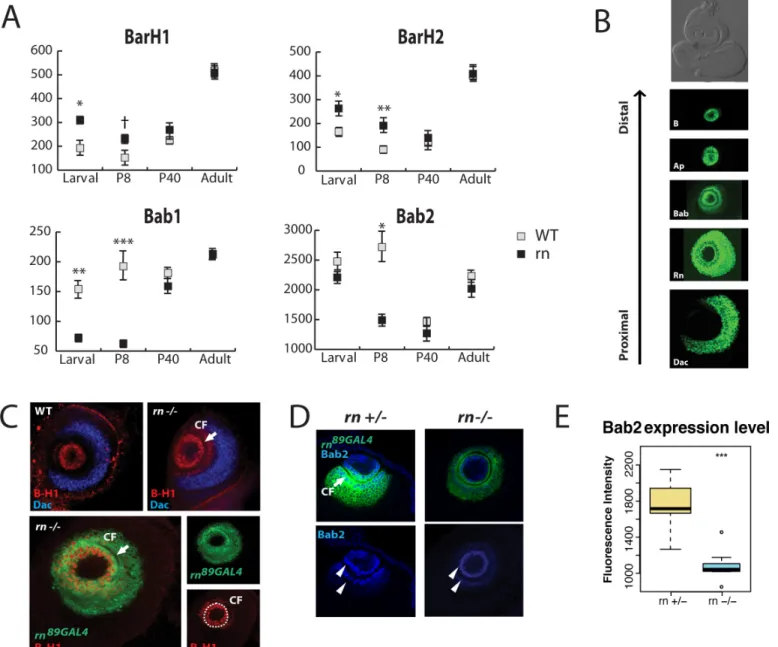
Fig 1. Rn controls the expression ofBarH1/2andbab1/2in the antennal disc.(A) Expression levels ofB-H1/2andbab1/2between the control and mutants in different stages. Normalized expression data by DESeq2 was used.†p<0.1*p<0.05**p<0.01***p<0.001. (B) Expression patterns of PD genes in the third instar larval antennal disc. They are expressed in concentric rings along proximodistal axis. Anti-B-H1 (T. Kojima), anti-Bab2 (F. Laski), anti-Dac were used to visualize Bar, Bab and Dac.aprK568(stained with anti-β-gal) and CRISPR tagged Rn-EGFP [49] were used to visualize Ap and Rn. The antennal disc is the upper portion of the eye-antennal disc complex in the bright-field image. Images were taken from different animals. (C) Confirmation of RNAseq results on Bar expression. Antibodies to B-H1 (red) were used. Expansion of B-H1 outside CF (arrow) is apparent inrnmutants. The expansion of Bar is restricted within the distal boundary of Dac (blue). In the expanded zone outside the central fold, Bar expression overlaps withrnreporter expression (lower panel). (D) Bab2 antibody staining (blue) shows concentration gradients in wild type. In these composite images, two circles (arrow heads) on the ridges of the central fold show the highest concentrations, but the high level of expression is continuous along the central fold (seeS3C Fig). Bab2 level is weaker inrnmutants, although the overall pattern is unchanged. Thern89GAL4reporter labels cells that have activernpromoter (green). CF, central fold
(arrow). (E) Quantification of Bab2 levels in (F). n = 10,***p<0.001.
A common molecular network patterning the antennal and leg
appendages
Rn was previously reported to function in a gene regulatory network together with B-H1/2, Dachshund (Dac), Apterous (Ap) and Bab1/2 to pattern the segmentation of theDrosophila
leg disc in the proximodistal (PD) axis [49,50]. In the leg, the temporally dynamic PD gene reg-ulatory network, under the influence of morphogen gradients, defines a number of concentric domains on the leg disc via cross-regulation, which in turn determines individual segment identities. These data led us to hypothesize that the neuronal diversity phenotypes observed in
rnmutants arise due to the changes of expression domains for the PD network components during antennal disc patterning. To test this hypothesis, we first systematically examined the spatial patterns of these factors in the developing antennae of wild type animals, and found that each factor is expressed in a concentric ring along the PD axis of the discs (Fig 1B). The gene expression patterns are remarkably similar between the legs and antennae, suggesting that these two organs share the same molecular tool kits that pattern their respective discs [39,51– 53].
Rn was previously shown to be a positive regulator of Bab1/2 and a negative regulator of B-H1/2 in the developing leg disc [39,51]. Given the evolutionary relationship between the leg and the antennae, we thought a similar regulatory network may exist in the antennal disc [54]. Indeed, the regulatory relationships of PD genes from the leg-patterning network can explain the misregulation ofB-H1/2andbab1/2in the antennal disc from our RNAseq data. This idea was then confirmed by examining theirin vivoexpression patterns (Fig 1C–1EandS3A Fig). B-H1 is normally expressed in the center of the disc, bounded by the central fold (Fig 1C). In
rnmutants, B-H1 is expanded outside of the central cells into cells that are normallyrn -posi-tive and B-H1/2-nega-posi-tive, but the expansion is confined within the distal boundary of Dac (Fig 1C). The ectopic cells that are labeled with B-H1 antibody inrnmutants are positive for thern
promoter reporter (Fig 1C), suggesting that thisrn-positive precursor domain may have switched fates as a result of the loss of Rn and the expansion of B-H1/2. On the other hand, Bab2 expression is significantly reduced inrnmutants (Fig 1D and 1E). Consistent with the RNAseq results, we did not detect obvious changes inapexpression in the third instar larval stage (S3A Fig). Taken together, these results suggest that a common PD gene regulatory net-work module operates in parallel during leg and antennal disc development.
Expansion of Bar expression in
rn
mutants underlies expansion of a
default fate and changes in ORN diversity
Inrnmutant antennae, the number of ORNs in somern-negative sensilla (e.g. Or47b ORNs in at4) are increased at the expense of ORNs inrn-positive sensilla [38], and this occurs in parallel to the expansion of Bar in the antennal disc. To test if the expansion of Bar leads to an increase in at4 ORNs inrnmutants, we analyzedBar/rndouble mutants. Normally, approximately 60 Or47b ORNs are found in wild type flies, and this number is increased to ~90 inrnmutants [38]. We first generated eyFLP-induced MARCM clones, which induced small clones that are either wild type orBarmutant in approximately 20% of all ORNs (Fig 2C and 2D). These anal-ysis showed that the number of total Or47b ORNs inBarmutant clones was not significantly different than that of the wild type clones (Fig 2C and 2D). However, when generating similar
anddac-negative [35,38], they are likely developed from the Bar-positive inner circle of the disc (Fig 1B). Consistently, at4 ORNs express theBarpromoter reporter (see below for fate mapping and genetic analyses). Remarkably, Bar seems to be dispensable for the endogenous at4 fate (Fig 2C and 2D), presumably due to the robustness of this fate to genetic perturbations.
Rn directly binds upstream of
BarH2
and
bab2
gene regions
in vivo
Next we wanted to know if the genes in the network directly regulate each other. We focused on the function of Rn, as this may help explain the misregulation ofB-H1/2andbab1/2inrn
mutant. Previousin vitroassays have shown that Rn binds to a T-rich motif (T13) in the LAE (leg and antennal enhancer) sequence upstream ofbab2to activate its expression during leg and antennal development. However,in vivoevidence for Rn binding targets has been missing due to the lack of a high-quality antibody. We generated a fly line that carries an EGFP endoge-nous tag for Rn (Rn-EGFP), which was confirmed and validated for functionality [55]. We then used EGFP antibodies to do chromatin immunoprecipitation (ChIP) followed by qPCR to test binding of Rn tobaborBarregulatory elements in the antennal discs.
qPCR primers were designed in the first 2kb upstream of the transcription start site (TSS) in theBarloci (Materials and Methods). A primer set covering the T13 motif in thebab2
enhancer was used as a positive control, while the M1 motif region from Or82a promoter was used as a negative control [38,39]. ChIP on antennal disc tissues was able to detect direct bind-ing of Rn to the publishedbab2enhancer and the promoter region ofB-H2using the Rn-EGFP line, and further confirms that Rn does not bind to OR promoters (Fig 2E). We noticed that the binding of Rn tobab2enhancer is more robust compared toB-H2sites, which might arise due to the differences in the genomic organization of these binding sites. Since bothB-H2and
Or82acontain T13-like motifs in their upstream regions, the binding of Rn seems to require some special chromatin environment and/or the facilitation of binding by other factors in addi-tion to the presence of a T13 consensus sequence. While our analysis cannot distinguish whether Rn binds to a different motif in theB-H2promoter, these results suggest that the con-centric TF domains may be formed by cross-regulatory relationships, and that Rn regulates components of the network through directly binding to their regulatory elements.
Partitioning of prepatterning domains
We noticed that the expression domains of several PD factors overlap in the third instar anten-nal disc, and therefore we wanted to dissect the spatial relationships between these factors more carefully. To simplify the descriptions, we use the central fold (CF) as a landmark, which is usually observed as an unstained dark circle in a superficial section of confocal images, to separate the disc into inner and outer regions (Fig 3BandS3C Fig). In the outer region, Dac,
Fig 2. Relationship betweenBarH1/2andrn.(A) Expression of Or47b from at4 sensilla as detected by Or47b::mCD8-GFP reporter in control,rnsingle mutant andrn/Bardouble mutant flies. Or47b expression is expanded into an anterior zone (right panel, arrowhead) in thern-/- antenna. When mutant clones forBarH1/2have been introduced in thern-/- background, the expansion of Or47b expression in the anterior zone is no longer obvious (arrowhead). (B) Quantification of the numbers of Or47b expressing neurons from (A). There is a significant decrease in the number of Or47b neurons inBar/rndouble mutants as compared tornsingle mutants. ANOVA revealed a statistically significant change in the number of Or47b neurons (p<0.001, Fcrit = 3.25, df = 39). Statistics displayed represent post-hoc Student’s T-tests. n = 15.**p<0.01,***p<0.001. (C) Or47b neurons in wildtype andBarMARCM clones. Or47b neurons were labeled using Or47b-GAL4 to drive UAS-CD8 GFP. Clones were generated using ey-FLP FRT19A TubGAL80. (D) There was no detectable difference between the numbers of Or47b neurons in wildtype and mutant clones. Quantification showed that the average number of cells observed was approximately one fifth of the total number of Or47b neurons in (B), suggesting that MARCM occurred in a small portion (20%) of the antennal disc. (E) ChIP-qPCR using anti-EGFP antibodies to pull down endogenous Rn-EGFP from third instar antennal discs and test the binding of Rn toBar/babregulatory regions. T13 enhancer sequence upstream ofbab2, which was previously reported to bind to Rnin vitro, showed enrichment for Rn-GFP in the ChIP assay. Primers spanning different regions of BarH2 upstream its TSS (BarH2-399, BarH2-728, and BarH2-1588) also showed binding to Rn-EGFP. Or82a, which is expressed in ORNs that develop fromrn-positive ORNs did not show binding as previously reported [38].**p<0.01.
Rn and Bab are expressed from more proximal to more distal area in the disc (Fig 3B). Due to the substantial overlap in their expression patterns, these three factors divide the region into four concentric rings. We number the rings starting with the outermost one being R(1), and therefore R(1) to R(4) are assigned to this region (Fig 3A and 3BandS3D Fig). Bab here is expressed in a gradient, similar to its previously reported expression in the leg discs [56]. Our results show that the highest level of Bab is found near the central fold, and its expression decreases toward both outermost and innermost areas of the disc (Fig 3BandS3C Fig).
Three more rings can be found inside the central fold. R(5) is the only ring that shows qua-druple labeling by 4 factors examined (Rn, Bab, Ap, and Bar) (Fig 3C and 3D). This ring also corresponds to the only region that expresses Rn inside of the central fold (Fig 3C–3E). Bar expression cannot be detected in the centermost region (Fig 3C–3E). Taken together, the par-tial overlapping patterns of Dac, Rn, Bab1/2, B-H1/2 and Ap expression demarcate seven con-centric ring domains in the third instar antennal disc, and each ring is marked by a unique combination of prepatterning factors (Fig 3AandS3D Fig).
Sensilla subtype fate mapping onto the prepatterned domains
Next we asked which precursor identities are generated from each of these seven domains. As all of the components within a sensillum arise from a single SOP, we wanted to know the sen-silla subtype identities of SOPs from each concentric domain. To do this, we used promoter-driven reporter lines for each individual gene to label ORN axons. Because ORN sensory iden-tities are closely linked with the glomerular ideniden-tities in the brain, we can infer which ORN classes express the given factor from the glomerular labeling pattern in this analysis (Fig 4and
Table 1andS4 Fig).Bar-andbab-GAL4s were analyzed at both adult and pupal stages, whereasap-GAL4 was analyzed only at mid-pupal stages due to the lack of adult expression.
Ring 1. ab1, ab9, and ab3 are labeled by thedacreporter, but negative forrn,Barandap
(Table 1), and it has been shown that Dac is required for the specification of these three sensilla subtypes [35]. Therefore, we map ab1, ab9, and ab3 to R(1) (Fig 5A). However, they are also positive forbabbased on reporter expression in ORNs (Table 1andFig 4). Because there is no ring that is positive for Bab and Dac expression but negative for Rn in the 3rdinstar larval antennal disc based on antibody stainings (Fig 3A), we attribute this discrepancy to either an artifact of thebabreporter or late expression of Bab unrelated to precursor fate determination.
Rings 2, 3, 4, and 5. Next we wanted to map sensilla to the middle 4 rings, all of which are
rn-positive. Because the only Rn-positive, Bab-negative and Dac-positive domain is R(2) (Fig 3A), we assigned this ring with the ab10 fate, which is the only sensilla subtype that meets the same criteria (Table 1and Figs4and5A). Likewise, ab7 and ai1 are the only two sensilla sub-types that are triple labeled byrn,babanddacreporters, and are therefore mapped to R(3) (Table 1andFig 5A). at1, at3, ab5 are labeled byrnandbabbut not by any other reporters, we assigned them to R(4) (Table 1andFig 5A). Finally, ac1 and ac4 are mapped to the quadruple positive R(5). Consistent with this mapping, these two sensilla are positive forrnandbab, and ac1 is labeled by theapreporter, ac4 is labeled by theBarreporter. Even though it seems
Fig 3. Intercalation of prepatterning genes inside and outside the central fold.(A) A schematic model showing 7 concentric domains in the antennal disc determined by unique combinations of transcription factors. Four rings are placed outside the central fold (CF), and three are inside. (B-F) Expression analyses of Rn, Bab and Dac (B); Rn, Bab, and Bar (C); Rn, Bar andap(D and E); Bab andap(F) demarcate 7 different rings in the antennal discs based on combinations of these factors as well as Bab concentration gradient. Middle confocal sections were shown for (B-D), and superficial sections were shown for (E) and (F). Bab expression is highest near the central fold and decreases towards outermost and innermost regions. Bab was labeled with anti-Bab2. Rn was labeled with tagged EGFP in Rn-EGFP. Dac was labeled with a monoclonal anti-Dac antibody. Bar was labeled with anti-B-H1.apwas labeled with anti-β-gal inaprK568. Individual channels are shown on the right of each image. Boxed areas are shown below in higher magnification. Rn expression is seen as a
circle (arrow) inside the central fold in the middle sections (C). Central fold is denoted by a dashed line. Each ring is numbered and marked by a bracket.
neither of these two sensilla are labeled by all 4 factors simultaneously, the expression of these factors may be only required for precursor fate specification in a narrow window of the larval stage, and later restricted to specific lineages and daughter cells for downstream functions. Consistent with this explanation,apexpression is highly dynamic, and disappears in the adult stage. We also detecteddacandBarexpression in IR75d ORNs in coeloconic sensilla, which is the only ORN class that is found in more than one sensilla subtypes (ac1, ac4, and ac2). We currently cannot distinguish whether this is due to a developmentally related event unique to this ORN class or an artifact of the reporter expression.
Ring 6. R(6) is labeled by Bar,ap, and Bab in the antennal disc (Fig 3A and 3C–3E). The only remaining sensillum that is unambiguously labeled by these three factors is at4. Consistent with the notion that these sensilla arise from R(6), at4 sensilla are expanded inrnmutants [38] and this expansion is dependent on the expansion ofBarexpression in the disc during develop-ment (Fig 2A and 2B). The only other sensilla subtype that is left and also expanded inrn
mutants is ac2, which isbab-,Bar-positive, andap-,rn-negative (Table 1). Given that ac2 behaves similarly to at4 from our genetic studies (see below) and previously published results [38], we deduced that the R(6) region generates precursors that give rise to ORNs in ac2, as well as at4 sensilla (Fig 5A). The reporter line we used forapmay not capture its expression in ac2 ORNs properly due to the complexity of its enhancer elements.
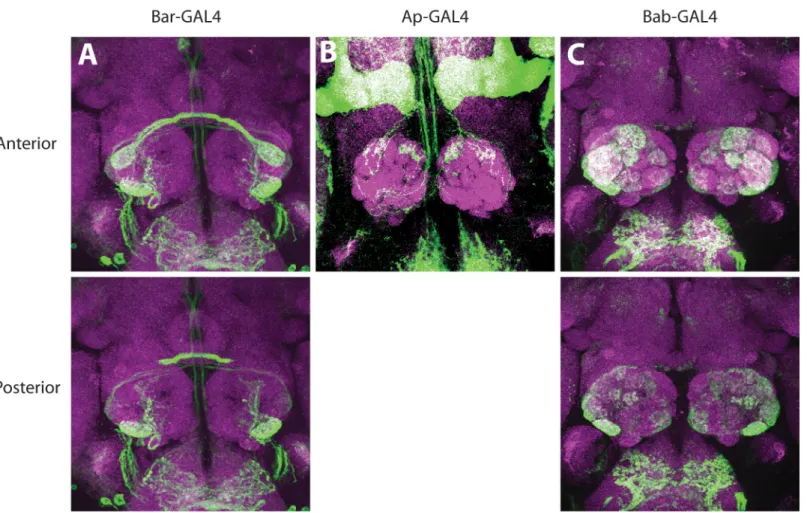
Fig 4. Expression pattern of PD network components in ORNs.Antennal lobe innervation of ORNs expressing GFP driven byBarNP4099(A),apmd544(B),
orbab1Pgal4-2(C). ForbabandBarexpression, analysis was done on adults. Forap, 50–75 hour APF pupal brains were examined. Top rows show anterior
confocal slices and the bottom rows show the posterior slices. Also seeS4 Figfor additional analysis andTable 1for summary of the results.
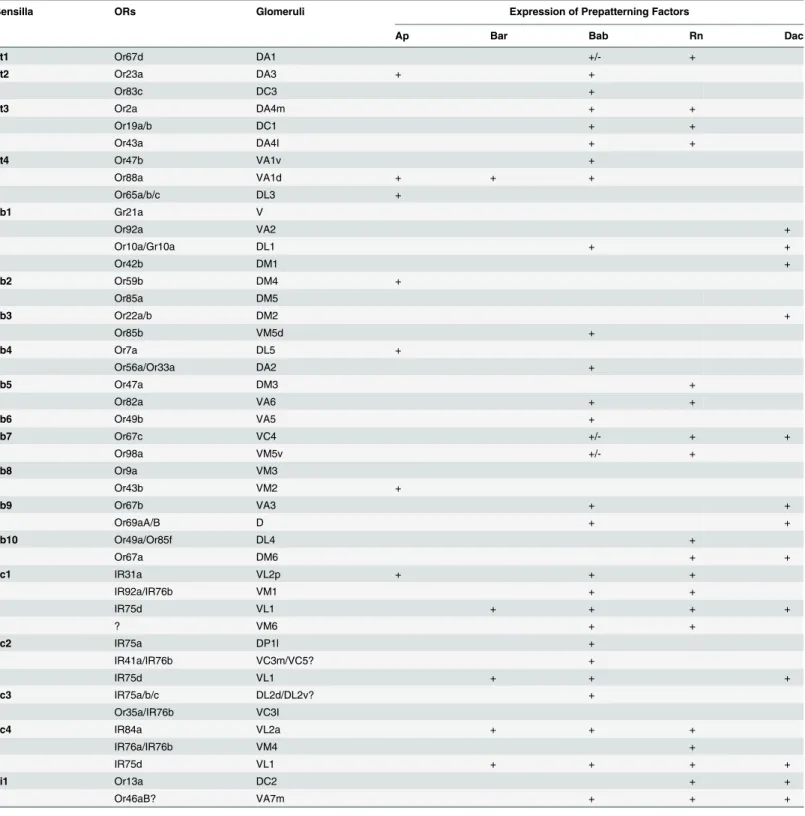
Table 1. Summary of GAL4 reporter expression of PD network TFs in ORNs.
Sensilla ORs Glomeruli Expression of Prepatterning Factors
Ap Bar Bab Rn Dac
at1 Or67d DA1 +/- +
at2 Or23a DA3 + +
Or83c DC3 +
at3 Or2a DA4m + +
Or19a/b DC1 + +
Or43a DA4I + +
at4 Or47b VA1v +
Or88a VA1d + + +
Or65a/b/c DL3 +
ab1 Gr21a V
Or92a VA2 +
Or10a/Gr10a DL1 + +
Or42b DM1 +
ab2 Or59b DM4 +
Or85a DM5
ab3 Or22a/b DM2 +
Or85b VM5d +
ab4 Or7a DL5 +
Or56a/Or33a DA2 +
ab5 Or47a DM3 +
Or82a VA6 + +
ab6 Or49b VA5 +
ab7 Or67c VC4 +/- + +
Or98a VM5v +/- +
ab8 Or9a VM3
Or43b VM2 +
ab9 Or67b VA3 + +
Or69aA/B D + +
ab10 Or49a/Or85f DL4 +
Or67a DM6 + +
ac1 IR31a VL2p + + +
IR92a/IR76b VM1 + +
IR75d VL1 + + + +
? VM6 + +
ac2 IR75a DP1l +
IR41a/IR76b VC3m/VC5? +
IR75d VL1 + + +
ac3 IR75a/b/c DL2d/DL2v? +
Or35a/IR76b VC3I
ac4 IR84a VL2a + + +
IR76a/IR76b VM4 +
IR75d VL1 + + + +
ai1 Or13a DC2 + +
Or46aB? VA7m + + +
Summary of the expression analyses shown inFig 4andS4 Fig. Pupal brains (50–75 hr APF) were used to examineap-positive ORN identities by apmd544-driven GFP. Pupal and adult brains were used for analyzing thebab(bybab1Pgal4-2-driven GFP) andBar(byNP4099-driven GFP) data.
Expression data forrn(in pupal stage and by lineage tracing) anddac(in adult stage) were taken from Liet al. and Songet al[35,38]. Weak expression is indicated by“+/-”.
Ring 7. Finally, at2, ab2, ab4, ab6, ab8, and ac3 arern-negative and unaffected inrn
mutants [38]. This would place them either in the center of the disc or on the periphery, based on whether they expressdac(periphery) or ap/bab (center). Because all contain at least one ORN class that is positive forapand/orbab, but they are all negative fordac, we assigned them to R(7) in the center (Table 1and Figs4and5A). ab3 has been placed within R(1), because of the expression ofdacand its requirement for the development of ab3 ORNs (Table 1andFig 5A). However, ab3 behaves similarly to the sensilla subtypes from the center R(7) in some genetic manipulations (see the following section). We are thus unable to fully resolve the origin of ab3 sensilla. It is possible that ab3 is determined by different sets of factors, one specified in R(7), and the other one specified in the outermost R(1).
These series of analyses provide us with a sensilla subtype fate map on the concentric domains of the larval antennal disc. Each ring is labeled by a unique set of PD transcription fac-tors, corresponding to a specific subset of sensilla subtype fates (Fig 5A). We used this model to explain the majority of the phenotypes observed inrnmutants and other perturbations of the network components (Fig 5BandS1 Text).
Functional involvement of PD genes in generating ORN diversity
Our model makes predictions as to how manipulations of the patterning network would lead to changes in ORN diversity. As previously reported,rnmutation effectively halves the amount of ORN diversity in the antenna [38]. We constructed a scheme to depict the spatial relation-ships of the PD transcription factors inrnmutants (Fig 5B). In this model, the TF combina-tions in Rn-positive domains, namely R(2) to R(5), are altered due to the changes to the expression of Bar, Bab and Rn. As a result, R(1) would be expanded into R(2) and the proximal portion of R(3). Similarly, R(6) would be expanded into R(4) and R(5) inrnmutants (Fig 5B
andS1 Text).
Because we observed an expansion of Bar inrnmutants and this expansion is required for their ORN phenotypes, we wanted to test the effects of ectopic Bar expression in thern expres-sion domain on ORN populations. Ap was previously shown to protect Bar from being repressed by Rn during leg development [51]. Therefore, either overexpressing Bar directly or indirectly by overexpressing Ap should at least partially recapitulate the adult ORN phenotypes inrnmutants. We analyzed OR expression as readouts of ORN classes using quantitative RT-PCR (qRT-PCR) for a panel of 20 olfactory receptor genes representing each of the anten-nal sensilla subtypes in these genetic backgrounds. We confirmed that this assay provides a reliable readout of ORN fates, by showing that the predicted OR expression profiles inrn
mutants were readily reproduced (Fig 5C) [38].
As predicted, when Bar or Ap was overexpressed, the changes in the expression of the majority of ORs trended towards changes observed inrnmutants (Figs6Dand7D). One exception was Or47b in at4 that was downregulated in Bar overexpression lines. We have already shown, however, that the expansion of Bar expression accounts for the increase of at4 sensilla inrnmutants. To reconcile this discrepancy, we re-examined the expression ofOr47b
using a reporter line in Bar overexpressing flies. Although we observed an overall decrease in the number of Or47b neurons consistent with the qPCR result, the domain of expression was expanded to the medial region similar to the manner observed inrnmutants (S5 Fig). In agree-ment with the expansion of at4 sensilla, glomerular sizes appeared larger for all at4 ORNs (Or47b, Or88a, and Or65a) compared to wild type (S6A, S6B and S6D Fig), a similar phenome-non observed inrnmutants. (S6A and S6C Fig) [38]. In contrast, the target glomeruli are lost for ab5 ORNs, which show dramatic reduction based on OR expression in qRT-PCR (Figs6D
antenna using reporter lines, we could recapitulate the same changes in OR expression uncov-ered by the qPCR analysis (S6E–S6M Fig). Of particular note is that ORs in the same sensillum (ab10: Or49a, ab7: Or67c) changed in a similar manner to their partner OR genes (ab10: Or67a, ab7: Or98a) (S6E–S6M Figand Figs6Dand7D). These results suggest that manipulat-ing the PD gene network causes switches of SOP fates and ORN populations.
During our examination of Bar-overexpressing larval antennal discs, we found that the cen-tral fold (CF) disappeared (Fig 6B and 6CandS7 Fig). In contrast,apand Bab expression pat-terns were unaffected (S7 Fig). Similarly, Dac showed normal expression, despite the reported function of Bar to repress Dac in the distal area, which suggests that the repression may be time-sensitive and/or context-dependent [47,52].
Next we examined the effects of Ap overexpression on the expression patterns of the net-work genes in the antennal disc. As expected, Ap overexpression resulted in the ectopic expres-sion of Bar protein outside of its normal boundaries in the antennal disc (Fig 7B and 7Cand
S8A and S8B Fig). Similar tornmutants, an expanded Bar zone is bounded by the distal limit of Dac in this background (Fig 7B and 7C). However, unlike inrnmutants, Bar does not fully extend to the boundary, and hence, these proximal cells in R(4) are positive for Rn but negative for Dac and Bar (S8D Fig). They also express Bab and Ap, making them a separate subpopula-tion within R(4). In addisubpopula-tion, we saw a loss of Rn expression in R(5), leaving the domains within the central fold devoid of Rn expression (S8A–S8C Fig). The simplest interpretation of this data is that increased levels of Ap repress Rn expression in a context-dependent manner. Moreover, we found that Dac expression is decreased in R(2) and R(3) that also express Rn (Fig 7B and 7C), suggesting thatrnpromoter-mediated Ap expression represses Dac in this overlapping domain. Because Dac represses Bab [57], the reduction in Dac expression should theoretically cause an increase in Bab expression, although we cannot detect any obvious changes for Bab. This may be due to its overall low concentration in this region by repression from other factors [57].
Based on these analyses, we drew similar illustrations for precursor domains in the Ap and Bar overexpression backgrounds (Figs6Aand7AandS1 Text). They reveal different patterns of gene expression for a number rings compared to thernmutants, which may account for their differences in adult ORN classes as shown by the qPCR results (Figs6Dand7D). We con-clude that the PD gene regulatory network function in combinations to diversify precursor and ORN fates.
We next examined the requirement of Bar in producing the four fates that arise from the Bar-positive region (Fig 5A). To do this, we createdBarmutant clones that delete bothBarH1
andBarH2. However, our analysis did not reveal any significant changes in adult OR expres-sion (S9A FigandFig 2C and 2D). The most likely explanation for this observation is that Ap and Bar may have partially redundant functions for some sensilla subtypes, such as at4 and ac2 in R(6). Consistent with this, transheterozygousapmutant alleles usingapmd544GAL4and the
nap1deficiency did not affect ORNs from at4 and ac2 precursors, either (S9B Fig). In fact, only three sensilla subtypes (ab2, ab6, and ac1) from R(7) and R(5) showed modest decreases in OR expression inapmutants (Fig 5AandS9B Fig). These results suggest that the developmental
Fig 5. Model depicting the PD network that determines the precursor identities of the rings and the ORN populations.(A) Wild type antennal disc showing the 7 rings corresponding to subsets of sensilla subtype fates created by the combinatorial expression of the PD network components, as well as the Bab gradient. The cross-regulatory network that operates within the antennal disc is shown below. The origin of ab3 (with a question mark) is unclear. (B) Scheme showing the changes to the overlapping domains within the antennal disc inrnmutants. R(6) and R(1) are expanded at the expense of R(2–5). See S1 Textfor explanations. (C) qRT-PCR of OR genes as a readout of ORN populations in antennal samples fromrnmutant flies.*p<0.05,**p<0.01, ***p<0.001.
refinement of SOP fates in the three inner rings are robust, which makes their dependence on factors like Bar and Ap limited.
It has been shown in the leg that this network of PD genes functions under the control of an EGF signaling gradient, which is highest at the center of the disc and decreases outward [33]. There, EGFR signaling represses Rn and activates Bar expression [33,49]. We next tested the hypothesis whether perturbations in EGFR signaling can cause modifications to ORN fates. To do this, we expressed a constitutively active EGFR [33] usingrn89GAL4and performed
qRT-PCR on ORs (S10A Fig). As expected, these experiments showed that ectopic activation of EGFR function is associated with an expansion of Bar and reduction of Rn expression in the antennal disc (S10B and S10C Fig). In addition, the ORN classes originated from R(1), R(2), R (3), and R(5) precursor domains were affected in the adult. These results suggest that EGFR signaling may indirectly regulate ORN diversity by modulating the PD gene network.
Separation of different precursor fates within a ring by Bab concentration
gradients
Bab is partially activated by Rn, and it is significantly downregulated inrnmutants (Fig 1D and 1E). It is plausible to think that Bab functions downstream of Rn to specifyrn-positive precur-sor fates. If this is the case, we should see reduced expression of the receptors from the eightrn -positive sensilla subtypes in ababmutant. To our surprise, only two of the eight receptors tested showed reductions, and another two were even increased in thebabPR72hypomorphic allele (Fig 8B).
We noticed a range of changes for sensilla subtypes from the same ring (Fig 8B). For exam-ple, among sensilla specified in R(7), ab2 and ab6 are reduced, whereas at2 is increased in the
babmutant. The simplest interpretation is that different levels of Bab are required to distin-guish these fates in the same ring. When the overall level of Bab is decreased, some sensilla requiring higher Bab may be converted to the ones that require lower Bab. Similarly, only ac1 from R(5) is reduced, and one explanation is that the lowered Bab expression is still above the threshold for specifying ac4, but not for ac1. Alternatively, ac1 (requiring higher Bab) may be converted to ac4 (requiring lower Bab), and compensates for the loss of the endogenous ac4, which may die due to the reduction of Bab. The same reasoning can be applied to ai1 versus ab7 from R(3). For R(4), we saw increases in at1 and ab5, and a trend towards downregulation for at3 in the mutant, albeit the latter was not significant (Fig 8B). We then counted the num-ber of Or19b neurons housed in at3 sensilla, and found that it is significantly reduced (Fig 8C and 8D). This discrepancy in the qPCR result may be due to the random fluctuation of gene expression levels, especially when the changes in the numbers of cells are small. This result sug-gests that similar conversions may occur in R(4) among the three fates when Bab is reduced. In contrast, the Bab-positive at4 and ac2 from R(6) appear to be normal in this hypomorphic allele. This could either be because these two sensilla are specified with wider ranges of Bab lev-els or some other factors are needed to differentiate the two fates. Taken together, these data suggest that Bab could be an essential factor to distinguish alternate SOP fates within a ring using its concentration gradient.
Fig 6. Effect of Bar overexpression on ORN populations.(A) Model depicting the changes to the combinatorial code inrn89GAL4UAS-BarH1 flies. The fate conversions among the rings are represented by arrows. SeeS1 Textfor explanations. (B)rn89GAL4UAS-GFP (green), Bar (red), and Dachshund (blue)
staining on antennal discs from control flies. (C)rn89GAL4UAS-BarH1M13flies shows expansion of Bar up to the Dac expression boundary (bracket). Some
Bar is detected inside of the Dac expressing region, but this expression is weak and only present in a small number of cells. Central fold is missing in the overexpressing line (arrowhead). (D) qRT-PCR of OR genes as a readout of ORN populations in antennal samples fromrn89GAL4UAS-BarH1M13flies. The receptors that show the same phenotype as inrnmutants are blocked in green shade.*p<0.05,**p<0.01,***p<0.001.
Functionally conserved molecular network in patterning gustatory
receptor neuron fates
The distal portions of both the legs and antennae are chemosensory organs covered by sensilla. The legs, being part of the gustatory system, display neuronal and molecular diversity that is characterized by a huge variety of gustatory receptors expressed on the legs. Unlike ORNs, individual gustatory receptor neurons (GRNs) express multiple receptors, and a given GRN class can be found in different sensilla within different GRN clusters [32].
Because the legs and antennae use the same molecular network to pattern these chemosen-sory appendages, we asked if a similar genetic program operates to pattern the adult GRN fates. We tested this hypothesis inrnmutants asrnis thought to be required for the development of tarsal segment 3 (ta3), and this segment is lost inrnmutants [58]. However, we do not have a reporter line that uniquely labels ta3.
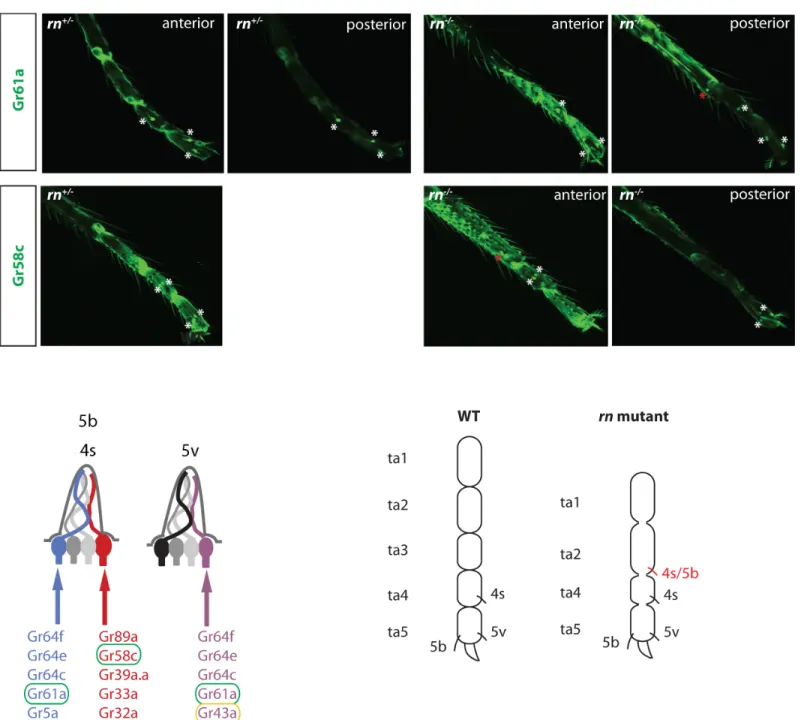
On the other hand, Gr5a and Gr61a are expressed in the mid and hind legs, where they are restricted to the GRNs in ta4 and ta5. In both cases, we could reproducibly detect an extra neu-ron in the mid or hind legs ofrnmutant (Fig 9andS11 Fig). To confirm this result, we used a reporter to label the bitter receptor Gr58c that is expressed by a partner neuron in the same sensilla. We observed ectopic Gr58c neurons inrnmutants (Fig 9). In contrast, the Gr43a-expressing neurons, which coexpress Gr61a but are housed in another sensillum appeared be unchanged in the mutant (S11 Fig). These results suggest that the sensilla, 5b and 4s, that house the Gr5a/Gr61-expressing sugar neurons and the Gr58c-expressing bitter neurons are expanded towards the proximal segment of the legs inrnmutants (Fig 9). Taken together, we speculate that the same molecular network is used in parallel to diversify chemosensory neu-rons in the antennae and legs.
Discussion
How neuronal diversity in the brain is generated from a limited genomic toolkit remains largely unknown. In theDrosophilaolfactory system, selective expression of typically a single olfactory receptor gene from a repertoire of approximately 80 possible genes generates 50 dif-ferent classes of ORNs. ORN classes are found in invariable clusters of 1–4 neurons in individ-ual sensilla, which can be classified into types based on their morphology and subtypes based on the specific combination of ORN classes they house [7,12,20]. Here, we show that a func-tionally conserved cross-regulatory transcription factor (TF) network module patterns the ORN precursor field along the proximodistal axis prior to neurogenesis. The interactions between different components of the TF network module partition the precursor field into con-centric domains in response to an EGF signaling gradient. These domains represent clusters of epithelial cells with distinct differentiation potentials, which are defined by unique combina-tions of TFs that ultimately drive specialization of these cells into sensilla subtype lineage-spe-cific SOPs. Genetic manipulations of the network alter this combinatorial code and lead to predictable shifts between sensilla subtypes and neuronal identities. Our results suggest that this early TF network plays a major role during neuronal diversification by prepatterning the antennal disc, thereby restricting the identities of cells in the precursor field.
Fig 7. Effect of Apterous overexpression on ORN populations.(A) Model depicting the changes to the combinatorial code inrn89GAL4UAS-ap flies. (B) and (C) Rn-EGFP (green), Bar (red), and Dachshund (blue) staining on antennal discs from wild type (B) andrn89GAL4UAS-ap flies (C) shows expansion of
Bar to R(4) and decreased Dac staining in R(2/3) (brackets). Individual channels are shown on the right. Boxed areas are shown below at a higher magnification. (D) qRT-PCR of OR genes as a readout of ORN populations in antennal samples fromrn89GAL4UAS-ap flies. The receptors that show the
same phenotype as inrnmutants are blocked in green shade.*p<0.05,**p<0.01,***p<0.001.
Fig 8. Effects of hypomorphicbabmutants on ORN populations.(A) Model depicting the changes to the combinatorial code inbabPR72homozygous flies. The fate conversions among the rings and ORN pools are represented by arrows. (B) qRT-PCR of OR genes as a readout of ORN populations in antennal samples frombabPR72homozygous flies. The 8rn-positive ORs are from R(2)-R(5) rings.*p<0.05,**p<0.01,***p<0.001. (C) Antennal images
of Or19b (at2) expression in control (left) andbabPR72mutant (right) flies. The top panel is females and the bottom panel is males. (D) Quantification of the
number of Or19b neurons from (C). Both males and females show a significant reduction in the number of neurons.***p<0.001.
doi:10.1371/journal.pgen.1005780.g008
Although our model of sensilla fate mapping can explain the majority of sensilla subtype specification and consequent ORN diversity, it is likely incomplete. For example, some distinct sensilla subtypes within a ring are specified by the same set of factors suggesting that addi-tional/unknown genes must be contributing to the differentiation process. One possibility is that factors that establish the dorsal/ventral (D/V) axis or anterior/posterior axis, such as
engrailedand other prepatterning genes such aslozenge, can be superimposed onto the pre-sented network and used in this process. These factors might function to regulate the expres-sion of proneural genes,atonalandamos, adding an additional spatio-temporal aspect to regulate the selection of SOPs from prepatterned fields, as in the case ofamosbeing regulated bylozenge[40,44,59,60]. Future work should address the contribution of these axis determina-tion events to ORN diversificadetermina-tion. The current study mainly focused on the final phase of the prepatterning stage, and hence the functional relevance of the temporal aspect of the TF net-work deserves further investigation.
A common strategy with simple logic steps for generating neuronal
complexity
We propose a conserved stepwise strategy to explain the overall ORN diversity. First, the pre-patterning phase generates distinct pools of epithelial cells with unique differentiation poten-tials. This is followed by sensory organ precursor selection by proneural genes. Finally, these precursors undergo neurogenic divisions that allocate alternate fates into daughter cells through Notch signaling and terminal selector transcription factors. One salient aspect of this cellular diversification strategy is its modularity. Each step is driven by context-independent rules, yet produces vastly different neuronal outcomes across systems in a developmentally context-dependent manner. For example, Rn is used to generate distinct precursor differentia-tion potentials in both the antennal and leg discs to increase the complexity of the patterned precursor fields, which give rise to ORNs and GRNs, respectively. Similarly, Notch is reitera-tively used during SOP divisions to generate each sensillum. Its function of segregating binary cell fates is context-independent, although the exact fates being segregated are quite different for each sensillum [61]. Therefore, this stepwise mechanism simplifies the overall difficulty of creating neuronal diversity all at once by logically deconstructing similar differentiation pro-cesses into single-purpose steps with shared control elements.
Even though our findings are in the PNS, there are similar examples of stepwise patterning and diversification in the fly CNS. For example, different neuroblast lineages in theDrosophila
embryonic CNS are first specified by spatially restricted factors within specific positions of an orthogonal grid in the embryo [62]. Anterior-posterior axis specification is controlled by Hox-segment polarity genes, which determine the overall fate, just as in the PNS (leg vs. antenna). Dorsoventral patterning is controlled by cross-regulatory transcription factors, which are turned on in response to different concentrations of morphogens such as Hedgehog and Dpp. Similar to olfactory SOPs, patterning of the neuroepithelium is followed by the expression of proneural genes and selection of neuroblasts, which undergo asymmetric divisions and neuro-genesis. The division patterns and factors that are asymmetrically segregated into each daugh-ter cell are remarkably similar regardless of the neuroblast lineages to which they belong [62,63].
domains in the mammalian olfactory epithelium were shown to contain known TF binding sites [64,65]. Interestingly, some TFs, such as the mammalian orthologue of Apterous, Lhx2, have evolutionarily conserved developmental functions in olfactory neurons [66]. We suspect that some of the mechanisms used in diversifying fly ORNs may also be used in the mamma-lian system during the step of OR zonal separation.
Examples of similar neuronal diversification cascades utilizing gene regulatory networks under morhogen gradient control are also seen in the vertebrate CNS and PNS. In the classic example of spinal cord neuron diversification, morphogen gradients (BMP/Shh) along the D/V axis of the neural tube activate different sets of transcription factors in the precursors to set up a number of domains prior to neurogenesis, thereby diversifying both progenitor and sensory neuronal subtypes they generate [67,68]. Recently, the radial glia that give rise to neurons of the cortex were also found to be heterogeneous [69]. Such combinatorial TF network modules confer positional and temporal information to each neural stem cell in order to create a diverse progenitor population in the mammalian cerebral cortex [69]. Segmental patterning of these neural stem cells contributes to neuronal and glial diversity [70]. Similarly, cortical projection neuron fates can be switched among lineages when the corresponding gene network is modi-fied, changing the zonal partitioning of the neocortex [71]. These results, in light of our find-ings, point to a common strategy composed of modular and simple commands functioning in a nested manner to increase neuronal diversity in multiple developmental contexts.
ORN precursor fate specification and OR expression
We associate terminal differentiation of ORNs with the specific selection of an OR gene for expression. At least in flies, it is possible that OR expression and ORN diversity are regulated by a set of“terminal selector genes,”similar to those proposed by Oliver Hobert [72]. Here, a TF, or combination of TFs, directly regulates the expression of genes required for terminal dif-ferentiation and function [72]. So far, a list of postmitotic TFs have been shown to directly reg-ulate OR expression by associating with OR promoters [73–77]. However, the loss of these TFs only affects the expression of specific subsets of OR genes, and yet most OR genes have binding sites for these factors. The functional specificity of each TF and their expression patterns in ORN classes have not been well defined. It is possible that chromatin states around OR pro-moters in different ORN classes govern how these TFs function within each class. Epigenetic modulations of chromatin status have been shown to play an important role in numerous developmental processes, including the development of the olfactory system [78–82]. The pre-patterning TFs could recruit epigenetic modifying factors to change the open and closed states of the chromatin around genes critical for different fates. These modifications can be inherited during cell divisions, and affect the genomic accessibility of later factors. Regardless of the exact mechanisms in between, it is likely that the expression/function of terminal selector genes are regulated, at least in part, by the developmental context established by the prepattern-ing network that we have described. Establishprepattern-ing a clear link between the early patternprepattern-ing net-works and the late terminal selector TF network will be critical to resolving these paradoxical results.
Deployment of the same network module in diversifying olfactory and
gustatory neurons
determined by the genehomothoraxin the antennal disc, whereashomothoraxis inhibited by Antennapedia in the leg discs conferring gustatory identities [83]. Strikingly, regardless of the particular Hox gene, the PD gene network module seems to perform similar diversification commands in both chemosensory systems. It will be interesting to ask how different sets of identity genes are regulated in different tissues on the molecular level, and how the cellular memory is passed down through the cascade.
Modular evolution of gene regulatory networks and neuronal diversity
Understanding the diversification process from homogeneous fields of precursors to diverse, terminally differentiated neuronal populations will provide key insights into how cascades of master regulatory transcription factor networks can generate and modify the cellular complex-ity seen in multicellular organisms. Understanding this diversification process can also help us understand the origins of this complexity. At an evolutionary scale, clear analogy exists between ORN precursor diversification process and the segment diversification during early embryogenesis along the myriapods-insect lineage [84]. The addition or elimination of TFs governing either process might reflect, or likely instruct the generation of new fates. Based on a modern version of“the law of development”postulated almost two centuries ago [85], the acquisition of increased complexity of a tissue and the concomitant genetic changes over evolu-tionary time is recapitulated by the temporal role and developmental order of the genes that establish the complexity. Under this assumption, a primordial state in antennal development might be the expression domains of Bar and Dac in the antennal disc. Rn was then added to this network later in development and evolution. This would explain the dramatic decreases in ORN diversity and the expansion of specific ORN populations in default sensilla subtypes inrn
mutants as well as Bar/Ap overexpression. Indeed, the onset of Rn expression is later in third instar discs compared to those of Dac/Bar/Ap [51], and Rn seems to be unique to Arthropods, especially insects. Thus, it is plausible that Rn is a newer addition to the network. Conceivably, Rn evolved to generate novel olfactory neurons in order to help the ancestral Arthropods exploit novel olfactory niches.
Materials and Methods
Fly genetics
babA128, Df(3L)babPR72, were from Frank Laski. Df(1)B263-20FRT19A, UAS-BarH1M13were from Tetsuya Kojima. UAS-Egfr.λtop4.4 was from Amanda Simcox. rntot, rntodwas previously described [38]. OR-CD8 GFP, OR-GAL4, IR-GAL4, GR-GAL4 lines were from Leslie Vosshall, Barry Dickson, Richard Benton and John Carlson, respectively [7,20]. Or67dGAL4knock-in stock was a published line showing faithful expression of Or67d [86]. rn89, bab1Agal4-5(#6802), bab1Pgal4-2(#6803), apmd544, aprK568, UAS-ap, Df(2R)nap1, tubP-GAL80 ey-FLP FRT19A, FRT19A, UAS-CD8 GFP, UAS-Syt GFP, UAS-FLP were all from Bloomington Stock Center. NP4099 (BarGAL4) was from Drosophila Genetic Resource Center.
Genotypes for fly genetics:
Fig 1B. w1118. aprk568.Rn-EGFP
Fig 1C–1E. rn+/-: UAS-CD8 GFP/+; rn89GAL4/TM6b. rn-/-: UAS-CD8 GFP/+; rn89GAL4/rntod
S3A FigaprK568/UAS-CD8 GFP; rn89GAL4/rntod
S3B Figbab1A128/+
S3C FigRn-EGFP
Fig 2C. Control: eyFLP FRT19A TubGAL80/FRT19A; Or47b GAL4 UAS-GFP/+. Bar MARCM: eyFLP FRT19A TubGAL80/ Df(1)B263-20FRT19A; Or47b GAL4 UAS-GFP/+
Fig 2E. w1118. Rn-EGFP
Fig 3B and 3C. Rn-EGFP
Fig 3D and 3E. aprK568/+, Rn-EGFP
Fig 3F. aprK568/+
Fig 4A–4CandS4A and S4B Fig. NP4099 (BarGAL4); UAS-CD8GFP. apmd544; UAS-CD8 GFP. bab1Pgal4-2/UAS-CD8 GFP. NP4099 (BarGAL4); UAS-Syt GFP. bab1Pgal4-2/UAS-Syt GFP.
Fig 5C. w1118. rntot/FRT rntot
Fig 6B. UAS-CD8GFP/+; rn89GAL4/TM6b
Fig 6C. UAS-CD8GFP/+; rn89GAL4/UAS-BarH1M13
Fig 6D. UAS-CD8GFP/+; rn89GAL4/TM6b. UAS-CD8GFP/+; rn89GAL4/UAS-BarH1M13
S5 FigOr47b::mCD8GFP/+; rn89GAL4/TM6b: Or47b::mCD8GFP/+; rn89GAL4/ UAS-BarH1M13
S6C Figrn89GAL4/rntod.
S6E–S6M FigOR::mCD8GFP. OR::mCD8GFP; rn89GAL4/UAS-BarH1M13. OR::mCD8GFP; rn89GAL4/UAS-ap
S7A FigRn-EGFP UAS-BarH1M13/TM6B
S7B FigRn-EGFP UAS-BarH1M13/rn89GAL4
S7C FigUAS-BarH1M13/TM6B
S7D FigUAS-BarH1M13/rn89GAL4
Fig 7BandS8A and S8C Fig. UAS-ap/+; Rn-EGFP/TM6b
Fig 7CandS8B–S8D FigUAS-ap/+; Rn-EGFP/rn89GAL4
Fig 7D. UAS-CD8GFP/+; rn89GAL4/TM6b. UAS-CD8GFP/+; rn89GAL4/UAS-ap
S9A FigeyFLP FRT19A TubGAL80/FM6. eyFLP FRT19A TubGAL80/ Df(1)B263-20FRT19A
S9B Figw1118. Df(2R)nap1/ apmd544
Fig 8B. w1118: babPR72
Fig 8C. Or19b::mCD8GFP/+; babPR72/TM6b: Or19b::mCD8GFP/+; babPR72
S10 FigUAS-CD8GFP/+; rn89GAL4/TM6b. UAS-CD8GFP/+; rn89GAL4/UAS-Egfr.λtop4.4
Fig 9andS11 Figrn+/-: GR-GAL4/UAS-CD8 GFP; rntot/TM6b. rn-/-: GR-GAL4/UAS-CD8 GFP; rntot/FRT rntot.
RNA extraction and library preparation
For the RNAseq analysis, wandering third instar larval antennal discs (~70 for each genotype), 8hr APF pupal antennae (~50 for each genotype), 40hr APF pupal antennae (~50 for each genotype), and adult antennae (150 males and 150 females) from w1118, rntot/TM6b, and rntot/ rntotflies were dissected. RNA was extracted with RNeasy kit (Qiagen) following manufac-turer's instructions, and was treated with on-column DNase digestion (Qiagen). We extracted RNA only from the antennal portion of the larval eye-antennal discs in order to remove con-tamination by transcripts from the developing eye. All samples were diluted to 20ng/ul in 55ul volume with H2O, out of which 3.5ul was used for quality control using Bioanalyzer (Duke
Microarray Core Facility). The concentrations were measured again with Qubit 2.0 (Life Tech-nologies), and 700ng RNA was diluted to 50ul total volume with H2O for each sample. RNA
generation followed by Illumina 50bp paired-end sequencing by UNC High-Throughput Sequencing Facility (HTSF).
RNAseq analysis
Drosophila melanogastertranscriptome (r5.57) was downloaded from flybase and bwa indexed was created with bwa-0.7.8. Each sequencing file was aligned to the transcriptome, and.sam files for each sample were generated by putting two alignments from both reads together. At least over 80% of the total reads were able to align to the reference. After that, count tables were made for each sample with a customized python script, and further consolidated into a matrix containing transcript ID and read counts from all genotypes for each stage with a Ruby script. These matrices were used as inputs for differential expression analysis using a customized DESeq2 R script.
For each stage, we first filtered out ORs/IRs/GRs from the RNAseq datasets, and excluded the genes with low expression levels in all three genotypes (normalized count<20). We then narrowed the analysis down to genes that show the same trend of differential expression when comparing homozygous vs.w1118and homozygous vs. heterozygous datasets. Because the het-erozygous background may have some dominant effects due to the presence of the balancer chromosome and the heterozygous flies do not show any OR phenotypes [38], saving genes that pass both comparisons would help remove irrelevant genes modified by the balancer chro-mosome and meanwhile enhance the discovery confidence. Because of these stringent filtering steps, we could maximize our gene lists with a more relaxed cutoff (unadjustedp<0.1) for the gene ontology (GO) and functional clustering analyses.
Immunohistochemistry
Samples were fixed with 4% paraformaldehyde, washed with phosphate buffer with 0.2% Tri-ton X-100, and staining as previously described [87]. Primary antibodies were used in the fol-lowing dilutions: rabbitα-GFP 1:1000 (Invitrogen), chickenα-GFP 1:700 (Aves Labs), ratα -Ncad 1:20 (Developmental Studies Hybridoma Bank), mouseα-Bruchpilot 1:20 (Developmen-tal Studies Hybridoma Bank), mouseα-CD2 1:1000 (Serotec), mouseα-Dac 2–3 1:20 (Devel-opmental Studies Hybridoma Bank), rabbitα-βgalactosidase 1:800 (Invitrogen), mouseα-β galactosidase 1:800 (Promega), ratα-Bab2 1:1500 (Frank Laski), rabbitα-Bar-H1 1:100 (Tet-suya Kojima). The following secondary antibodies were used: Alexa 488 goatα-rabbit 1:1000, Alexa 488 goatα-chicken 1:1000, goatα-mouse-Cy3 1:100, goatα-rat-Cy3 1:200, goatα -rab-bit-Cy3 1:200, Alexa 568 goatα-mouse IgG highly cross-adsorbed 1:300, Alexa 647 goatα-rat 1:200, Alexa 633 goatα-mouse 1:200, Alexa 647 goatα-mouse 1:200. Confocal images were taken by an Olympus Fluoview FV1000 or Zeiss LSM 510 (Light Microscopy Core Facility).
Real-time RT-PCR
Table 2. qPCR primers for olfactory receptors.
Primer Name Sequence Amplification Efficiency
Or67d-qPCR-F GCATCAGCTGTATACTAGAATGCTT 1.004581
Or67d-qPCR-R GGGCCAGGCTTTCATAAAGAT
Or23a-qPCR-F ACTGTACCTGATCTCCGAGC 1.022281
Or23a-qPCR-R GTCACATCGAGTAATCTATACAGCG
Or2a-qPCR-F CCTTCTACGATTGCAACTGGAT 1.05291
Or2a-qPCR-R AACCTCATGACCTGCTCGAAG
Or47b-qPCR-F CAAATCTCAGCCTTCTGCGG 1.012215
Or47b-qPCR-R GATACTGGCACAGCAAACTCA
Gr21a-qPCR-F CCAACATGTACGGCATGTACT 0.9796537
Gr21a-qPCR-R ACAGACCCACCTCCTTGTAG
Or92a-qPCR-F TGATATCTTCAAGCTCTCGGATTG 0.9533596
Or92a-qPCR-R TAGGCGGTCTTATAGAGGCG
Or85a-qPCR-F GAGCGACGATACAGAACCAC 0.9776528
Or85a-qPCR-R AAGCGAACTTGGCCATCTTTAT
Or22a-qPCR-F CCGATCGTCGCTACAAATCC 1.034769
Or22a-qPCR-R ATGCCAGCTTCACCATAGCC
Or56a-qPCR-F TTGACAGTTGGCGTTCCAAG 0.9354389
Or56a-qPCR-R AAGCAAGGCTCAGTTCATCG
Or82a-qPCR-F CTCCAATTGGCATCTGGCTT 0.943322
Or82a-qPCR-R GTTCGACAGATCCCAACGAAA
Or49b-qPCR-F ACAAGGTGGGAAAGTTGATGG 1.008808
Or49b-qPCR-R AATGGCAGGACTCTTTCGCT
Or98a-qPCR-F ATTCAAGCCGCAGTTACAAGT 0.956284
Or98a-qPCR-R TGCCAGCTTAGCCACCTTAAT
Or9a-qPCR-F GAGACCAACTGGACCGACTT 0.9326372
Or9a-qPCR-R GAACAATCGTCGAGAAGGTGG
Or67b-qPCR-F AGATCGTTTGCATGCCTGTT 1.068821
Or67b-qPCR-R GCCGGGTAAGTCAAGGTCAT
Or67a-qPCR-F ATTCAAGCCCATAACGCACC 1.045276
Or67a-qPCR-R TCATCAGATCAGTGAGTCGAAGT
IR31a-qPCR-F CGAGATCTGTGATCTGCGTG 0.9775197
IR31a-qPCR-R CCTGGGCATTACACATAGCTG
IR41a-qPCR-F CCAAATTGATTCATCTGCCGC 1.020108
IR41a-qPCR-R ACCACGAGTACATAGCTCCAA
Or35a-qPCR-F CGACTTGGCCTTTACTACGGA 0.9652927
Or35a-qPCR-R AGGGCTTGCTGTTCATCTCA
IR84a-qPCR-F CAGTTGGTCAGGTGTGATGG 0.9322729
IR84a-qPCR-R AAAGTGGATGTTCTGGGTGTG
Or13a-qPCR-F CAATCGTTCACGCCAACAAC 0.9915544
Or13a-qPCR-R ATCGAGGTACTTAGAATGGCCG
ACT5C-qPCR-F GGCGCAGAGCAAGCGTGGTA 1.029591
ACT5C-qPCR-R GGGTGCCACACGCAGCTCAT
GAPDH2-qPCR-F CGTTCATGCCACCACCGCTA 1.053987
GAPDH2-qPCR-R CCACGTCCATCACGCCACAA
Chromatin immunoprecipitation
This procedure is modified based on a published protocol [88]. For each genotype, approxi-mately 800 eye-antennal discs were dissected. The samples were cross-linked with 1% formal-dehyde in dissection buffer for 10min at room temperature. To quench cross-linking, glycine was added to 125mM final concentration, and the samples were incubated for 5min. The discs were homogenized and sonicated in a Bioruptor machine for 13min (high frequency; 30 sec ON/30 sec OFF). The chromatin was pre-cleared with pre-washed Dynabeads Protein G (Life Technologies) for 1hr at 4°C on a nutator. The pre-cleared chromatin was split into 2 tubes (1ml/tube), and another 20ul (2%) was saved as input and stored at -20°C. 5ug Anti-GFP anti-body (Ab290) or an equal amount of normal rabbit IgG were added to either tube, followed by overnight incubation at 4°C. Beads were added to both tubes, and the samples were incubated for 2 hours at 4°C on a nutator. Beads was briefly rinsed with wash buffer I (50mM K-HEPES, pH7.8, 140mM NaCl, 1mM EDTA, 1mM EGTA, 1% Triton X-100, 0.1% Na-deoxycholate, 0.1% SDS), and washed 1X with wash buffer I, 1X with wash buffer II (the same as buffer I, except that NaCl is 500mM), 1X with wash buffer III (250mM LiCl, 0.5% Igepal CA-630, 0.5% Na-deoxycholate, 1XTE), 2X with the TE buffer, at 4°C, 5min/each wash. The chromatin was eluted 2X with pre-warmed elution buffer (1% SDS, 100mM NaHCO3). For each elution, beads
were incubated in 100ul solution for 10min at 65°C, with gentle vortexing every 2–3 min. To reverse cross-link, 5M NaCl was added to each tube, followed by overnight incubation at 65°C. The ChIP-ed DNA was treated with RNase and proteinase K, and extracted by PCR purifica-tion columns (Qiagen). The purified DNA was tested for enrichment of DNA fragments by qPCR. For each target gene, up to 150bp amplicons were selected every ~300bp in the first 2kb region upstream of the coding region (Table 3). A primer pair covering T13 motif within the
bab2LAE (leg and antennal enhancer) was used as a positive control for ChIP-qPCR analysis [39]. The M1 motif upstream of thern-positive Or82 promoter was used as a negative control.
Statistical analysis
Statistical analysis of Bab2 expression levels, qPCR results, and neuron counts was by unpaired, two-tailed Student’s t test. Single factor ANOVA was used to analyze the number of Or47b neurons inrn/Bardouble mutant analysis. Post-hoc, unpaired, two-tailed Student’s t tests were calculated after ANOVA. For all tests,p<0.1,p<0.01,p<0.001.
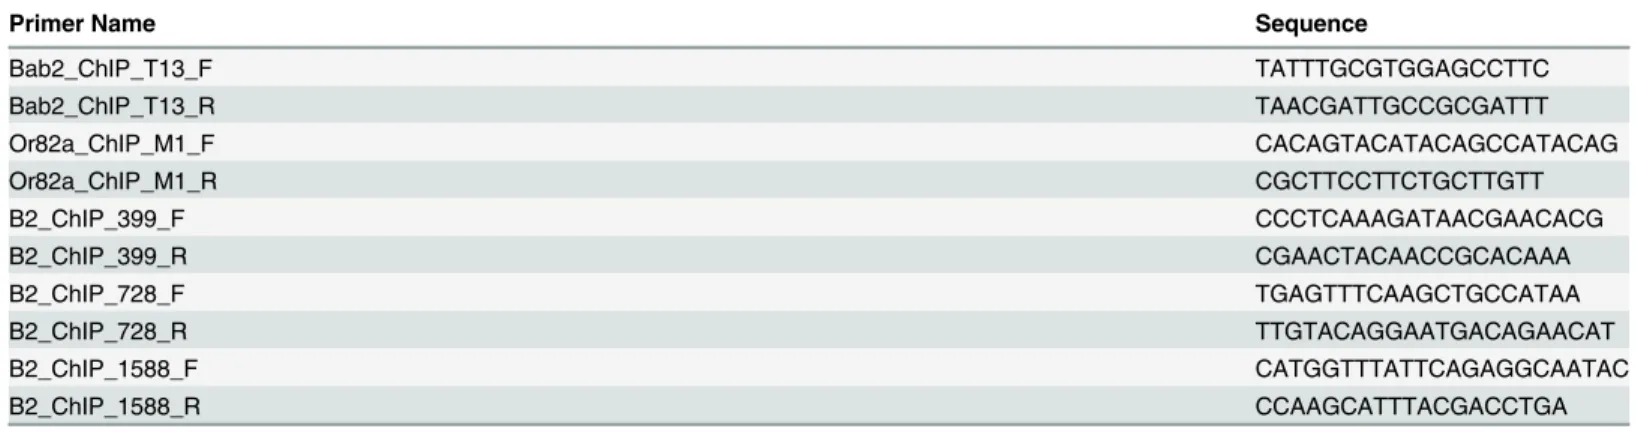
Table 3. ChIP-qPCR primers.
Primer Name Sequence
Bab2_ChIP_T13_F TATTTGCGTGGAGCCTTC
Bab2_ChIP_T13_R TAACGATTGCCGCGATTT
Or82a_ChIP_M1_F CACAGTACATACAGCCATACAG
Or82a_ChIP_M1_R CGCTTCCTTCTGCTTGTT
B2_ChIP_399_F CCCTCAAAGATAACGAACACG
B2_ChIP_399_R CGAACTACAACCGCACAAA
B2_ChIP_728_F TGAGTTTCAAGCTGCCATAA
B2_ChIP_728_R TTGTACAGGAATGACAGAACAT
B2_ChIP_1588_F CATGGTTTATTCAGAGGCAATAC
B2_ChIP_1588_R CCAAGCATTTACGACCTGA
B1 and B2 stand for Bar-H1 and Bar-H2, respectively. T13 and M1 are the motif names [38,39]. The numbers correspond to the lengths between transcription start sites and the beginning of the amplicons.