COMPARISON OF TWO YEARS OF METHANE COLUMN RETRIEVALS FROM
SCIAMACHY OBSERVATIONS IN THE 1.65 AND 2.33 MICROMETER WINDOWS
Hans Schrijver, Annemieke Gloudemans, Sander Houweling, Ilse Aben
SRON Netherlands Institute for Space Research, Sorbonnelaan 2, 3584 CA Utrecht, The Netherlands
Abstract
Results of methane total column retrievals from two SCIAMACHY near-infrared wavelength windows cen-tred around 1.65µm and 2.33µm are compared. It is concluded that the results from the 1.65µm window are more reliable for reasons of signal-to-noise ratio, possibilities of normalisation, and calibration.
1 INTRODUCTION
The UV-Vis-NIR spectrometer SCIAMACHY is part of the payload of Envisat launched in March 2002. Its near-infrared channels offer the possibility to measure absorption spectra from methane, carbon monoxide, carbon dioxide, nitrous oxide, and water vapour.
Total columns of methane can be retrieved from two wavelength windows covered by SCIAMACHY: one at 1.65 micron in channel 6, the other around 2.33 micron in channel 8. Depending on the window, specific complications are involved in the interpretation of the results.
In channel 6 the retrieved columns are considerably affected by spatial variations in optical path length [6] and must therefore be corrected, for example using carbon dioxide columns obtained from the nearby 1.58-micron window [3, 4]. However, errors may be introduced in cases where the surface albedo varies quickly with the wavelength, so that the optical path length becomes wavelength dependent. Nonetheless, Frankenberg et al. [3, 4] have clearly shown the potential of such an approach.
In channel 8 these variations are much smaller, although not entirely absent. But in this case there is the need to correct for the effects (absorption and scattering) of the varying ice layer on the detector window, leaving some uncertainty about the adequacy of the correction.
Methane retrieval results in these channels have been reported by Straume et al. [11], Gloudemans et al. [5] (channel 8), Frankenberg et al. [3, 4] (channel 6), and Buchwitz et al. [1] (both channels). In this paper results obtained at SRON in both channels will be compared, and the respective merits of both windows analysed.
2 RETRIEVALS
CH4total column retrievals in both wavelength windows have been carried out using SCIAMACHY observations from
July 2003 until April 2005. The retrieval method used was the Iterative Maximum Likelihood Method (IMLM version 6.3) developed at SRON [10, 5, 11, 2]. The wavelength windows employed were 1.627–1.671µm in channel 6, and 2.324– 2.338µm in channel 8. Instrument calibration results derived at SRON were used [8]. For each observation temperature and moisture profiles corresponding to the longitude/latitude and time of observation were obtained from ECMWF data and used in the retrieval forward model.
There are several factors that put the channel 8 measurements at disadvantage compared to channel 6. First of all, the signal-to-noise ratio in channel 8 is considerably lower than in channel 6 for several reasons. The solar irradiance at 2.33µm is lower than at 1.65µm. Further, also the detector quantum efficiency is lower in the longer wavelengths. A third factor is that the albedo of the ground scene generally decreases going to longer wavelengths. On top of that, there is the effect of the ice deposit on the channel 8 detector window, decreasing its transmission and thus lowering the signal-to-noise ratio.
j k 180˚ 180˚ 150˚W 150˚W 120˚W 120˚W 90˚W 90˚W 60˚W 60˚W 30˚W 30˚W 0˚ 0˚ 30˚E 30˚E 60˚E 60˚E 90˚E 90˚E 120˚E 120˚E 150˚E 150˚E 180˚ 180˚ 60˚S 60˚S 30˚S 30˚S 0˚ 0˚ 30˚N 30˚N 60˚N 60˚N 180˚ 180˚ 150˚W 150˚W 120˚W 120˚W 90˚W 90˚W 60˚W 60˚W 30˚W 30˚W 0˚ 0˚ 30˚E 30˚E 60˚E 60˚E 90˚E 90˚E 120˚E 120˚E 150˚E 150˚E 180˚ 180˚ 60˚S 60˚S 30˚S 30˚S 0˚ 0˚ 30˚N 30˚N 60˚N 60˚N
CH4 [1019 cm-2]
3.203.25 3.30 3.35 3.403.45 3.50 3.55 3.603.65 3.70 3.75 3.803.85 3.90 3.954.00
Jun - Aug 2004 channel 6
2006
j k 180˚ 180˚ 150˚W 150˚W 120˚W 120˚W 90˚W 90˚W 60˚W 60˚W 30˚W 30˚W 0˚ 0˚ 30˚E 30˚E 60˚E 60˚E 90˚E 90˚E 120˚E 120˚E 150˚E 150˚E 180˚ 180˚ 60˚S 60˚S 30˚S 30˚S 0˚ 0˚ 30˚N 30˚N 60˚N 60˚N 180˚ 180˚ 150˚W 150˚W 120˚W 120˚W 90˚W 90˚W 60˚W 60˚W 30˚W 30˚W 0˚ 0˚ 30˚E 30˚E 60˚E 60˚E 90˚E 90˚E 120˚E 120˚E 150˚E 150˚E 180˚ 180˚ 60˚S 60˚S 30˚S 30˚S 0˚ 0˚ 30˚N 30˚N 60˚N 60˚N
CH4 [1019 cm-2]
3.20 3.25 3.30 3.353.40 3.45 3.50 3.553.60 3.65 3.70 3.753.80 3.85 3.90 3.954.00
Jun - Aug 2004 channel 8
2006
j k 180˚ 180˚ 150˚W 150˚W 120˚W 120˚W 90˚W 90˚W 60˚W 60˚W 30˚W 30˚W 0˚ 0˚ 30˚E 30˚E 60˚E 60˚E 90˚E 90˚E 120˚E 120˚E 150˚E 150˚E 180˚ 180˚ 60˚S 60˚S 30˚S 30˚S 0˚ 0˚ 30˚N 30˚N 60˚N 60˚N 180˚ 180˚ 150˚W 150˚W 120˚W 120˚W 90˚W 90˚W 60˚W 60˚W 30˚W 30˚W 0˚ 0˚ 30˚E 30˚E 60˚E 60˚E 90˚E 90˚E 120˚E 120˚E 150˚E 150˚E 180˚ 180˚ 60˚S 60˚S 30˚S 30˚S 0˚ 0˚ 30˚N 30˚N 60˚N 60˚N Error [%]
0.0 0.1 0.2 0.3 0.4 0.5 0.6 0.7 0.8 0.9 1.0 1.1 1.2 1.3 1.4 1.5 1.6
Jun - Aug 2004 channel 6
2006
j k 180˚ 180˚ 150˚W 150˚W 120˚W 120˚W 90˚W 90˚W 60˚W 60˚W 30˚W 30˚W 0˚ 0˚ 30˚E 30˚E 60˚E 60˚E 90˚E 90˚E 120˚E 120˚E 150˚E 150˚E 180˚ 180˚ 60˚S 60˚S 30˚S 30˚S 0˚ 0˚ 30˚N 30˚N 60˚N 60˚N 180˚ 180˚ 150˚W 150˚W 120˚W 120˚W 90˚W 90˚W 60˚W 60˚W 30˚W 30˚W 0˚ 0˚ 30˚E 30˚E 60˚E 60˚E 90˚E 90˚E 120˚E 120˚E 150˚E 150˚E 180˚ 180˚ 60˚S 60˚S 30˚S 30˚S 0˚ 0˚ 30˚N 30˚N 60˚N 60˚N
Err CH4 [%]
0.0 0.2 0.4 0.6 0.8 1.0 1.2 1.4 1.6 1.8 2.0 2.2 2.4 2.6 2.8 3.0 3.2
Jun - Aug 2004 channel 8
2006
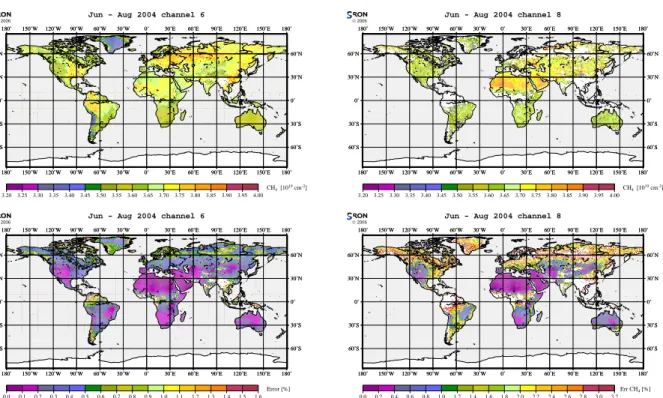
Fig. 1. Three-month methane averages obtained from the 1.65µm (upper left) and the 2.33µm (upper right) windows. The associated errors are shown in the lower panels (note the different colour scales).
This disadvantage could be largely offset by the fact that the entire wavelength range of channel 8 (2.265–2.38µm) contains CH4lines, and using the entire range instead of the above-mentioned window for retrieval would reduce the
noise errors by a factor of about 3. Unfortunately, the already mentioned ice layer is not uniformly present on the detector window, making a correction over a broader wavelength range almost impossible.
Another unfortunate effect of the ice layer is light scattering, whereby the instrument slit function is changed and up to 20% of the light ends up in detector pixels corresponding to other wavelengths. A correction for this effect is employed in the retrievals, but this correction has to be carefully calibrated on regions where the natural variation of CH4 is not
influenced by local sources, and where the signal-to-noise ratio is good (typically the Sahara). To arrive at the desired CH4total column accuracy of∼1% constitutes a challenge.
A principle difficulty in the interpretation of the channel 8 retrieved columns is that there appears to be no suitable means to normalise the results in order to minimise the effects of undetected clouds and of aerosols. The need of such a normali-sation will be illustrated in following sections. Nitrous oxide columns can be retrieved from channel 8 measurements, but their accuracy (∼5%) is not sufficient in the light of the desired CH4accuracy.
In contrast, the measurements in channel 6 do have such a normalising possibility through the use of the CO2window
at 1.58µm. As will be seen in the following sections, it is absolutely necessary to carry out a normalisation, since variations of 5–10% occur in uncorrected CH4and in CO2in this window [6]. A problem that may arise is the wavelength
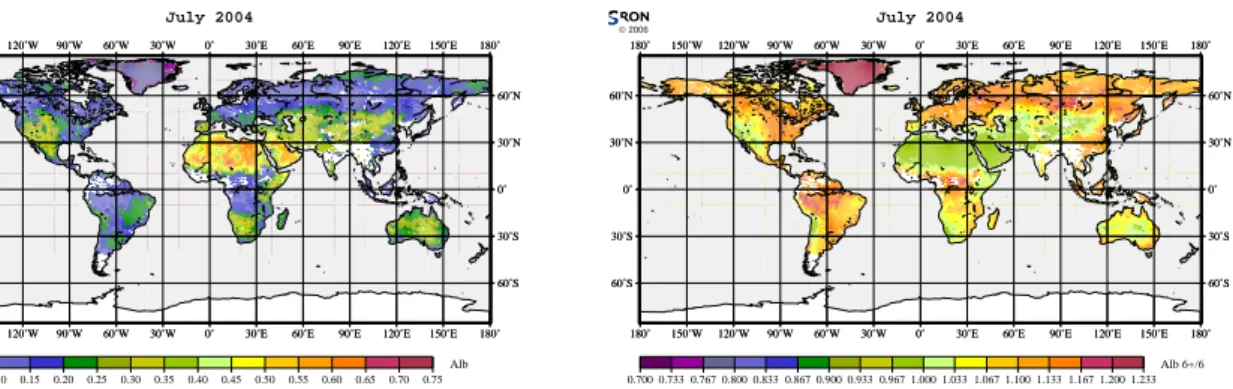
dependence of the ground albedo. If the ground albedo is different for the 1.58 and 1.65µm bands, then in the presence of aerosols the optical path lengths can be different for the two bands [6], and the retrieved columns are no longer entirely equivalent in this sense. Fig. 2 gives a global image of such albedo differences. Variations of±10% (outside snow and ice regions) can be seen. It is estimated that variations of this size have an maximum influence of∼1% on the retrieved columns.
Nevertheless a good understanding of the channel 8 methane results is necessary in view of the carbon monoxide retrievals from the same channel [2]. Since columns of both molecules (and water vapour) have to be retrieved at the same time, errors in the methane results can influence the quality of the carbon monoxide results.
j k 180˚ 180˚ 150˚W 150˚W 120˚W 120˚W 90˚W 90˚W 60˚W 60˚W 30˚W 30˚W 0˚ 0˚ 30˚E 30˚E 60˚E 60˚E 90˚E 90˚E 120˚E 120˚E 150˚E 150˚E 180˚ 180˚ 60˚S 60˚S 30˚S 30˚S 0˚ 0˚ 30˚N 30˚N 60˚N 60˚N 180˚ 180˚ 150˚W 150˚W 120˚W 120˚W 90˚W 90˚W 60˚W 60˚W 30˚W 30˚W 0˚ 0˚ 30˚E 30˚E 60˚E 60˚E 90˚E 90˚E 120˚E 120˚E 150˚E 150˚E 180˚ 180˚ 60˚S 60˚S 30˚S 30˚S 0˚ 0˚ 30˚N 30˚N 60˚N 60˚N Alb
0.000.02 0.06 0.10 0.15 0.20 0.25 0.30 0.35 0.40 0.45 0.50 0.55 0.60 0.65 0.70 0.75
July 2004
2006
j k 180˚ 180˚ 150˚W 150˚W 120˚W 120˚W 90˚W 90˚W 60˚W 60˚W 30˚W 30˚W 0˚ 0˚ 30˚E 30˚E 60˚E 60˚E 90˚E 90˚E 120˚E 120˚E 150˚E 150˚E 180˚ 180˚ 60˚S 60˚S 30˚S 30˚S 0˚ 0˚ 30˚N 30˚N 60˚N 60˚N 180˚ 180˚ 150˚W 150˚W 120˚W 120˚W 90˚W 90˚W 60˚W 60˚W 30˚W 30˚W 0˚ 0˚ 30˚E 30˚E 60˚E 60˚E 90˚E 90˚E 120˚E 120˚E 150˚E 150˚E 180˚ 180˚ 60˚S 60˚S 30˚S 30˚S 0˚ 0˚ 30˚N 30˚N 60˚N 60˚N Alb 6+/6
0.700 0.733 0.767 0.800 0.833 0.867 0.900 0.933 0.967 1.000 1.033 1.067 1.100 1.133 1.167 1.200 1.233
July 2004
2006
Fig. 2. Effective ground albedos for the 1.65µm window (left) and ratio over those of the 1.58µm window (right).
20˚W 20˚W 0˚ 0˚ 20˚E 20˚E 40˚E 40˚E 60˚E 60˚E 40˚S 40˚S 20˚S 20˚S 0˚ 0˚ 20˚N 20˚N 40˚N 40˚N 60˚N 60˚N 20˚W 20˚W 0˚ 0˚ 20˚E 20˚E 40˚E 40˚E 60˚E 60˚E 40˚S 40˚S 20˚S 20˚S 0˚ 0˚ 20˚N 20˚N 40˚N 40˚N 60˚N 60˚N
Fig. 3. Typical comparison orbit.
3 COMPARISON
In the following comparisons the channel 6 derived total CH4columns have been normalised using CO2total columns
retrieved as described in [6]. The retrieved CO2 columns are compared to CO2 field values (depending on time and
longitude/latitude) derived from TM3 results; a correction factor is applied as follows:
CCH4(norm)=CCH4(retr)·Cair·rCO2/CCO2 (1)
where Cair is the total vertical air column of the standard atmosphere, rCO2 the column averaged volume mixing ratio
from the model field, and CCO2 the retrieved CO2column. The rCO2 are derived from a CO2simulation in TM3 based on
emissions optimised using ground measurements [9]. The channel 8 results have been normalised to standard sea level pressure using ground pressures from ECMWF data for the time and place of measurement.
The comparisons have concentrated on orbits that cover the entire African continent such as the one shown in Fig. 3. For each nadir state of these orbits an average difference between the channel 8 and channel 6 results was derived for all cloud-free SCIAMACHY observations. The cloud filtering was carried out as described in [7]. In order to do a comparisons based on individual SCIAMACHY observations, the difference in integration time between channel 6 (typically 0.25– 0.5 s) and channel 8 (0.5–1 s) has to be taken into account by combining several measurements with the shorter integration time to the longer integration time using weighted averaging, with weights based on instrument-noise derived individual column errors.
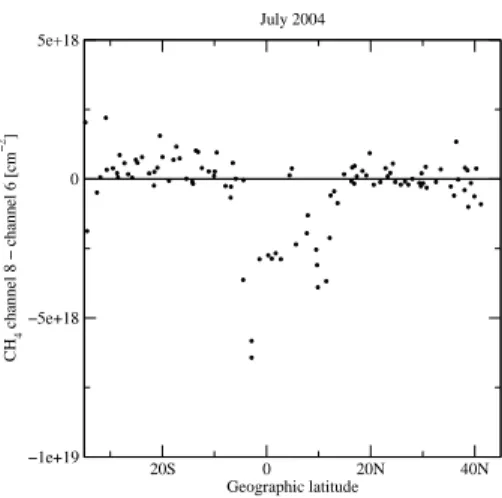
An example of the results for one month is shown in Fig. 4. Besides small deviations in the desert regions and larger standard deviations over the sea, the obvious feature of this plot are the systematic differences over tropical vegetated regions, where channel 8 results are about 10% too low in comparison with the channel 6 results. Similar differences are found in all other months.
There are several possible explanations for this effect. First of all, these regions are very cloudy, and partial clouds can escape detection by the cloud filter. Also, aerosols like smoke may decrease the retrieved columns in these regions where
20S 0 20N 40N Geographic latitude
0 5e+18
CH
4
]
July 2004
Fig. 4. Comparison for July 2004. Each point represents the average difference between the channel 8 and channel 6 CH4
columns (corrected as explained in section 3) for all cloud-free ground pixels of a state.
the ground albedo in the 2.33µm window is very low (of the order of 0.03). This has been studied in detail for a few states by comparison with the MODIS cloud product and the CO2results. It could be shown that both undetected clouds
and aerosols play a role. It is only partly possible to use the CO2results as a cloud filter, since in the case of aerosols the
CO2results can have normal values whereas the channel 8 CH4results are much lower. This effect is probably due to the
large difference in albedo for these regions (the 1.58µm albedo is of the order of 0.15, some five times higher than the 2.33µm value).
An alternative explanation would be a small offset in the dark signal calibration. Such an offset would alter the retrieved column values and the effect would be particularly visible in regions with low signal strength, i.e., over vegetated areas. The calibration has been compared with the raw dark signal measurements and also to the 250 km tangent height limb measurements (the latter to verify the orbital variations in the dark signal). The conclusion had to be that the errors would be way too small to explain the differences found.
Yet another explanation could be bias of the retrieval results for low signal levels. This has been extensively checked using Monte Carlo runs on synthetic spectra having the same noise characteristics as the measurement data. No evidence of such a bias was found at the signal levels involved.
Another type of differences between channel 8 and channel 6 results is visible above high-albedo regions, i.e., deserts. In these regions, the channel 8 columns are sometimes enhanced compared to the channel 6 results. This is visible in Fig. 1 in parts of the Sahara. There are strong indications that these enhancements are caused by radiative transfer effects in the presence of aerosols. This effect is strongly present in the CO2and CH4retrievals in the windows around 1.6µm (cf.
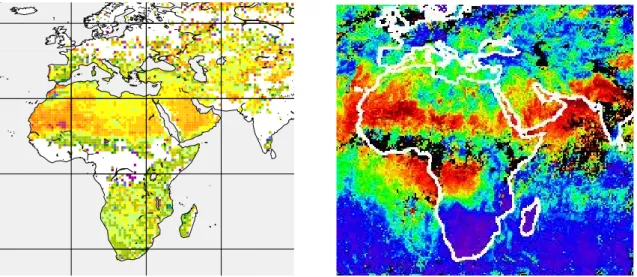
[6]), but, to a much lesser extent, it appears to show up in the channel 8 results. Fig. 5 shows a comparison of monthly CH4averages from channel 8 with the monthly mean aerosol optical depth from MISR observations, showing correlations
over desert regions.
This illustrates the need for a normalisation procedure; unfortunately there is no suitable retrievable molecule in the channel 8 wavelength region, as already pointed out in section 2. Channel 6 is at advantage here: although the effects of aerosols are much larger there, it can be largely corrected for using CO2normalisation as was shown for the first time by
Frankenberg et al. [3].
4 SUMMARY
The methane columns retrieved from channel 6 (1.63µm) are preferable to those obtained from channel 8 (2.33µm) for a number of reasons.
• The results from channel 8 are not easily normalised. There is no molecule like carbon dioxide or oxygen in or near the retrieval window. Using results from other wavelength regions is not reliable due to differences in radiative transfer. It has been shown that undetected clouds and aerosols can influence the results more than the desired
Fig. 5. Monthly average of CH4columns retrieved from channel 8 (left) and monthly averaged aerosol optical depth at
550 nm measured by MISR (right) for July 2004. Colour scale of left panel as in Fig. 1 (upper right), right panel from 0 (blue) to 0.6 (red).
accuracy. The use of CO2results as a cloud filter is only partly successful, again due to differences in radiative
transfer.
• The correction for the ice layer on the channel 8 detector window (causing transmission loss and scattering) is leaving uncertainties to the level of the desired CH4total column accuracy.
• The smaller signal-to-noise ratio in channel 8 leads to larger errors in the retrieved CH4columns.
The results obtained from channel 6 can be normalised using CO2results from the 1.58µm window. There can be errors
introduced due to differences in albedo, in the presence of aerosols in the ground scene.
Acknowledgements
SCIAMACHY is a joint project of the German Space Agency DLR and the Dutch Space Agency NIVR with contribution of the Belgian Space Agency BUSOC. SCIAMACHY data were provided by the European Space Agency. The work performed for this publication is partly financed by the European Commission (Fifth Framework on Energy, Environment, and Sustainable Development, Contract no. EVG-1-CT-2002-00079, project EVERGREEN). The authors thank Arjo Segers and Coen Schrijvers (KNMI) for providing ECMWF data per SCIAMACHY pixel.
5 REFERENCES
1. Buchwitz, M., de Beek, R., No¨el, S., Burrows, J.P., Bovensmann, H., Bremer, H., Bergamaschi, P., K¨orner, S., Heimann, M., Carbon monoxide, methane and carbon dioxide retrieved from SCIAMACHY by WFM-DOAS: year 2003 initial data set, Atmos. Chem. Phys., 5, 3313–3329, 2005.
2. de Laat, A.T.J., Gloudemans, A.M.S., Schrijver, H., van den Broek, M.M.P., Meirink, J.F., Aben, I., Krol, M., Quan-titative analysis of SCIAMACHY carbon monoxide total column measurements, Geophys. Res. Lett., 33, L07807, doi:10.1029/2005GL025530, 2006.
3. Frankenberg, C., Meirink, J.F., van Weele, M., Platt, U., Wagner, T., Assessing methane emissions from global space-borne observations, Science, 308, 1010–1014, 2005.
4. Frankenberg, C., Meirink, J.F., Bergamaschi, P., Goede, A.P H., Heimann, M., K¨orner, S., Platt, U., van Weele, M., Wagner, T., Satellite chartography of atmospheric methane from SCIAMACHY on board ENVISAT: Analysis of the years 2003 and 2004, J. Geophys. Res., 111, D07303, doi:10.1029/2005JD006235, 2006.
5. Gloudemans, A.M.S., Schrijver, H., Kleipool, Q., van den Broek, M.M.P., Straume, A.G., Lichtenberg, G., van Hees, R.M., Aben, I., Meirink, J.F, The impact of SCIAMACHY near-infrared instrument calibration on CH4and CO total
columns, Atmos. Chem. Phys., 5, 2369–2383, 2005.
6. Houweling, S., Hartmann, W., Aben, I., Schrijver, H., Skidmore, J., Roelofs, G.J., Breon, F.M., Evidence of system-atic errors in SCIAMACHY-observed CO2due to aerosols, Atmos. Chem. Phys., 5, 3003–3013, 2005.
7. Krijger, J.M., Aben, I., Schrijver, H., Distinction between clouds and ice/snow covered surfaces in the identification of cloud-free observations using SCIAMACHY PMDs, Atmos. Chem. Phys., 5, 2729–2738, 2005.
8. Lichtenberg, G., Kleipool, Q., Krijger, J.M. et al., SCIAMACHY level 1 data: calibration concept and in-flight calibration, Atmos. Chem. Phys. Disc., 5, 8925–8977, 2005.
9. R¨odenbeck, C. Houweling, S., Gloor, M., Heimann M., CO2flux history 1982–2001 inferred from atmospheric data
using a global inversion of atmospheric tracer transport, Atmos. Chem. Phys., 3, 1919–1964, 2003.
10. Schrijver, H., Retrieval of carbon monoxide, methane and nitrous oxide from SCIAMACHY measurements, in Proc. ESAMS, European Symposium on Atmospheric Measurements from Space, ESA WPP-161, 1, ESTEC, Noordwijk, The Netherlands, 285–294, 1999.
11. Straume, A.G., Schrijver, H., Gloudemans, A.M.S., Houweling, S., Aben, I., Maurellis, A.N., de Laat, A.T.J., Kleipool, Q., Lichtenberg, G., van Hees, R., Meirink, J.F., Krol, M., The global variation of CH4and CO as seen by