IBM Tivoli Composite Application Manager for Microsoft
Applications: Microsoft Internet Information Services Agent
vNext
User's Guide - Beta 1 Draft
IBM Tivoli Composite Application Manager for Microsoft
Applications: Microsoft Internet Information Services Agent
vNext
User's Guide - Beta 1 Draft
Note
Before using this information and the product it supports, read the information in “Notices” on page 377.
This edition applies to IBM Tivoli Composite Application Manager for Microsoft Applications: Microsoft Internet Information Services Agent (product number 5724-U18) and to all subsequent releases and modifications until otherwise indicated in new editions.
Contents
Tables . . . vii
Chapter 1. Overview of the agent . . . . 1
IBM Tivoli Monitoring . . . 1
Functions of the monitoring agent . . . 1
New in this release . . . 4
Components of the IBM Tivoli Monitoring environment . . . 4
Agent Management Services . . . 5
User interface options . . . 5
Data sources . . . 6
Chapter 2. Agent installation and
configuration
. . . 9
Requirements . . . 9
Language pack installation . . . 9
Installing language packs on Windows systems . . 9
Installing language packs on UNIX or Linux systems. . . 10
Silent installation of language packs on Windows, UNIX, or Linux systems . . . 10
Running as a non-administrator user . . . 12
Prerequisites checking . . . 13
Agent-specific installation and configuration . . . 14
Configuration values . . . 14
Remote installation and configuration . . . . 14
Chapter 3. Workspaces reference . . . 17
Predefined workspaces . . . 17
Workspace descriptions . . . 18
Microsoft Internet Information Services Navigator item . . . 19
Active Server Pages Navigator item . . . 19
ASP NET Navigator item . . . 19
Availability Navigator item . . . 20
Event Log Navigator item . . . 21
FTP Server Navigator item . . . 21
IIS Configuration Navigator item . . . 22
IIS Global Navigator item . . . 23
NNTP Server Navigator item . . . 24
SMTP Server Navigator item . . . 24
Web Server Navigator item . . . 24
Worker Process Navigator item . . . 26
Chapter 4. Attributes reference . . . . 29
Attribute groups for the monitoring agent . . . . 29
Attributes in each attribute group . . . 33
Active Server Pages attribute group . . . 33
Application Pool WAS attribute group . . . . 42
ASP NET attribute group . . . 47
ASP NET Apps Filter attribute group . . . 50
ASP NET Apps V4 attribute group . . . 52
Availability attribute group . . . 54
Centralized Certificate Details attribute group . . 59
Event Log attribute group . . . 60
Failed Request Tracing attribute group . . . . 63
Failed Request Tracing Rules attribute group . . 64
FTP Logon Attempt Restrictions Settings attribute group . . . 66
FTP Server Site Status attribute group . . . . 67
FTP Service attribute group . . . 68
FTP Site Dynamic IP and Domain Restrictions attribute group . . . 77
FTP Site IP and Domain Restrictions Settings attribute group . . . 78
FTP Version Information attribute group. . . . 79
HTTP Custom Error Messages attribute group. . 81
Http Error Log attribute group . . . 82
IIS Application Pools Details attribute group . . 85
IIS Application Pools Setting attribute group . . 87
IIS Components attribute group . . . 101
IIS FTP Server Bindings attribute group . . . 102
IIS FTP Server Status attribute group . . . . 103
IIS FTP Sites Detail attribute group . . . 104
IIS NNTP Server Status attribute group. . . . 106
IIS SMTP Server Status attribute group . . . . 107
IIS Version Information attribute group. . . . 109
IIS Web Server Bindings attribute group . . . 110
IIS Web Server Site Status attribute group . . . 111
IIS Web Server Status attribute group . . . . 113
IIS Web Sites Detail attribute group . . . 114
Internet Information Services Gl attribute group 116 Microsoft FTP Service attribute group . . . . 122
Mime Types attribute group . . . 130
MSMQ Incoming HTTP Traffic attribute group 131 NNTP Server attribute group . . . 133
NNTP Version Information attribute group . . 134
Performance Object Status attribute group . . . 135
SMTP Server attribute group . . . 140
SMTP Version Information attribute group . . 141
Thread Pool Status attribute group . . . 142
Virtual Domain Setting attribute group . . . . 146
W3SVC W3WP attribute group . . . 147
WAS W3WP attribute group . . . 162
Web Service attribute group . . . 167
Web Service Cache attribute group . . . 183
Web Service Extensions Restricted List attribute group . . . 189
Website Certificate Details attribute group . . . 191
Website Dynamic IP and Domain Restrictions attribute group . . . 193
Website Dynamic IP Restrictions Settings attribute group . . . 194
Website IP and Domain Restrictions Settings attribute group . . . 196
Website Virtual Dir Details attribute group . . 197
Websites W3C Logs attribute group . . . 198
Chapter 5. Situations reference. . . . 207
Predefined situations . . . 207
Situation descriptions. . . 209
Microsoft Internet Information Services Navigator item . . . 210
Active Server Pages Navigator item . . . 210
ASP NET Navigator item . . . 212
Availability Navigator item . . . 212
Event Log Navigator item . . . 218
FTP Server Navigator item . . . 231
IIS Configuration Navigator item . . . 232
IIS Global Navigator item . . . 233
NNTP Server Navigator item . . . 233
SMTP Server Navigator item . . . 233
Web Server Navigator item . . . 233
Worker Process Navigator item . . . 236
Chapter 6. Take Action commands
reference . . . 237
Predefined Take Action commands . . . 237
Take Action command descriptions . . . 238
Start Application Host Helper Service action 238 Start Application Pool action . . . 239
Start FTP Publishing Service action . . . 240
Start FTP Site action . . . 241
Start FTP Site by Name action . . . 242
Start HTTP SSL Service action . . . 243
Start IIS Admin Service action . . . 244
Start IIS web server action . . . 245
Start Microsoft FTP Service action . . . 246
Start Net.Msmq Listener Adapter Service action 247 Start Net.Pipe Listener Adapter Service action 248 Start Net.Tcp Listener Adapter Service action 249 Start Net.Tcp Port Sharing Service action . . . 250
Start Network News Transfer Protocol Service action . . . 250
Start Simple Mail Transfer Protocol Service action . . . 251
Start Web Management Service action . . . . 252
Start Website action . . . 253
Start Website by Name action . . . 254
Start Windows Process Activation Service action 255 Stop Application Host Helper Service action . . 256
Stop Application Pool action . . . 257
Stop FTP Publishing Service action . . . 258
Stop FTP Site action . . . 259
Stop FTP Site by Name action . . . 260
Stop HTTP SSL Service action . . . 261
Stop IIS Admin Service action . . . 262
Stop IIS web server action . . . 262
Stop Microsoft FTP Service action . . . 263
Stop Net.Msmq Listener Adapter Service action 264 Stop Net.Pipe Listener Adapter Service action 264 Stop Net.Tcp Listener Adapter Service action 265 Stop Net.Tcp Port Sharing Service action . . . 266
Stop Network News Transfer Protocol Service action . . . 267
Stop Simple Mail Transfer Protocol Service action . . . 267
Stop Web Management Service action . . . . 268
Stop Website action . . . 269
Stop Website by Name action . . . 270
Stop Windows Process Activation Service action 271
Chapter 7. Policies reference. . . 273
Predefined policies . . . 273
Chapter 8. Tivoli Common Reporting
for the monitoring agent
. . . 275
Cognos-based report packages. . . 275
Prerequisites. . . 275
Importing Cognos report packages . . . 277
Cognos data models and reports . . . 278
Chapter 9. Troubleshooting . . . 289
Trace logging . . . 290
Overview of log file management . . . 290
Principal trace log files . . . 291
Examples: Using trace logs . . . 293
RAS trace parameters . . . 294
Dynamic modification of trace settings . . . . 296
Setting trace parameters for the Tivoli Enterprise Console server . . . 299
Problems and workarounds . . . 300
Installation and configuration troubleshooting 300 Remote deployment troubleshooting . . . . 303
Agent troubleshooting . . . 303
Workspace troubleshooting . . . 308
Situation troubleshooting . . . 312
Take Action commands troubleshooting . . . 315
Tivoli Common Reporting troubleshooting . . 317
Support information . . . 318
Informational, warning, and error messages overview . . . 319
Message format . . . 319
Agent messages . . . 320
Appendix A. Event mapping . . . 335
Appendix B. Discovery Library
Adapter for the Microsoft IIS agent . . 363
DLA data model class types represented in CDM 363 DLA data model classes for Microsoft IIS agent . . 363
IIsWebServer class . . . 364
IISWebServices class . . . 364
TMSAgent class . . . 365
Appendix C. Integration with Tivoli
Business Service Manager
. . . 367
Components for integrating with Tivoli Business Service Manager . . . 367
Tasks to integrate the agent with Tivoli Business Service Manager . . . 368
Installing the Discovery Library Toolkit on the Tivoli Business Service Manager . . . 368
Configuring the Tivoli Event Integration Facility (EIF) probe to enrich events . . . 368
Creating a service in Tivoli Business Service Manager . . . 369
Creating a data source mapping for each data
source . . . 369
Configuring additional IBM Tivoli Monitoring web services. . . 370
Viewing data in the Tivoli Enterprise Portal . . 370
Appendix D. Documentation library
371
Prerequisite publications. . . 371Related publications . . . 372
Other sources of documentation . . . 372
Accessibility . . . 375
Notices . . . 377
Trademarks . . . 379
Tables
1. Attribute groups that display data for users who are members of the Administrators group. 12 2. Capacity planning for historical data logged
by the Microsoft IIS agent . . . 203 3. IIS Agent Reports Prerequisite Scanner report 279 4. Web Service Data Transfer report . . . 279 5. Active Server Pages Request and Error report 280 6. Web Server Availability In Terms Of Hours
report [Hourly Heat Map] . . . 281 7. Web Service HTTP Request report . . . . 282 8. Web Service Request Errors and Error Rate
report . . . 284 9. Web Sites Availability report . . . 286 10. Web Server Availability report . . . 288 11. Information to gather before contacting IBM
Software Support . . . 289
12. Trace log files for troubleshooting agents 291 13. Problems and solutions for installation and
configuration . . . 300 14. General problems and solutions for
uninstallation . . . 301 15. Remote deployment problems and solutions 303 16. Agent problems and solutions . . . 304 17. Workspace problems and solutions . . . . 309 18. Situation problems and solutions . . . 312 19. Take Action commands problems and
solutions . . . 315 20. Tivoli Common Reporting for Microsoft IIS
Chapter 1. Overview of the agent
The IBM Tivoli Composite Application Manager for Microsoft Applications: Microsoft Internet
Information Services Agent provides you with the capability to monitor Microsoft Internet Information Services. You can also use the agent to take basic actions with the Microsoft Internet Information Services. IBM®Tivoli® Monitoring is the base software for the Microsoft IIS agent. The Microsoft IIS agent monitors the following functions:
v Availability and resources v Error and event log v Performance v Historical data
IBM Tivoli Monitoring
IBM Tivoli Monitoring provides a way to monitor the availability and performance of all the systems in your enterprise from one or several designated workstations. It also provides useful historical data that you can use to track trends and to troubleshoot system problems.
You can use IBM Tivoli Monitoring to achieve the following tasks:
v Monitor for alerts on the systems that you are managing by using predefined situations or custom
situations.
v Establish your own performance thresholds. v Trace the causes leading to an alert.
v Gather comprehensive data about system conditions.
v Use policies to take actions, schedule work, and automate manual tasks.
The Tivoli Enterprise Portal is the interface for IBM Tivoli Monitoring products. You can use the consolidated view of your environment as seen in the Tivoli Enterprise Portal to monitor and resolve performance issues throughout the enterprise.
See the IBM Tivoli Monitoring publications listed in “Prerequisite publications” on page 371 for complete information about IBM Tivoli Monitoring and the Tivoli Enterprise Portal.
Functions of the monitoring agent
Availability MonitoringMonitors the following services and processes:
v IIS Admin Service
v World Wide Web Publishing Service v FTP Publishing Service [MS FTP V6.0]
v Network News Transfer Protocol (NNTP) Service [MS IIS V6.0] v Simple Mail Transfer Protocol (SMTP) Service
v HTTP SSL Service [MS IIS V6.0]
v Windows Process Activation Service (WAS) [MS IIS V7.x and later] v Application Host Helper Service [MS IIS V7.x and later]
v Web Management Service [MS IIS V7.x and later] v Net.Pipe Listener Adapter Service [MS IIS V7.x]
v Net.Tcp Listener Adapter Service [MS IIS V7.x] v Net.Msmq Listener Adapter Service [MS IIS V7.x] v Net.Tcp Port Sharing Service
v Microsoft FTP Service [MS FTP V7.x] v DCOM DLL Host Process
v ASP.Net Worker Process
Note:The services for which the IIS version is not mentioned are applicable to both IIS V6.0 and IIS V7.x.
Error and Event log Monitoring
Monitors for the following event sources that affect Microsoft IIS Server availability or performance:
v IISADMIN v FtpCtrs v IISInfoCtrs v W3Ctrs v W3SVC-WP v HostableWebCore
v Microsoft-Windows-IIS-IISManager
v WMSVC
v IISService v WAS-LA v Http v IIS Config v IISCTLS v IISLOG v IISMAP v IISWMI v isapnp v MSFTPSVC
v NNTPSVC
v SMTPSVC
v W3SVC
v APPHOSTSVC
v IIS-METABASE v SMSvcHost 3.0.0.0 v WAS
v FTPSVC v DCOM
v IIS-METABASE
Performance monitoring
Gathers performance attributes in the following areas and provides situations where appropriate:
v Web Service v Web Service Cache
v Internet Information Service Gl v FTP Service
v ASP
v ASP.NET Applications
v WAS-W3WP
v W3SVC-W3WP
v Microsoft FTP Service v IIS Web Server Status v IIS FTP Server Status v IIS SMTP Server Status v IIS NNTP Server Status v IIS Version Information v FTP Version Information v SMTP Version Information v NNTP Version Information v IIS Web Server Sites Status v FTP Server Sites Status v SMTP Server
v NNTP Server v IIS Components
v Application Pools Settings v Mime Types
v HTTP Error Log
v Web Service Extensions Restricted List v HTTP Custom Error Messages
v IIS Web Server Bindings v IIS websites Detail v IIS FTP Server Bindings v IIS FTP Sites Detail v Website Certificate Details
Actions
Provides actions to start and stop websites, FTP sites, and the following services:
v IIS Admin Service
v World Wide Web Publishing Service v FTP Publishing Service
v Network News Transfer Protocol (NNTP) Service v Simple Mail Transfer Protocol (SMTP) Service v HTTP SSL Service
v Windows Process Activation Service (WAS) v Application Host Helper Service
v Web Management Service
v Net.Pipe Listener Adapter Service v Net.Tcp Listener Adapter Service v Net.Msmq Listener Adapter Service v Net.Tcp Port Sharing Service v Microsoft FTP Service
Reporting
Provides a history enablement file that generates reports for all the attributes that are collected.
New in this release
For the Microsoft IIS agent, the following enhancements were made since version 6.3, including the fix packs:
v New attribute groups:
– Failed Request Tracing – Failed Request Tracing Rules
v New or changed workspaces:
– Failed Request Tracing Statistics
v New or changed views:
– Failed Request Tracing Summary – Failed Request Tracing Rules Summary
v New or changed situations:
– KQ7_WAS_SID_Mappings_Failed – KQ7_WAS_Terminated
v Updatedkq7.baroc file to support IBM Tivoli Enterprise Console® event mapping changes
v Added the self describing agent support for the monitoring agent to generate agent support files as
part of the agent image
v Integration with Tivoli Business Service Manager V6.1, or later v Added new Cognos data models and reports
Components of the IBM Tivoli Monitoring environment
After you install and set up the Microsoft IIS agent, you have an environment that contains the client, server, and monitoring agent implementation for Tivoli Monitoring.
This Tivoli Monitoring environment contains the following components: Tivoli Enterprise Portal client
The portal has a user interface based on Java™for viewing and monitoring your enterprise. Tivoli Enterprise Portal Server
The portal server is placed between the client and the Tivoli Enterprise Monitoring Server and enables retrieval, manipulation, and analysis of data from the monitoring agents. The Tivoli Enterprise Portal Server is the central repository for all user data.
Tivoli Enterprise Monitoring Server
The monitoring server acts as a collection and control point for alerts received from the monitoring agents, and collects their performance and availability data. The Tivoli Enterprise Monitoring Server is also a repository for historical data.
Tivoli Enterprise Monitoring Agent, Microsoft IIS agent
This monitoring agent collects data and distributes the data to the Tivoli Enterprise Monitoring Server, Tivoli Enterprise Portal Server, Tivoli Enterprise Portal, Tivoli Data Warehouse, and Tivoli Integrated Portal.
IBM Tivoli Netcool/OMNIbus
Tivoli Netcool/OMNIbus is an optional component and the recommended event management component. The Netcool/OMNIbus software is a service level management (SLM) system that delivers real-time, centralized monitoring of complex networks and IT domain events. Event information is tracked in a high-performance, in-memory database and presented to specific users through individually configurable filters and views. The software includes automation functions
that you can use to perform intelligent processing on managed events. You can use this software to forward events for Tivoli Monitoring situations to Tivoli Netcool/OMNIbus.
IBM Tivoli Enterprise Console
The Tivoli Enterprise Console is an optional component that acts as a central collection point for events from various sources, including events from other Tivoli software applications, Tivoli partner applications, custom applications, network management platforms, and relational database systems. You can view these events through the Tivoli Enterprise Portal (by using the event viewer), and you can forward events from Tivoli Monitoring situations to the Tivoli Enterprise Console component. If you do not already use Tivoli Enterprise Console and need an event management component, you can choose to use IBM Tivoli Netcool/OMNIbus.
IBM Tivoli Common Reporting
Tivoli Common Reporting is a separately installable feature available to users of Tivoli software that provides a consistent approach to generating and customizing reports. Some individual products provide reports that are designed for use with Tivoli Common Reporting and have a consistent look and feel.
IBM Tivoli Application Dependency Discovery Manager (TADDM)
TADDM delivers automated discovery and configuration tracking capabilities to build application maps that provide real-time visibility into application complexity.
IBM Tivoli Business Service Manager
The Tivoli Business Service Manager component delivers real-time information to help you respond to alerts effectively based on business requirements. Optionally, you can use this component to meet service-level agreements (SLAs). Use the Tivoli Business Service Manager tools to help build a service model that you can integrate with Tivoli Netcool/OMNIbus alerts or optionally integrate with data from an SQL data source. Optional components provide access to data from other IBM Tivoli applications such as Tivoli Monitoring and TADDM.
Agent Management Services
You can use IBM Tivoli Monitoring Agent Management Services to manage the Microsoft IIS agent. Agent Management Services is available for the following IBM Tivoli Monitoring OS agents: Windows, Linux, and UNIX. The services are designed to keep the Microsoft IIS agent available, and to provide information about the status of the product to the Tivoli Enterprise Portal. For more information about Agent Management Services, seeAgent Management Servicesin theIBM Tivoli Monitoring Administrator's Guide. IBM Tivoli Monitoring V6.2.2, Fix Pack 2 or later provides support for Agent Management Services.
User interface options
Installation of the base IBM Tivoli Monitoring software and other integrated applications provides various interfaces that you can use to work with your resources and data.
The following interfaces are available: Tivoli Enterprise Portal user interface
You can run the Tivoli Enterprise Portal as a desktop application or a browser application. The client interface is a graphical user interface (GUI) based on Java on a Windows or Linux
workstation. The browser application is automatically installed with the Tivoli Enterprise Portal Server. The desktop application is installed by using the Tivoli Monitoring installation media or with a Java Web Start application. To start the Tivoli Enterprise Portal browser client in your Internet browser, enter the URL for a specific Tivoli Enterprise Portal browser client installed on your Web server.
Command-line interface
configuration. You can also run commands at the Tivoli Enterprise Console event server or the Tivoli Netcool/OMNIbus ObjectServer to configure event synchronization for enterprise situations.
Manage Tivoli Enterprise Monitoring Services window
You can use the window for the Manage Tivoli Enterprise Monitoring Services utility to configure the agent and start Tivoli services not designated to start automatically.
IBM Tivoli Netcool/OMNIbus event list
You can use the Netcool/OMNIbus event list to monitor and manage events. An event is created when the Netcool/OMNIbus ObjectServer receives an event, alert, message, or data item. Each event is made up of columns (or fields) of information that are displayed in a row in the ObjectServer alerts.status table. The Tivoli Netcool/OMNIbus web GUI is also a web-based application that processes network events from one or more data sources and presents the event data in various graphical formats.
IBM Tivoli Enterprise Console
You can use the Tivoli Enterprise Console to help ensure the optimal availability of an IT service for an organization. The Tivoli Enterprise Console is an event management application that integrates system, network, database, and application management. If you do not already use Tivoli Enterprise Console and need an event management component, you can choose to use Tivoli Netcool/OMNIbus.
IBM Tivoli Common Reporting
Use the Tivoli Common Reporting web user interface for specifying report parameters and other report properties, generating formatted reports, scheduling reports, and viewing reports. This user interface is based on the Tivoli Integrated Portal.
IBM Tivoli Application Dependency Discovery Manager
The Discovery Management Console is the TADDM client user interface for managing discoveries.
IBM Tivoli Business Service Manager
The Tivoli Business Service Manager console provides a graphical user interface that you can use to logically link services and business requirements within the service model. The service model provides an operator with a second-by-second view of how an enterprise is performing at any moment in time or how the enterprise performed over a time period.
Data sources
Monitoring agents collect data from specific data sources. The Microsoft IIS agent collects data from the following sources:
WMI By using WMI (Windows Management Instrumentation), you can monitor and control managed resources throughout the network. Resources include hard drives, file systems, operating system settings, processes, services, shares, registry settings, networking components, event logs, users, and groups. WMI is built into clients with Windows 2000 or later, and can be installed on any 32-bit Windows client.
Perfmon
Use the Windows Performance Monitor, or Perfmon, to view various system and application performance metrics for collection and use by management applications. You typically view system metrics on a Windows system through the 'perfmon' application.
Scripts
The agent uses application-specific commands and interfaces to gather metrics. Log files
The agent uses the file system to monitor application log files or other data files to gather metrics.
Windows Event Log
The agent collects Windows Event Log entries related to the monitored resource and forwards them to IBM Tivoli Monitoring.
Chapter 2. Agent installation and configuration
Agent installation and configuration requires the use of theIBM Tivoli Monitoring Installation and Setup Guideand agent-specific installation and configuration information.
To install and configure the Microsoft IIS agent, use theInstalling monitoring agentsprocedures in theIBM Tivoli Monitoring Installation and Setup Guidealong with the agent-specific installation and configuration information.
If you are installing silently by using a response file, seePerforming a silent installation of IBM Tivoli Monitoringin theIBM Tivoli Monitoring Installation and Setup Guide.
With the self-describing agent capability, new or updated IBM Tivoli Monitoring agents using IBM Tivoli Monitoring V6.2.3 or later can become operational after installation without having to perform additional product support installation steps. To take advantage of this capability, seeEnabling self-describing agent capability at the hub monitoring serverin theIBM Tivoli Monitoring Installation and Setup Guide. Also, see
Self-describing monitoring agentsin theIBM Tivoli Monitoring Administrator's Guide.
Requirements
Before installing and configuring the agent, make sure your environment meets the requirements for the IBM Tivoli Composite Application Manager for Microsoft Applications: Microsoft Internet Information Services Agent.
For information about requirements, see the Prerequisites topic for the agent in the IBM Tivoli Composite Application Manager for Microsoft Applications Information Center (http://publib.boulder.ibm.com/ infocenter/tivihelp/v24r1/topic/com.ibm.itcamms.doc_6.3/welcome_msapps63.html).
Language pack installation
The steps for installing language packs depend on which operating system and mode of installation you are using.
To install a language pack for the agent support files on the Tivoli Enterprise Monitoring Server, the Tivoli Enterprise Monitoring Agent, and the Tivoli Enterprise Portal Server, make sure that you installed the product in the English language. Then use the steps for the operating system or mode of installation you are using:
v “Installing language packs on Windows systems”
v “Installing language packs on UNIX or Linux systems” on page 10
v “Silent installation of language packs on Windows, UNIX, or Linux systems” on page 10
Installing language packs on Windows systems
You can install the language packs on a Windows system.Before you begin
First, make sure that you installed the product in the English language.
Procedure
1. On the language pack CD, double-click thelpinstaller.bat file to start the installation program. 2. Select the language of the installer and clickOK.
3. In the Introduction panel, clickNext 4. ClickAdd/Updateand clickNext.
5. Select the folder where the National Language Support package (NLSPackage) files are located. Typically, the NLSPackage files are located in thenlspackagefolder where the installer executable file is located.
6. Select the language support for the agent of your choice and clickNext. To make multiple selections, press Ctrl and select the language that you want.
7. Select the languages that you want to install and clickNext.
8. Examine the installation summary page and clickNextto begin installation. 9. After installation completes, clickFinish to exit the installer.
10. Restart the Tivoli Enterprise Portal, Tivoli Enterprise Portal Server, and Eclipse Help Server if any of these components are installed.
Installing language packs on UNIX or Linux systems
You can install the language packs on a UNIX or Linux system.Before you begin
First, make sure that you installed the product in the English language.
Procedure
1. Enter themkdir command to create a temporary directory on the computer, for example,mkdir
dir_name. Make sure that the full path of the directory does not contain any spaces. 2. Mount the language pack CD to the temporary directory that you created.
3. Enter the following command to start the installation program:cd dir_namelpinstaller.sh -c
install_dirwhereinstall_diris where you installed IBM Tivoli Monitoring. Typically, the directory name is/opt/IBM/ITMfor UNIX and Linux systems.
4. Select the language of the installer and clickOK. 5. In the Introduction panel, clickNext.
6. ClickAdd/Updateand clickNext.
7. Select the folder where the National Language Support package (NLSPackage) files are located. Typically, theNLSPackagefiles are located in thenlspackagefolder where the installer executable file is located.
8. Select the language support for the agent of your choice and clickNext. To make multiple selections, press Ctrl and select the language that you want.
9. Select the languages that you want to install and clickNext.
10. Examine the installation summary page and clickNextto begin installation. 11. After installation completes, clickFinish to exit the installer.
12. Restart the Tivoli Enterprise Portal, Tivoli Enterprise Portal Server, and Eclipse Help Server if any of these components are installed.
Silent installation of language packs on Windows, UNIX, or Linux
systems
You can use the silent-mode installation method to install the language packs. In silent mode, the installation process obtains the installation settings from a predefined response file. It does not prompt you for any information.
Before you begin
Procedure
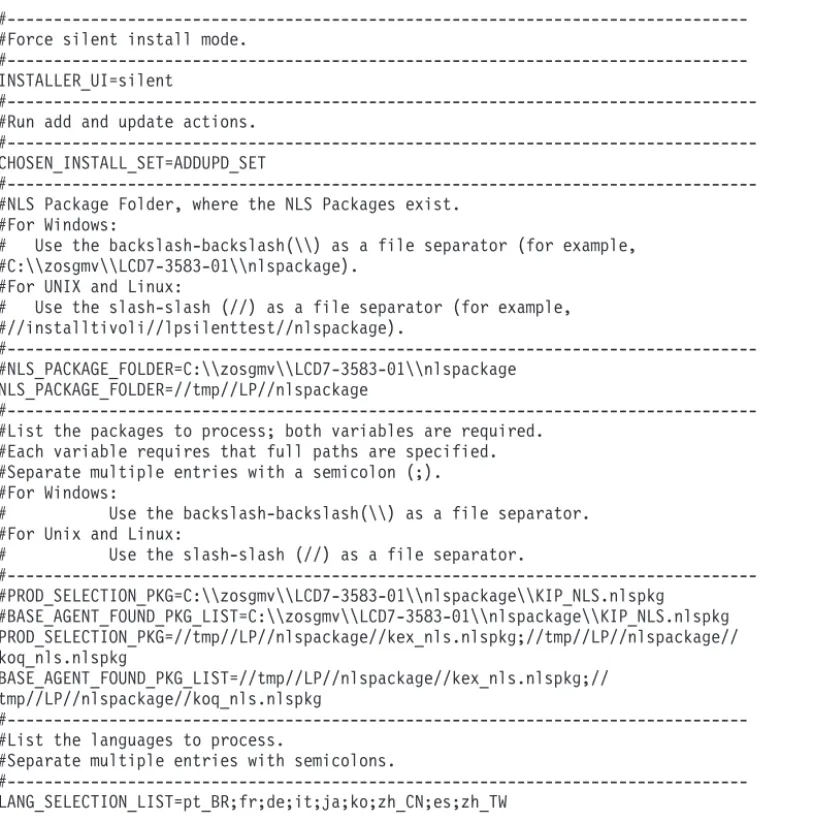
1. Copy and paste theITM_Agent_LP_silent.rsp response file template as shown in “Response file example.”
2. Change the following parameter settings: NLS_PACKAGE_FOLDER
Folder where the National Language Support package (NLSPackage) files are located. Typically, the NLSPackage files are located in the nlspackagefolder, for example: NLS_PACKAGE_FOLDER = //tmp//LP//nlspackage.
PROD_SELECTION_PKG
Name of the language pack to install. Several product components can be included in one language package. You might want to install only some of the available components in a language pack.
BASE_AGENT_FOUND_PKG_LIST
Agent for which you are installing language support. This value is usually the same as
PROD_SELECTION_PKG. LANG_SELECTION_LIST
Language you want to install.
3. Enter the command to install the language pack with a response file (silent installation):
v For Windows systems:
lpinstaller.bat -f path_to_response_file
v For UNIX or Linux systems:
lpinstaller.sh -c candle_home -f path_to_response_file
wherecandle_homeis the IBM Tivoli Monitoring base directory.
Response file example
# IBM Tivoli Monitoring Agent Language Pack Silent Installation Operation #
#This is a sample response file for silent installation mode for the IBM Tivoli #Monitoring Common Language Pack Installer.
#.
#This file uses the IBM Tivoli Monitoring Common Agent Language Pack with the #install package as an example.
#Note:
#This response file is for the INSTALLATION of language packs only.
#This file does not support UNINSTALLATION of language packs in silent mode. #---#To successfully complete a silent installation of the the example of Common Agent #localization pack, complete the following steps:
#
#1.Copy ITM_Agent_LP_silent.rsp to the directory where lpinstaller.bat or #lpinstaller.sh is located (IBM Tivoli Monitoring Agent Language Pack build #location).
#
#2.Modify the response file so that it is customized correctly and completely for #your site.
# Complete all of the following steps in the response file. #
#3.After customizing the response file, invoke the silent installation using the #following command:
#For Windows:
# lpinstaller.bat -f <path_to_response_file> #For UNIX and Linux:
# lpinstaller.sh -c <candle_home> -f <path_to_response_file> #Note:<candle_home> is the IBM Tivoli Monitoring base directory.
#---#Force silent install mode.
#---INSTALLER_UI=silent
#---#Run add and update actions.
#---CHOSEN_INSTALL_SET=ADDUPD_SET
#---#NLS Package Folder, where the NLS Packages exist.
#For Windows:
# Use the backslash-backslash(\\) as a file separator (for example, #C:\\zosgmv\\LCD7-3583-01\\nlspackage).
#For UNIX and Linux:
# Use the slash-slash (//) as a file separator (for example, #//installtivoli//lpsilenttest//nlspackage).
#---#NLS_PACKAGE_FOLDER=C:\\zosgmv\\LCD7-3583-01\\nlspackage
NLS_PACKAGE_FOLDER=//tmp//LP//nlspackage
#---#List the packages to process; both variables are required.
#Each variable requires that full paths are specified. #Separate multiple entries with a semicolon (;). #For Windows:
# Use the backslash-backslash(\\) as a file separator. #For Unix and Linux:
# Use the slash-slash (//) as a file separator.
#---#PROD_SELECTION_PKG=C:\\zosgmv\\LCD7-3583-01\\nlspackage\\KIP_NLS.nlspkg
#BASE_AGENT_FOUND_PKG_LIST=C:\\zosgmv\\LCD7-3583-01\\nlspackage\\KIP_NLS.nlspkg PROD_SELECTION_PKG=//tmp//LP//nlspackage//kex_nls.nlspkg;//tmp//LP//nlspackage// koq_nls.nlspkg
BASE_AGENT_FOUND_PKG_LIST=//tmp//LP//nlspackage//kex_nls.nlspkg;// tmp//LP//nlspackage//koq_nls.nlspkg
#---#List the languages to process.
#Separate multiple entries with semicolons.
#---LANG_SELECTION_LIST=pt_BR;fr;de;it;ja;ko;zh_CN;es;zh_TW
Running as a non-administrator user
You can run the monitoring agent for Internet Information Services as a non-administrator user. However, some functionality is unavailable. To create a non-administrator user, create a new user and set up
registry permissions for the new user as follows :
v Full access to theHKEY_LOCAL_MACHINE\SOFTWARE\Candle directory
v Read access to theHKEY_LOCAL_MACHINE\SOFTWARE\Microsoft\Windows NT\CurrentVersion\Perflib
directory
If you define these permissions for a non-administrator user, data is displayed for all the Perfmon-based attribute groups. See “Data sources” on page 6 for a list of all the Perfmon-based attributes. The
non-administrator user must be a member of the Performance Monitor Users and Performance Log Users groups.
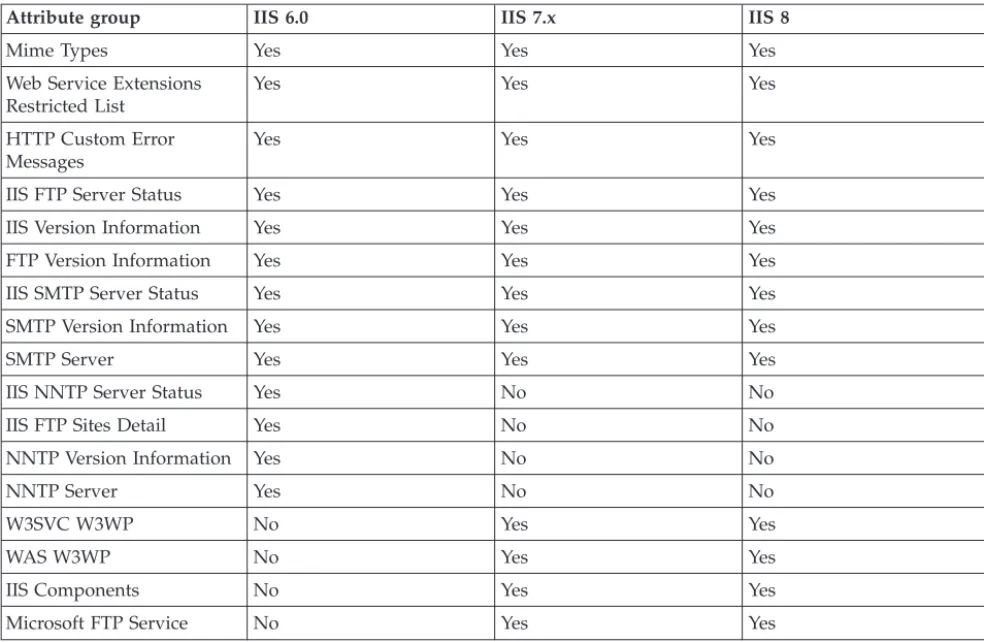
The following table contains the attribute groups for the IIS Server versions that display data for users who are members of theAdministratorsgroup.
Table 1. Attribute groups that display data for users who are members of the Administrators group
Attribute group IIS 6.0 IIS 7.x IIS 8
ASP NET Apps Filter Yes Yes Yes
Table 1. Attribute groups that display data for users who are members of the Administrators group (continued)
Attribute group IIS 6.0 IIS 7.x IIS 8
Mime Types Yes Yes Yes
Web Service Extensions Restricted List
Yes Yes Yes
HTTP Custom Error Messages
Yes Yes Yes
IIS FTP Server Status Yes Yes Yes
IIS Version Information Yes Yes Yes
FTP Version Information Yes Yes Yes
IIS SMTP Server Status Yes Yes Yes
SMTP Version Information Yes Yes Yes
SMTP Server Yes Yes Yes
IIS NNTP Server Status Yes No No
IIS FTP Sites Detail Yes No No
NNTP Version Information Yes No No
NNTP Server Yes No No
W3SVC W3WP No Yes Yes
WAS W3WP No Yes Yes
IIS Components No Yes Yes
Microsoft FTP Service No Yes Yes
Prerequisites checking
The prerequisite checker utility verifies whether all the prerequisites that are required for the agent installation are met. The prerequisite checker creates a log file that contains a report of all the prerequisites checks when the prerequisite checker was run.
For the Microsoft IIS agent, the prerequisite checker verifies the following requirements:
v Memory v Disk
v Operating systems
v Microsoft Internet Information Services versions
Additionally, the prerequisite checker verifies whether the user, who installs the agent, is a member of the Administrators group.
For detailed information about installation prerequisites, see the Prerequisites topic for the agent in the IBM Tivoli Composite Application Manager for Microsoft Applications Information Center
(http://publib.boulder.ibm.com/infocenter/tivihelp/v24r1/topic/com.ibm.itcamms.doc_6.3/ welcome_msapps63.html ).
You can run the prerequisite checker in stand-alone mode or remotely. For more information about the prerequisite checker, see "Prerequisite Checking for IBM Tivoli Monitoring Agents" in theIBM Tivoli Monitoring Installation and Setup Guide.
Agent-specific installation and configuration
In addition to the installation and configuration information in theIBM Tivoli Monitoring Installation and Setup Guide, use this agent-specific installation and configuration information to install the Microsoft IIS agent.
Configuration values
For both local and remote configuration, you provide the configuration values for the agent to operate. When you are configuring an agent, a panel is displayed so you can enter each value. When a default value exists, this value is pre-entered into the field. If a field represents a password, two entry fields are displayed. You must enter the same value in each field. The values you type are not displayed to help maintain the security of these values.
The configuration for this agent is organized into the following groups: HTTP Error Log Configuration (HTTP_ERROR_LOG)
The configuration elements defined in this group are always present in the agent's configuration. This group defines information that applies to the entire agent.
Log File Directory (KQ7_HTTP_ERROR_LOG_FILE) HTTP Error Log File Directory
The type is string. This value is optional.
Default value: C:\WINDOWS\system32\LogFiles\HTTPERR Site Log Configuration (SITE_LOG)
The configuration elements defined in this group are always present in the agent's configuration. This group defines information that applies to the entire agent.
Log File Directory (KQ7_SITE_LOG_FILE) Site Log File Directory
The type is string. This value is optional.
Default value: C:\inetpub\logs\LogFiles
Remote installation and configuration
You can install the monitoring agent remotely from the Tivoli Enterprise Portal or from the command line.
When installing the agent remotely, you must provide the configuration values for the agent to operate. See “Configuration values.”
To install from the portal, see theIBM Tivoli Monitoring Installation and Setup Guide.
To remotely install or configure an agent through the Tivoli Enterprise Portal, you must have installed the application support for that agent (Tivoli Enterprise Monitoring Server, Tivoli Enterprise Portal Server, and Tivoli Enterprise Portal). You must also have installed the agent bundle into the Remote Deploy Depot.
For information about displaying the configuration options that are available to use with the
configureSystemoraddSystemcommands see "tacmd describeSystemType" in theIBM Tivoli Monitoring Command Reference.
If you are using the command line, the following command is an example of remote installation and configuration for Windows operating systems:
tacmd addSystem -t Q7 -n Primary:sample.node.name:NT -p HTTP_ERROR_LOG.KQ7_HTTP_ERROR_LOG_FILE=value
Chapter 3. Workspaces reference
A workspace is the working area of the Tivoli Enterprise Portal application window. The Navigator tree contains a list of the workspaces provided by the agent.
About workspaces
Use the Navigator tree to select the workspace you want to see. As part of the application window, the status bar shows the Tivoli Enterprise Portal Server name and port number to which the displayed information applies and the ID of the current user.
When you select an item in the Navigator tree, a default workspace is displayed. When you right-click a Navigator item, a menu that includes a Workspace item is displayed. The Workspace item contains a list of workspaces for that Navigator item. Each workspace has at least one view. Some views have links to other workspaces. You can also use the Workspace Gallery tool as described in theTivoli Enterprise Portal User's Guideto open workspaces.
The workspaces in the Navigator are displayed in a Physical view that shows your enterprise as a physical mapping or a dynamically populated logical view that is agent-specific. You can also create a Logical view. The Physical view is the default view.
This monitoring agent provides predefined workspaces. You cannot modify or delete the predefined workspaces, but you can create new workspaces by editing them and saving the changes with a different name.
Workspace views can be any combination of query-based views, event views, and special purpose views.
Additional information about workspaces
For more information about creating, customizing, and working with workspaces, see "Using workspaces" in theTivoli Enterprise Portal User's Guide.
For a list of the predefined workspaces for this monitoring agent and a description of each workspace, see Predefined workspaces and the information about each individual workspace.
Some attribute groups for this monitoring agent might not be represented in the predefined workspaces or views for this agent. For a full list of the attribute groups, see “Attribute groups for the monitoring agent” on page 29.
Predefined workspaces
The Microsoft IIS agent provides predefined workspaces, which are organized by Navigator item.
v Microsoft Internet Information Services Navigator item
– Microsoft Internet Information Services workspace
v Active Server Pages Navigator item
– Active Server Pages workspace
– Session and Transaction Statistics workspace
v ASP NET Navigator item
– ASP NET workspace
– Availability workspace
– Performance Object Status workspace – Thread Pool Status workspace
v Event Log Navigator item
– Event Log workspace
v FTP Server Navigator item
– Data and File Traffic Statistics workspace – FTP Server workspace
– FTP Site Dynamic IP and Domain Restrictions Statistics workspace – User and Connection Statistics workspace
– User and Connection Statistics for Microsoft FTP V6 workspace
v IIS Configuration Navigator item
– Identity and Recycling Application Pool Setting workspace – IIS Configuration workspace
– Mime Types and Extension Restriction List workspace – Performance and Health Application Pool Setting workspace – Website Requests and Errors Statistics workspace
v IIS Global Navigator item
– IIS Global workspace
– IIS Installed Components workspace – Server Status workspace
v NNTP Server Navigator item
– NNTP Server workspace
v SMTP Server Navigator item
– SMTP Server workspace
v Web Server Navigator item
– CGI and ISAPI Extension Request Statistics workspace – Data and File Transfer Statistics workspace
– Error Statistics workspace
– User Request Statistics workspace – Web Server workspace
– Web Server Cache Statistics workspace
– Website Dynamic IP and Domain Restrictions Statistics workspace
v Worker Process Navigator item
– WAS Application Pool Statistics workspace – WAS Worker Process Statistics workspace – Worker Process workspace
Workspace descriptions
Each workspace description provides information about the workspace such as the purpose and a list of views in the workspace.
Microsoft Internet Information Services Navigator item
The workspace descriptions are organized by the Navigator item to which the workspaces are relevant. Microsoft Internet Information Services workspace
This workspace provides information about Microsoft IIS web server V6.0 and V7.x, including the application pool state and the availability of services and processes.
This workspace contains the following views: ASP Request Traffic
Displays the average number of ASP requests that were executed per second. Web Data Traffic
Displays the rate in seconds at which data in KB was sent and received by the web server.
File Cache Lookup
Displays the number of successful and unsuccessful lookups in the file cache. BLOB Cache Lookup
Displays the number of successful and unsuccessful lookups in the Binary Large Objects (BLOB) cache.
Application Pool State
Displays the status of the individual application pool. Processes and Services
Displays the state of services and processes in the application. The state is UP if the service is running and DOWN if the service exists but is not running.
Active Server Pages Navigator item
The workspace descriptions are organized by the Navigator item to which the workspaces are relevant. Active Server Pages workspace
This workspace displays statistics for ASP Requests and Errors. This workspace contains the following views:
Request and Error Statistics
Displays the information about Request and Error related attributes of ASP. Error Rate
Displays the average number of errors that occurred per second. Request Rate
Displays the average number of requests that were executed per second. Response Time
Displays the time, in milliseconds, that it took to execute the most recent request and the time the most recent request waited in the queue.
Request Statistics
Displays the number of Rejected, Not Found, Not Authorized, and Timed out requests for ASP.
Session and Transaction Statistics workspace
This workspace displays the session and transaction statistics for ASP. This workspace contains the following views:
Session and Transaction Statistics
Displays the information about sessions and transaction related attributes of ASP. Current Sessions
Displays the number of sessions currently being serviced. Transaction Rate
Displays the average number of transactions that have been started per second.
ASP NET Navigator item
The workspace descriptions are organized by the Navigator item to which the workspaces are relevant. ASP NET workspace
This workspace contains the following views: ASP.NET Application Statistics
Displays the attributes that provide information about a single instance of an ASP.NET application.
Infrastructure Error Event Rate
Displays the number of HTTP error events raised per second. Cache % Machine Memory
Displays the amount of physical memory used by the computer divided by the physical memory limit for the cache, as a percentage.
Cache % Process Memory
Displays the value of private bytes for the worker process divided by the private bytes memory limit for the cache, as a percentage.
Availability Navigator item
The workspace descriptions are organized by the Navigator item to which the workspaces are relevant. Availability workspace
The Availability workspace displays the overall health of the application. This workspace contains the following views:
Availability
Displays the state of each component in the application. Each process is displayed using a descriptive name, the name of the running process, and the state of the process (UP, DOWN, or PROCESS_DATA_NOT_AVAILABLE). Each service is displayed using a descriptive name, the short name of the service, and the state of the service (UP, DOWN, or UNKNOWN). The state is UP if the service is running, DOWN if the service exists but is not running. UNKNOWN indicates that the service is not installed, so these elements are filtered from the view. When the state of the component is DOWN (for a process, or service) it is highlighted with a red background.
Processor
Displays the amount of CPU used by each process that is a component of the application. This displays the 2 main components of CPU usage, privileged time which is time spent in the kernel on behalf of the process and user mode time, which is the time spent running the process code.
Threads
Displays the number of threads used by each process that is a component of the application.
Memory
Displays the amount of memory being consumed by each process that is a component of the application. This total (virtual) size of the process and the size of the process in memory (working set) are displayed.
Performance Object Status workspace
This workspace displays the overall health of the application. This workspace contains the following view:
Performance Object Status
Displays the status of the data collection from the application. Usually this will display NO ERROR indicating that the agent is collecting application data correctly. If some of the agent's other views are empty, then this view will help isolate the cause of the failure. PerfMon objects will display the object class name.
Thread Pool Status workspace
This workspace displays the information of the Thread Pool Status attribute group. This workspace contains the following view:
Thread Pool Status
Provides information about the Thread Pool Status attribute group and the status of the internal thread pool used to collect the data asynchronously.
Event Log Navigator item
The workspace descriptions are organized by the Navigator item to which the workspaces are relevant. Event Log workspace
The Event Log workspace shows the details for the recent events logged by the application to the Windows Event Log. By default, the agent only displays events that occur after the agent is started. Events are removed from the Event Log view 1 hour after they occur.
This workspace contains the following view: Event Log
Shows the recent Event Log entries for Microsoft Internet Information Server.
FTP Server Navigator item
The workspace descriptions are organized by the Navigator item to which the workspaces are relevant. Data and File Traffic Statistics workspace
This workspace displays the data and file traffic statistics of the Microsoft FTP service V7.x and later.
This workspace contains the following views: Data and File Traffic Statistics
Displays the attributes that provide information about data and file traffic of Microsoft FTP service V7.x and later.
Data Traffic
Displays the rate of data sent, received, and transferred by the Microsoft FTP service in KB per second.
File Traffic
Displays the rate of files sent, received, and transferred by the Microsoft FTP service per second.
FTP Server workspace
This workspace displays the data and file traffic statistics of FTP service V6. This workspace contains the following views:
Data and File Traffic Statistics
Displays the attributes that provide information about data and file traffic of FTP service. FTP Sites
Displays status for FTP sites running on Microsoft IIS FTP Server. Data Traffic
Displays the rate of data sent, received, and transferred by the FTP service in KB per second.
File Traffic
Displays the rate of files sent, received, and transferred by the FTP service per second. FTP Site Dynamic IP and Domain Restrictions Statistics workspace
This workspace displays the settings for the dynamic IP and domain restrictions of each FTP site. This workspace contains the following views:
FTP Site Dynamic IP and Domain Restrictions Summary
Displays the attributes that provide information about the dynamic IP and domain restrictions that are applied to each FTP site.
FTP Site IP and Domain Restrictions Settings Summary
Displays the attributes that provide configuration information about the dynamic IP and domain restrictions that are applied to each FTP site.
User and Connection Statistics workspace
This workspace displays the user and connection statistics of the Microsoft FTP service V7.x and later.
User and Connection Statistics
Displays the information about user and connection related attributes of Microsoft FTP service.
Current Users
Displays the number of users who currently have anonymous and nonanonymous connections that have been made by using the Microsoft FTP service.
Current Connections
Displays the current number of connections that have been established with the Microsoft FTP service.
% Current Users
Displays the percentage of users who have anonymous and nonanonymous connections that have been made by using the Microsoft FTP service.
Logon Attempt Rate
Displays the rate of number of logons that have been attempted by using the Microsoft FTP service per second.
User and Connection Statistics for Microsoft FTP V6 workspace
This workspace displays the user and connection statistics of FTP service V6. This workspace contains the following views:
User and Connection Statistics
Displays the information about user and connection related attributes of FTP service. Current Users
Displays the number of users who currently have anonymous and nonanonymous connections that were made by using the FTP service.
Current Connections
Displays the current number of connections that have been established with the FTP service.
% Current Users
Displays the percentage of users who have anonymous and nonanonymous connections that were made by using the FTP service.
Logon Attempt Rate
Displays the rate of number of logons that have been attempted by using the FTP service per second.
IIS Configuration Navigator item
The workspace descriptions are organized by the Navigator item to which the workspaces are relevant. Identity and Recycling Application Pool Setting workspace
This workspace displays the identity and recycling related setting for an application pool. This workspace contains the following views:
Recycling
Displays the recycling related configuration settings of an application pool. Identity
Displays the identity related configuration settings of an application pool. Application Pool Configuration
Displays the status and configuration settings of an application pool. IIS Configuration workspace
This workspace displays the HTTP custom error messages configured with web server and HTTP errors logged by HTTP API.
This workspace contains the following views: HTTP Custom Error Messages
Displays the information related to HTTP custom error messages. HTTP Error Log
Displays the information about HTTP errors logged by HTTP sys kernel in the Httperr log file.
Mime Types and Extension Restriction List workspace
This workspace displays the MIME types and web service extensions associated with web server. This workspace contains the following views:
Mime Types
Displays all the Multipurpose Internet Mail Extensions (MIME) types so that you can identify the types of content that can be served from a web server to a browser or a mail client.
Web Service Extension Restriction List
Displays information about all the available web service extensions for Microsoft IIS. Performance and Health Application Pool Setting workspace
This workspace displays the performance and health related setting for an application pool. This workspace contains the following views:
Performance
Displays the performance related configuration settings of an application pool. Health
Displays the health related configuration settings of an application pool. Website Requests and Errors Statistics workspace
This workspace displays the details of each request that arrives at a web server. This workspace contains the following view:
Website W3C Logs Summary
Displays information about each request that is compliant to the W3C format and that arrives at a web server.
IIS Global Navigator item
The workspace descriptions are organized by the Navigator item to which the workspaces are relevant. IIS Global workspace
This workspace displays the statistics for Internet Information Services Global object. This workspace contains the following views:
Global Parameters
Displays the attributes that show statistics for Internet Information Services Global object. % Cache Hits
Displays the percentage(%) hits for file cache and BLOB cache. Current Files Cached
Displays the number of files that are currently in the cache. Cache Memory Usage
Displays the current and maximum number of KB used for the file cache. Current BLOB Cached
Displays the number of BLOB information blocks that are currently in the cache. Active Flushed Entries
Displays the number of cached file handles that will close when all current transfers are complete.
IIS Installed Components workspace
This workspace displays the installed modules of IIS V7.x and later. This workspace contains the following view:
IIS Installed Components
Displays the installed module names of Microsoft IIS V7.x and later. Server Status workspace
This workspace displays the status and version information for SMTP, NNTP, FTP, and IIS web server.
This workspace contains the following views: Web Server Status
IIS Version
Displays the information about Microsoft IIS web server version. FTP Server Status
Displays the current status of the Microsoft IIS FTP Server. FTP Version
Displays the information about Microsoft IIS FTP Server version. NNTP Server Status
Displays the current status of the NNTP Server on Microsoft IIS 6.0. NNTP Version
Displays the information about NNTP Server version on Microsoft IIS 6.0. SMTP Server Status
Displays the current status of the Microsoft IIS SMTP Server. SMTP Version
Displays the information about Microsoft IIS SMTP Server version.
NNTP Server Navigator item
The workspace descriptions are organized by the Navigator item to which the workspaces are relevant. NNTP Server workspace
This workspace displays the status for each NNTP Virtual Server running on Microsoft IIS 6.0. This workspace contains the following view:
NNTP Virtual Server Status
Displays the status for each NNTP Virtual Server running on Microsoft IIS 6.
SMTP Server Navigator item
The workspace descriptions are organized by the Navigator item to which the workspaces are relevant. SMTP Server workspace
This workspace displays the status for each SMTP Virtual Server running on Microsoft IIS SMTP server.
This workspace contains the following view: SMTP Virtual Server Status
Displays the status for each SMTP Virtual Server running on Microsoft IIS SMTP server.
Web Server Navigator item
The workspace descriptions are organized by the Navigator item to which the workspaces are relevant. CGI and ISAPI Extension Request Statistics workspace
This workspace displays the request statistics for CGI/ISAPI extension requests made to the web service.
This workspace contains the following views: CGI/ISAPI Extension Request Statistics
Displays the information about the CGI / ISAPI Extension Requests attributes of web service.
CGI Request Rate
Displays the rate, in seconds, at which CGI requests are processed simultaneously by the web service.
ISAPI Request Rate
Displays the rate, in seconds, at which ISAPI extension requests are processed by the web service.
Data and File Transfer Statistics workspace
This workspace displays the data and file traffic statistics of web service. This workspace contains the following views:
Data and File Transfer Statistics
Data Transfer Rate
Displays the rate of data sent, received, and transferred by the web service in KB per second.
File Transfer Rate
Displays the rate of files sent and received by the web service per second. Error Statistics workspace
This workspace displays the error statistics of the web service. This workspace contains the following views:
Error and Request Statistics
Displays the information about the error related attributes of the web service. Page Not Found Error Rate
Displays the rate, in seconds, at which requests were not satisfied by the server because the requested document was not found.
Locked Error Rate
Displays the rate, in seconds, at which requests were not satisfied because the requested document was locked.
User Request Statistics workspace
This workspace displays the user request statistics of the web service. This workspace contains the following views:
User Request Statistics
Displays the information about user and request related attributes of the web service. Current Users Request
Displays the number of users who currently have anonymous and nonanonymous requests pending with the web service.
User Request Rate
Displays the rate, in seconds, at which users made anonymous and nonanonymous requests to the web service.
% Current Users
Displays the percentage of users who currently have anonymous and nonanonymous requests pending with the web service.
Web Server workspace
This workspace displays connection and logon attempts statistics of web service and status of each website hosted on Microsoft IIS.
This workspace contains the following views: Connection and Logon Attempt Statistics
Displays the attributes that provide information about connection and logon attempts of web service.
Web Sites
Displays status for websites running on Microsoft IIS web server. Current Connections
Displays the number of active connections made to the web service. Connection and Logon Attempts
Displays the rate, in seconds, at which logon and connections are attempted to the web service.
Website Certificate Details
Displays the details of the website certificate for each website hosted on Microsoft IIS. Web Server Cache Statistics workspace
This workspace displays the web server cache statistics. This workspace contains the following views:
Web Server Cache Statistics
Displays the information about the web server cache attributes. Current File Cache Memory Usage
Current File Cached
Displays the current number of files that are in the user-mode cache. Flushed Entries
Displays the file handles cached in user-mode that will be closed when all current transfers complete.
Website Dynamic IP and Domain Restrictions Statistics workspace
This workspace displays the settings for the dynamic IP and domain restrictions of each website. This workspace contains the following views:
Website Dynamic IP and Domain Restrictions Summary
Displays the attributes that provide information about the dynamic IP and domain restrictions that are applied on each website.
Website IP and Domain Restrictions Settings Summary
Displays the attributes that provide configuration information about the dynamic IP and domain restrictions that are applied on each website.
Website Dynamic IP Restrictions Settings Summary
Displays the attributes that provide configuration information about the dynamic IP restrictions that are applied on each website.
Worker Process Navigator item
The workspace descriptions are organized by the Navigator item to which the workspaces are relevant. WAS Application Pool Statistics workspace
This workspace displays the information related to the Windows Process Activation Service (WAS) for application pool of the IIS V7.5 and later.
This workspace contains the following views: WAS Application Pool Statistics
Displays the information related to the Windows Process Activation Service (WAS) for application pool of the IIS V7.5 and later.
Current Worker Processes
Displays the current number of worker processes that are running in application pool the IIS V7.5 and later.
WAS Worker Process Statistics workspace
This workspace displays the statistics of worker processes running on Microsoft IIS V7.x and later.
This workspace contains the following views: WAS Worker Process Statistics
Displays data about a specific worker process. Message Received Rate
Displays the rate of total number of messages received by the worker process from Web Admin service per second.
Health Ping Rate
Displays the rate of total number of health pings received by the process per second. Message Sent Rate
Displays the rate of total number of messages sent to Web Admin service by the worker process per second.
Worker Process workspace
This workspace displays the HTTP request processing related data for the worker processes on Microsoft IIS V7.x and later.
This workspace contains the following views: W3SVC Worker Process Statistics
Displays the HTTP request processing related data for the worker processes on Microsoft IIS V7.x and later.
HTTP Request Rate
Active Thread Count