Recognizing Typeset Documents
using Walsh Transformation
Attila Fazekas and Andr´as Hajdu
University of Debrecen, HungaryIn this paper we present an effective character recognition algorithm, which can be applied mainly to typeset docu-ments. Our aim was to compose a character recognition algorithm, which can be used to recognize simple typeset documents in a fast and reliable way. To get a good result by this algorithm the input text document should contain characters from the same character set with a small number of symbols. This condition does not mean a strong restriction as the documents in practice usually have this property. The main character recognition part of the algorithm is based on the Walsh transformation, which gives a verbose description about the image, like the symmetrical relations, placement of the foreground and background pixels, and so on. That is why we tried to apply it to recognize characters, and the algorithm proved to be fairly efficient and reliable for simple documents, since the feature vectors extracted by Walsh transformation can be well distinguished. Moreover, our method had very good results in tolerating different types of noise corruption.
Keywords: optical character recognition, Walsh trans-formation
1. Introduction
The history of character recognition analysed by the tools of digital image processing dates back to the 1950’s(O.D. TRIER et al(1996)). New
problems and challenges occurred in practical applications and several character recognition methods were developed to solve them. Most of these character recognition algorithms can be applied to typeset documents, and there exist procedures to process handwritten characters. Character recognition algorithms are based on different methods, according to the type of the text they are to be applied to. The first step one should take during a character recognition process is to select the most suitable method for the specific application.
A character recognition process usually includes the scanning step, preprocessing(binarization –
segmentation), feature extraction(
skeletoniza-tion – contour extracskeletoniza-tion), the actual
recogni-tion and classificarecogni-tion, sometimes postprocess-ing, and verification. For a comprehensive sur-vey on feature extraction methods, see O.D. TRIER et al(1996), where several algorithms
are presented and compared. A commonly used method produces thinning of the characters to obtain their skeletons so the recognition is based on some kind of skeleton analysis. An overview on character recognition algorithms, which are based on thinning, can be found in R.W. SMITH
(1987). Skeletonization is applied to replace the
original image with a smaller data structure and has the advantage of saving memory.
Algorithms for recognizing both typeset and handwritten characters can be based on projec-tion histograms, zoning or, as a more theoretical analysis, the recognition can be executed ac-cording to the Fourier descriptors O.D. TRIER et al(1996).
Recognition of handwritten characters is a more sophisticated problem than the recognition of machine – printed text. Nowadays, OCR pack-ages are able to recognize only neatly written text, but research is being done in order to en-able recognition of common handwritten docu-ments as well. One of these algorithms contains a thinning step and an additional stroke segmen-tation part is inserted to enable the algorithm to recognize Chinese characters K.W. GAN et al
(1991), J.Y. LIN at al(1995), H. OGAWA at al (1982). Recognition of the Arabic script is also
Our algorithm supports the recognition of only typeset and not handwritten documents. We fo-cused on segmentation, and classification and made some experiments to verify the reliability of our character recognition method. To clas-sify a character, usually a feature vector is com-posed and the actual recognition is achieved by searching for the closest prototype feature vec-tor. Dimension of the feature vector can vary from one application to another and we also have to choose a suitable metrics to measure the difference between two feature vectors. In our analyses we tried to find a method, which gen-erates easily separable feature vectors, that is, the prototype vectors have large distance from one to another. We found that the well-known Walsh transformation has this property, so that the feature vectors generated by Walsh transfor-mation can be separated more effectively than in the case of other popular character recognition methods like zoning or projection histograms. Using Walsh transformation with underdeter-mined feature vectors we also obtain a noise filtering effect, which is very useful in charac-ter recognition processes.
We skipped the feature extraction step, since the classification step of our algorithm is based on the Walsh transforms of the image, which can be calculated without any modifications.
2. Description of the Recognition System
Our algorithm was developed to be applied to text documents, which include characters from a character set with a small number (84) of
symbols. Recognizable characters are letters, numbers, separators, punctuation marks, and so on.
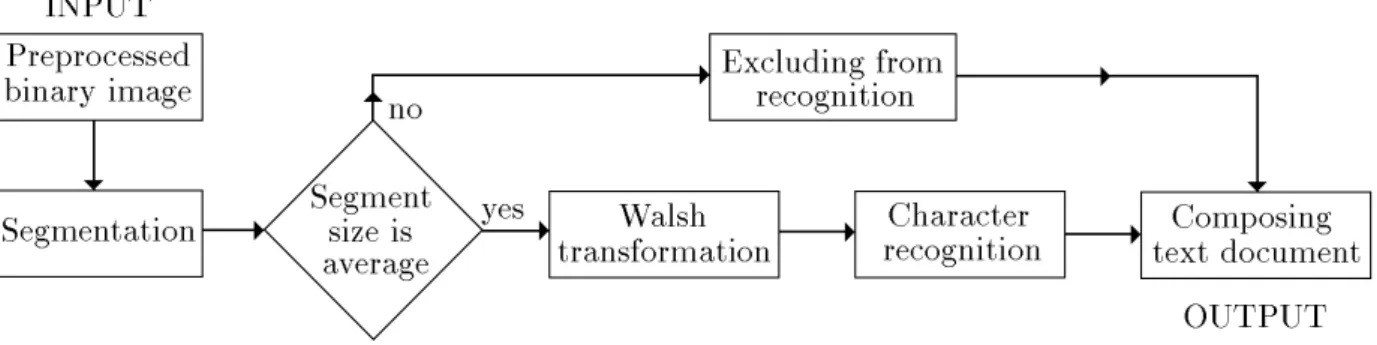
At the first step of the algorithm a segmenta-tion procedure divides the original binary image into smaller ones, and these smaller segments are stored in a chained list. These segments are actually rectangles, and beside the image infor-mation, the coordinates of the upper left pixel and the size of the rectangle are also stored for every segment. Detailed description of this seg-mentation algorithm can be found in Section 3. Our character recognition method is based on the Walsh transformation, which is described in Section 4. For every segment a 64-dimensional feature vector is composed according to the first 64 Walsh transforms of the segment.
After calculating the feature vector of a given segment, we judge whether the segment con-tains text information(letter, number, etc.), or
an unrecognizable symbol. Section 5 summa-rizes the way how the decision is made and the possibilities how the algorithm can be trained. The scheme in Figure 1 briefly describes how the algorithm operates.
We used a commonly applied character set to test our algorithm from several different points of view, like computation speed, noise sensiti-vity, recognition failure. We made other statis-tical investigations as well, such as correlation analysis. Our experimental results are summa-rized in Section 6.
Finally, Section 7 contains our conclusions and recommendations about the feasibility of the method.
3. Segmentation
The first step of the algorithm performs a seg-mentation procedure on the digital image. We try to determine minimal storing rectangles for those subsets of the image foreground, which can be separated by horizontal and vertical lines. These rectangles can be determined by calculat-ing their size and the coordinates of their upper left pixel. These storing rectangles are some-times referred to as segments. Using storing rectangles, our segmentation procedure does not extract the connected foreground components in the case of a ligature. This segmentation method is able to handle ligature appearances in the text, which depend on the character set applied. In the case of a ligature recognition is obviously unsuccessful, since the picture of the letters changes drastically, see Figure 3, where a ligature “fi” appears in the Hungarian word “fi-gyelo00”
(observer). Our algorithm is
precondi-tioned for this phenomenon, and can be trained to recognize ligatures. In our experiments we also used a CMR character set which allows ligatures besides the ligature-free sets OCR-A and OCR-B(which were composed for optical
character recognition).
Segmentation can be made parallel easily, and the whole procedure can be performed as an al-ternating recursive sequence of horizontal and vertical segmentation steps. Horizontal mentation steps are followed by vertical seg-mentation steps, and vice versa. Alternating horizontal and vertical segmentation steps, each of the existing segments is divided into smaller segments. If the number of segments does not change during a segmentation step, the algo-rithm stops. The following description explains briefly – in meta language format – how the segmentation procedure works:
Type SP=^Segment Segment=Record Of
X,Y:Word {*Upper left pixel coordinates*} LX,LY:Word {*Size of the segment*}
Code:Byte {*Code of the recognized character*} Picture:Pointer {*The address of the segment*}
Next:SP {*Next element of the chained list*} End
.. .
Function HSegmentation(Var Head:SP):Boolean {*True if a new segment is defined*} Var NewHead:SP {*New segment*}
Var SY,EY:Word {*Beginning and end of the segment*} Begin
SY:=NextEmptyLine EY:=NextEmptyLine
If (SY=Head^.Y) And (EY=Head^.Y+Head^.LY-1) Then
HSegmentation:=False {*Image cannot be segmented any more*} Exit
End
While (EY-SY<>1) Do Begin {*Ignoring pairs of empty lines*} SY:=EY
EY:=NextEmptyLine End
New(NewHead) {*Creating a new element in the list*}
CutPicture(Head,NewHead,SY,EY) {*Current segment is defined by SY,EY*} NewHead^.Next:=Head^.Next
Head^.Next:=NewHead Head:=NewHead
HSegmentation:=HSegmentation(Head) Or True {*Processing the image part remained*} End
Horizontal segmentation step: We have a pixel running from left to right, starting from the up-per left corner of every segment we have already extracted. If we find an object (foreground)
point in the given row, then we go down one pixel and start to run a pixel from the begin-ning of this row. The procedure continues till the running pixel reaches the right side of the segment(we find a row which does not contain
object points). In this case we obtain a new
segment. The top row of the new segment will be the uppermost row of the original segment, which contains an object point. The bottom row of the new segment will be the lowermost row of the original segment, which has been already processed and contains an object point. After defining the new segment, we go on with pro-cessing the original segment, starting from that row which did not contain any object points. Vertical segmentation step: Vertical segmenta-tion procedure is analogous to the horizontal one, but here the pixel runs from top to bottom, starting from the upper left corner of a segment. We go right one pixel till a column is found, which does not contain object points. In this case a new segment is defined.
In the first step of the segmentation procedure the whole original binary image is considered as the initial segment, and a horizontal segmen-tation step is performed. The segmensegmen-tation al-gorithm stops if during a horizontal or vertical segmentation step we cannot find a row or a col-umn, which does not contain an object point — in other words, new segments cannot be defined. The steps of the segmentation algorithm de-scribed above can be seen in the following fig-ure, where the segments are represented by rect-angles. If the original binary image is a text doc-ument, the result of the first(horizontal)step is
a line of text.
Fig. 3.The result of the segmentation after the second and fourth steps.
Notice that the top of the line is determined by the highest character(“f”), and the bottom
is determined by the lowest character (“g”).
The second(vertical)segmentation step divides
the text line into characters, but the rectangles that store the characters contain relatively large background components, which can be elimi-nated with the following(horizontal)
segmen-tation step. If the document contains some graphic parts, then the number of segmentation steps necessary to segment such a graphic part, depends on the complexity of the graphics.
Segmentation of the accented characters is an interesting and difficult problem. In the case of an English text, after three segmentation steps
(horizontal – vertical – horizontal)the storing
rectangles cannot be reduced any more, while in the case of a Hungarian text which contains accented characters, we have the same situation only after the fourth segmentation step. Figure 3 illustrates this case as well, where segmen-tation of the Hungarian accented character “o00”
is performed in four steps. Recognition of ac-cented characters is rather difficult way, since the accent is segmented separately. Analyzing the position of the segments of small size can help to recognize these characters. For example, it can be useful to examine if a vowel takes place below a segment of small size. Our system was not trained to recognize accented characters in our analysis.
The input image(a text document)can be
dis-torted in several ways: rotated, corrupted by noise, etc. The image may be rotated if e.g. the document was inserted into the scanner in an improper way. Our method tolerates rotation of small degrees. If the rotation degree is too large, horizontal segmentation is not able to sep-arate the document lines in the first step, since the lowest pixel of a line is “under” the high-est pixel of the next line. The highhigh-est rotation degree that may be tolerated can be obtained as
α =arc tan
line-space
paper width;horizontal margins :
(3.1)
4. Character Recognition
According to the average size of the stored binary images in the chained list, we can de-cide whether an element stores text information
(character)or something else, a graphic or noise
corruption, for example.
4.1. The Walsh Transformation
We use the Walsh transformation in our charac-ter recognition process. Walsh transformation was applied in several cases for several pur-poses, but never to character recognition. We found that this transformation gives a verbose description of the image, like symmetrical re-lations, placement of the foreground and back-ground pixels, and so on. That is why we tried to apply it for character recognition, and finally ac-complished good results for simple documents. The Walsh transformationW(uv)is a separable
and symmetric transformation with the follow-ing form in 2D:
W(uv)=
N;1 X
x=0
N;1 X
y=0
f(xy)g(xyuv) (4.1)
where f(xy)is intensity of the pixel with the
coordinates (xy) in the original binary
im-age. The size of the image f is N N and
uv = 0 ::: N ; 1, thus we compute N
2 Walsh transforms altogether, which can be or-ganized into anN2dimensional feature vector:
(W(00) W(01) W(02) :::
W(0N;1) W(10) W(11) :::
W(N;1N;1)):
Function g is the kernel function of the trans-formation and has the following form:
g(xyuv)=
=
1
N
n;1 Y
i=0 (;1)
bi(x)bn ;i;1
(u)+bi(y)bn ;i;1
(v)
(4.2)
wherebi(x)is theith bit in the binary expansion
ofx (so it is equal either 0 or 1), and N = 2
n.
The Walsh transform is unique in the sense that if we consider two different binary images, the corresponding feature vectors are also different.
If we compose a feature vector which does not contain all the Walsh transform values, then this vector can be the same for two different origi-nal binary images, see Section 4.2. The Walsh transformation is separable, as its kernel func-tion can be separated:
g(xyuv)=g1(xu)g2(yv): (4.3)
Moreover, the equality
g(xyuv)=g1(xu)g1(yv) (4.4)
also holds (the factors are functionally
equiv-alent), thus the Walsh transformation is
sym-metric as well. With these two properties the computation of the 2D transforms can be made considerably faster, since it can be simplified to the computation of two 1D Walsh transforma-tions, and the symmetry makes the computation even faster. All these properties of the Walsh transformation are well-known from literature, see R.C. GONZALEZ (1992). Our purpose
was to collect those features, which have an im-portant role in our algorithm.
4.2. Application of the Walsh Transforma-tion
To perform the Walsh transformation, first we have to magnify the original image to the size of 2n
2
n for some n. This does not mean
a considerable modification, since the Walsh transformation is invariant under magnification. The image size was fixed at 3232 and we used
linear transformation to magnify the segments. However, we computed only the following 64 Walsh transforms instead of the 3232=1024
ones:
(W(00) W(01) W(02) ::: W(07)
W(10) W(11) ::: W(77)):
There are three reasons for reducing the number of the Walsh transforms:
We can save computation time;
These 64 values describe global features
and symmetric relations of the binary image well;
We can filter out some noise corruption from
Fig. 4. Different images with the same feature vector.
An example of the latter property can be seen in Figure 4, where the Walsh transformsW(00),
W(01),W(02),W(03),W(10),W(11),:::,
W(33)are equal for the two original 88
bi-nary images.
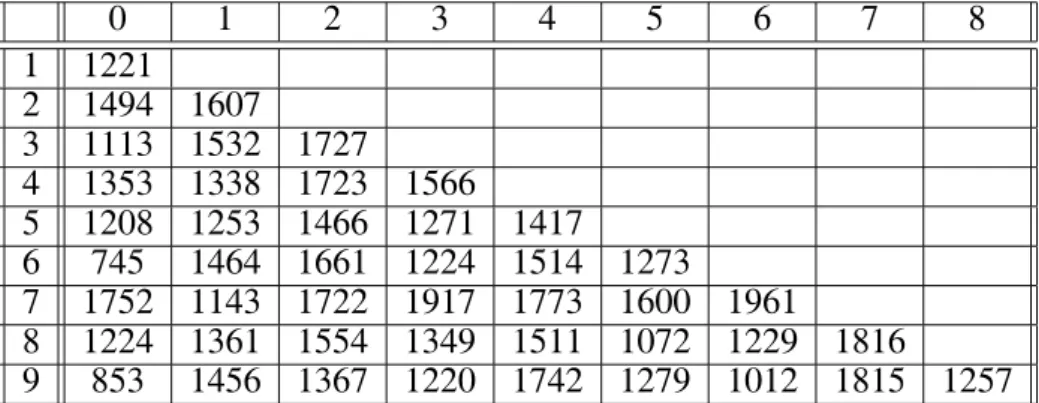
The difference (distance) of the 64D feature
vectors of different characters is significant, so the recognition of a given character is quite reli-able. To prove this statement check the follow-ing table, which illustrates Cartesian distance values between the feature vectors of prototype digits. The values show significant differences, which supports our conception to calculate only a 64 dimensional feature vector for each char-acter.
Magnifying the segments to the same size(32
32) can cause a problem in character
recogni-tion. Though the lower and upper cases of the characters usually look different, some charac-ters have similar lower and upper cases (e.g.
“w” and “W”), which become identical during
magnification. We can avoid this problem by storing the ratio of the side lengths of the storing rectangle for every segment. The proper case can be restored by comparing the ratio of the side lengths of the original storing rectangle. In the previous section we described how the 2D
Walsh transformation can be performed as two 1D transformations. In our algorithm we used a faster method and computed the transforms directly from the tables. The value
N g(xyuv)=
n;1 Y
i=0 (;1)
bi(x)bn ;i;1
(u)+bi(y)bn ;i;1
(v)
(4.5)
in the kernel function can be1. For example,
let us consider the casen=1,N =2
1
=2. The
corresponding table traditionally has the form
(0,0) (0,1) (1,0) (1,1)
(00) + + + + (01) + ; + ; (10) + + ; ; (11) + ; ; +
Table 2.The kernel function values of the Walsh transformation for a 2 2 image.
where the cells of the table contain+or;signs
according to the value of(4.5).
0 1 2 3 4 5 6 7 8
1 1221
2 1494 1607
3 1113 1532 1727
4 1353 1338 1723 1566
5 1208 1253 1466 1271 1417
6 745 1464 1661 1224 1514 1273
7 1752 1143 1722 1917 1773 1600 1961
8 1224 1361 1554 1349 1511 1072 1229 1816
9 853 1456 1367 1220 1742 1279 1012 1815 1257
4.3. Comparing Feature Vectors Against Other Algorithms
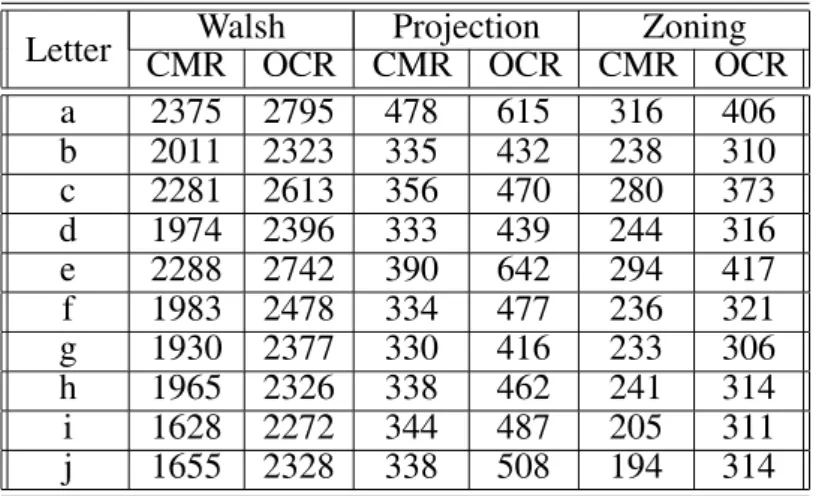
Our algorithm was compared by two classic character recognition method: one of them is based on projection histograms, the other one is based on zoning. The reason why we in-volved these character recognition algorithms into our analysis is that both of them use fea-ture vectors to classify recognizable characters and assign a 64D feature vector to every re-cognizable segment, similarly to our algorithm. We involved different font types to our analyses
(OCR-A, OCR-B, CMR). By fixing a prototype
alphabet(letters, digits, punctuation marks, and
other symbols), first we computed the average
distance values for every symbol from the rest of the alphabet. Table 3 contains our results according to the different character recognition algorithms. Only the first 10 lower case letters of the alphabet are presented here.
The entries indicate more significant difference values in the case of Walsh transformation, which results in better recognition performance. A detailed description and results of the tests we performed to check the recognition accuracy of our method are presented in Section 6.
4.4. Character Recognition — Feature and Prototype Vectors
As described in the previous section, we obtain a 64 dimensional feature vector by computing some of the Walsh transforms for an element of the chained list. This feature vector is compared
with prototype vectors containing the same 64 Walsh transforms of prototype characters. For a given feature vector we find the closest proto-type vector by using a suitable distance function
(for example the Cartesian one). If we assume
that the size of the character segments lie in an interval, we can exclude the segments of too small (noise) or too large size (graphic parts)
from the recognition process before the deci-sion step. Recognition is based on the distance between the feature vector of the analysed char-acter and the prototype vector.
5. Decision and Training
As we mentioned before, the document we are about to process should contain only the text and some special symbols. For this kind of documents the algorithm works in a fairly reli-able way. To make the algorithm more flexible, we inserted a decision step into the recognition process to handle unrecognizable segments. We have the following two possibilities to make a decision about the recognizability of a segment. 2-level decision: With this step, the given seg-ment is always recognized, which means that the algorithm finds the prototype character whose feature vector has the minimal distance from the feature vector of the given segment. 3-level decision: With this step we classify the segments as recognizable or uncertain ones. In uncertain cases the algorithm has “doubts” about the recognizability of the given segments.
Walsh Projection Zoning
Letter CMR OCR CMR OCR CMR OCR
a 2375 2795 478 615 316 406
b 2011 2323 335 432 238 310
c 2281 2613 356 470 280 373
d 1974 2396 333 439 244 316
e 2288 2742 390 642 294 417
f 1983 2478 334 477 236 321
g 1930 2377 330 416 233 306
h 1965 2326 338 462 241 314
i 1628 2272 344 487 205 311
j 1655 2328 338 508 194 314
This happens when the minimal distance is larger than the threshold value.
During character recognition we create a 64D feature vector for every segment, then calculate the minimal distance between this vector and the prototype vectors. The decision steps above are based on this distance value. In the 3-level decision step we use one critical value. The de-cision can be made according to the relation of the minimal distance value against the critical value. In the 3-level case, if the minimal dis-tance value is larger than the critical value, the segment is considered unrecognizable.
Critical values can be given in different ways. For example, in our experiments we used13the
minimal distance between any two of the proto-type vectors as the critical value for the 3-level decision. Another possibility is to give the crit-ical value for each prototype vector separately. There is a training part inserted into the algo-rithm, which is independent of the recognition step. Adaptive recognition would be question-able, since false recognition of a given character would ruin the corresponding prototype vector. If we wish to apply the algorithm to a document using an unknown font type, first we have to train our process to recognize the new symbols. To do this, we have two possibilities. If we have the font in electronic form, we can eas-ily compose an artificial document containing the whole alphabet without any noise. Scan-ning through this document we can train the algorithm for every symbol of the alphabet. If we cannot compose such an artificial document
(e.g. we do not have the font type in electronic
form), then the algorithm must be trained by
using 3 to 10 samples for every symbol from the scanned material.
6. Experimental Results
We calculated average computation times the algorithm took to process one page of printed text, which contained 27 rows. It took 4.9 sec-onds to segment the document and additional 5 seconds to perform the recognition step. The test was executed on a Personal Computer at a moderate performance level(Pentium 233
pro-cessor). The segmentation step of the algorithm
takes approximately the same time to finish as
the actual recognition step. Performance of the algorithm can be improved by making the pro-cedure parallel. As we investigated other fea-tures, we did not implement parallel segmen-tation and character recognition, which would drastically reduce the computation time. In the case of parallel processing, segmentation of the whole document and the segmentation of one character would take approximately the same time, and the same holds for character recogni-tion, too. It means that the computation time the whole process takes, would reduce to 0.1 from 9.5 seconds.
We experimentally tested the reliability of our character recognition algorithm. To perform a comparative analysis, we did the same test for our recognition algorithm, and the meth-ods based on projection histograms, and zoning. Synthetic images were generated with the char-acter sets CMR, OCR-A, OCR-B, which con-tained the most regular elements of these sets – approximately 85 different symbols. These prototype documents were used to train the al-gorithms, so the prototype feature vectors were calculated. In the case of the CMR character set we also involved ligatures into our analysis. We composed some (4) one page test
docu-ments containing regular text and calculated an average accuracy value to measure the recogni-tion efficiency of the algorithms. Using these samples, we made an analysis according to the recognition accuracy of our method for each symbol of the alphabet. The result of this test can be found in Appendix A.
We inserted a noise generator step into the char-acter recognition process after the segmenta-tion. This way we corrupted the image with different noise types(global, contour)at
Global noise Contour noise Failure 20% 25% 30% 35% 30% 40% 50% 60%
i!I 1% 5% 28% 37% 2% 16%
l!1 2% 3% 5% 5% 2% 2% 13% 4%
l!I 6% 17% 23% 18% 47% 82%
1!l 2% 6% 8% 1%
1!I 2% 4% 2% 4% 28% 38%
6!0 3% 6% 2%
t!l 1% 8% 1% 1%
Table 4.Recognition failures according to different types of noise corruption.
on actually scanned printed material, which is equivalent to a small(1%)global and a
moder-ate(20%)contour noise corruption. For every
input document we generated 100 noisy images with each of the noise types specified in the ta-ble. Appendix B summarizes the types of noise corruption we applied, and the recognition ac-curacy of the investigated algorithms. The – signs in the table indicates those cases, when the recognition accuracy fell drastically.
For every image we calculated its feature vector in the way explained in Section 4. Our analysis indicated strong correlation among the levels of the noise corruption, the feature vector of the image, and its distance from the corresponding prototype vector. The correlation coefficient
r =0:7875 at the significance level 0:001.
The following table summarizes the type and the frequency of some typical recognition failures that occurred according to the different types of noise corruption. We applied a 2-level decision during the recognition.
If the recognition is restricted only to digits, then the dimension of the feature space can be reduced. According to a factor analysis the di-mension of the feature space can be reduced from 64 to 48 without ruining the accuracy of the recognition. We can have a moderate recog-nition accuracy(at the level of 90%)if we use
only a 16-dimensional feature space.
7. Conclusion — Application in Practice
Our character recognition algorithm should be applied to typeset text documents which con-tain characters from a character set with a small number of symbols. The characters can be
magnified as the algorithm is invariant under magnification. For documents of this type, our algorithm produces a reliable result in an ef-fective and fast way. Experimental analysis in-dicated that the algorithm tolerates noise cor-ruption quite well. The noise sensitivity of the method can be reduced further by a lexical ana-lysis. The recognition speed can be improved by reducing the applied character set. In that case, when the character set contains a large number of symbols, the algorithm should be used for classification instead of recognition.
As a practical application we built in our char-acter recognition method into an information loss compressive algorithm. During the com-pression our main purpose is to preserve the visual information about the document, which is most important for a human reviewer, see A. FAZEKAS et al(1999).
APPENDIX A
Recognition accuracy and failures for symbols of theCMRalphabet at 40% global and contour noise
Rate Failure Rate Failure Rate Failure
a 98% @ H A 100% ? 100%
b 99% h B 100% ! 63% l
c 95% e 0 6 E C 86% 0 6 c n 55% I 1
d 100% D 100% # 100%
e 100% E 100% & 100%
f 100% F 100% 17%
-g 100% G 100% f 57% I
h 100% H 100% g 61% I )
i 54% I I 100% 0 100%
j 51% I g ] J 100% 1 96% I
k 98% h K 100% 2 100%
l 36% I 1 L 100% 3 100%
m 100% M 100% 4 100%
n 96% u N 100% 5 100%
o 95% . O O 100% 6 95% 0
p 100% P 100% 7 93% I 1
q 97% H Q 98% 0 8 100%
r 99% 1 R 99% H 9 100%
s 83% H S 8 S 98% 8 + 99% ;
t 81% 1 I l ( T 100% % 100%
u 99% 0 U 100% / 73% I 1
v 90% V M V 98% v = 63%
-w 100% W 50% w ( 51% I 1 l t
x 99% n X 100% ) 48% I g ] l
y 99% I Y 100% - 100%
z 98% E Z Z 100% . 84% =
, 54% I ! 1 l ;
: 42% I 1
; 67% I i l f
@ 100%
66% l
APPENDIX B
Recognition accuracy according to different types and levels of noise corruption
Noise level Walsh Projection Zoning
Global Contour CMR OCR CMR OCR CMR OCR
5% 0% 100% 100% 100% 100% 100% 100%
10% 0% 100% 100% 99.95% 99.69% 99.96% 100%
15% 0% 99.94% 100% 87.02% 94.65% 99.33% 100%
20% 0% 99.69% 100% 70.46% 80.94% 95.60% 100%
25% 0% 99.15% 100% 57.80% 65.60% 89.89% 99.80%
30% 0% 97.27% 99.95% – – 82.06% 98.49%
35% 0% 94.85% 99.91% – – 72.48% 95.66%
40% 0% 90.58% 99.55% – – 59.12% 90.51%
45% 0% 84.10% 98.12% – – – 78.32%
50% 0% 75.08% 94.08% – – – –
55% 0% – 86.39% – – – –
60% 0% – 72.22% – – – –
0% 20% 100% 100% 100% 100% 100% 100%
0% 25% 99.93% 100% 99.99% 100% 99.99% 100%
0% 30% 99.86% 100% 99.93% 100% 99.86% 100%
0% 35% 99.63% 100% 99.37% 100% 99.51% 100%
0% 40% 99.14% 100% 96.08% 99.88% 98.11% 100%
0% 45% 98.26% 100% 89.33% 98.94% 96.43% 100%
0% 50% 96.96% 100% 78.93% 95.80% 94.17% 99.95%
0% 55% 95.39% 99.84% – 85.64% 90.82% 99.80%
0% 60% 93.36% 99.32% – 69.04% 84.19% 98.34%
0% 65% 88.92% 97.40% – – 72.60% 93.04%
0% 70% 80.63% 91.26% – – – 78.71%
0% 75% 64.67% 77.60% – – – 55.94%
5% 5% 100% 100% 99.96% 100% 100% 100%
10% 10% 99.96% 100% 96.58% 99.31% 99.77% 100%
15% 15% 99.75% 100% 76.70% 90.51% 97.10% 100%
20% 20% 99.58% 100% – 73.54% 91.31% 100%
25% 25% 98.45% 100% – 55.89% 81.52% 99.68%
30% 30% 96.45% 99.98% – – 70.48% 97.34%
35% 35% 93.65% 99.89% – – – 91.65%
40% 40% 88.54% 99.04% – – – 79.20%
45% 45% 79.95% 94.48% – – – 56.54%
50% 50% – 83.26% – – – –
References
1] A. FAZEKAS, A. HAJDU, An algorithm using Walsh transformation for compressing typeset documents,
Acta Mathematica Academiae Paedagogicae Nyir-egyh´aziensis,15(1999), 61–68.
2] K. W. GAN, K. T. LUA, A new approach to stroke and feature point extraction in Chinese character recognition,Pattern Recognition Letters,12(1991), 381–387.
3] R. C. GONZALEZ, R. E. WOODS,Digital Image
Pro-cessing, Addison-Wesley, Reading, MA, 1992. 4] J. Y. LIN, Z. CHEN, A Chinese-character thinning
algorithm based on global features and contour information,Pattern Recognition,28(1995), 493– 512.
5] S. A. MAHMOUD, I. ABUHAIBA, R. J. GREEN, Skele-tonization of arabic characters using clustering based skeletonization algorithm (CBSA), Pattern
Recognition,24(1991), 453–464.
6] H. OGAWA, K. TANIGUCHI, Thinning and stroke seg-mentation for handwritten Chinese character recog-nition,Pattern Recognition,15(1982), 299–308. 7] R. W. SMITH, Computer processing of line images
— A survey,Pattern Recognition,20(1987), 7–15. 8] O. D. TRIER, A. K. JAIN, T. TAXT, Feature extrac-tion methods for character recogniextrac-tion – A survey,
Pattern Recognition Letters,29(1996), 641–662.
Received:November, 1999
Revised:April, 2001
Accepted:April, 2001
Contact address:
Attila Fazekas and Andr´as Hajdu University of Debrecen 4010, Debrecen PO Box 12, Hungary
ATTILAFAZEKASreceived his M. Sc. degree in mathematics from the Lajos Kossuth University, Debrecen, Hungary, in 1992 and Ph. D. de-gree in digital image processing from the Lajos Kossuth University, Debrecen, Hungary, in 1999.
He is currently a lecturer at the University of Debrecen, Institute of Mathematics and Informatics. His current research interests include digital topology, mathematical morphology, human-computer interac-tion, support vectormachine.
Dr. Fazekas was elected to the Steering Committee of the Hungarian Association for Image Analysis and Pattern Recognition in 1998.
ANDRAS´ HAJDUreceived his M. Sc. degree in mathematics from the Lajos Kossuth University, Debrecen, Hungary, in 1996.