*Correspondence to Author:
F. A. Al-fuhaidy
Department of Electrical, Faculty of Engineering and Architecture, Ibb University, Ibb, Yemen
How to cite this article:
K. M. Al-soufy, F. S. Al-kamali and F. A. Al-fuhaidy. Performance Eval-uation of SC-FDMA Systems Using Wireless Images. American Journal of Computer Sciences and Applica-tions, 2017; 1:11.
eSciPub LLC, Houston, TX USA. Website: http://escipub.com/
K. M. Al-soufy et al., AJCSA, 2017; 1:11
American Journal of Computer Sciences and Applications
(ISSN:2575-775X)
Research Article AJCSA (2017) 1:11
Performance Evaluation of SC-FDMA Systems Using Wireless
Images
Recently, single crarrier frequency division multiple access (SC-FDMA) has drawn great attention in wireless communica-tions due to its low peak-to-average power ratio and low sensitiv-ity to carrier frequency offsets. The aim of this paper is to inves -tigate and test the wireless image transmission over SC-FDMA with consideration of different basis functions, different modula -tion schemes and different subcarriers mapping schemes. Sev -eral experiments are carried out and the obtained results show that the wireless images transmission over SC-FDMA systems is possible efficiently. Simulation results also show that the inter -leaved systems significantly improve the clarity of the received image and their performances are better than that of the local-ized systems irrespective of the wireless channel or the modula-tion scheme used. Moreover, the results show that the discrete cosine transform (DCT)-based SC-FDMA (DCT-SC-FDMA) and discrete sine transform (DST)-based SC-FDMA (DST-SC-FDMA) system achieve better performance than the conventional dis-crete Fourier transform (DFT)-based SC-FDMA (DFT-SC-FDMA) system in terms of Mean Square Error (MSE) and Peak Signal-to-Noise Ratio (PSNR) values.
Keywords: Image transmission, DFT-SC-FDMA, DCT-SC-FD-MA, DST-SC-FDDCT-SC-FD-MA, QPSK and 16QAM.
K. M. Al-soufy, F. S. Al-kamali and F. A. Al-fuhaidy
Department of Electrical, Faculty of Engineering and Architecture, Ibb University, Ibb, Yemen
Introduction
The rapidly increasing requirements for multimedia wireless communications are growing today and at the future steadily. Many of current wireless standards adopt a multicarrier air interface based on orthogonal frequency division multiple access (OFDMA) and SC-FDMA for high-rate multimedia transmission. Both techniques are modified form of the orthogonal frequency division multiplexing (OFDM) and single carrier frequency division equalization techniques respectively [1, 2].
However, OFDMA has some inherent
disadvantages such as the high Peak-to-average power ratio (PAPR) and the sensitivity to carrier frequency offsets [3, 4]. To solve these problems, much attention has been directed recently to SC-FDMA [4, 5]. SC-FDMA inherently provides similar advantages of OFDMA such as throughput performance and robust resistance to multipath. In addition, it has lower PAPR than OFDMA. Because of these
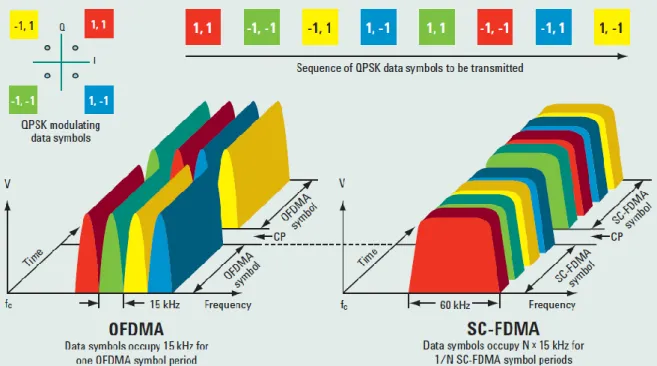
advantages, SC-FDMA recently has been recommended to use in the uplink multiple access scheme in the long term evolution (LTE) of cellular systems under consideration by the third generation partnership project (3GPP) [3-5]. The transmitters in an SC-FDMA system use different orthogonal frequencies (subcarriers) to transmit information symbols as in OFDMA. However, all the subcarriers are transmitted in series in contrast to the parallel transmission of subcarriers in OFDMA as shown in Fig. (1). Thus only one subcarrier is present at any particular time and hence it gives lower PAPR characteristics.
There are two different schemes of subcarriers mapping modes in SC-FDMA systems [5-7]. The first mode is the localized SC-FDMA (LFDMA) in which the scheduler assigns consecutive subcarriers to convey information from a particular user. The second mode is interleaved SC-FDMA (IFDMA) in which the users are assigned distributed subcarriers over the entire frequency band.
Figure 1: OFDMA and SC-FDMA systems.
Due to remarkable internet growth, image transmission has emerged as one of the high growth applications of wireless communication technology. Performance comparison of image
and SC-FDMA systems is investigated over a frequency selective channel for different modulation and subcarriers mapping schemes. The performance of DCT-SC-FDMA system using continuous phase modulation was examined with image transmission in [10]. Images transmission over OFDMA systems has been investigated and evaluated for different wireless channel in [11]. An efficient wireless transmission scheme based on the DST-based multicarrier code division multiple access system has been studied in [12]. Image transmission over a space-time coded OFDM system was suggested and discussed in [13].
In this paper, the issue of image transmission over DFT-SC-FDMA, DCT-SC-FDMA and DST-SC-FDMA systems is investigated and evaluated with consideration of different modulation schemes and different subcarriers mapping schemes. The peak-signal-to-noise-ratio (PSNR) and the mean square error (MSE) performances of the received image over the mentioned systems are studied, compared and investigated for different modulation and subcarriers mapping schemes.
The remaining part of the paper is organized as follows: Section II presents the basis functions. Section III describes the SC-FDMA systems models. Section IV discusses simulations results. Section V concludes the paper.
Basis Functions
The transform operation is mathematical operation that is applied to a given signal to convert it from one domain into another domain and vice versa. It is desired to convert the input signal from discrete-time data representation into a discrete-frequency representation and vice and versa. Thus once the signal is converted into frequency domain, it will have various components that can be used to remove specific unwanted frequency components. The most popular transform
systems related to signal processing are DFT, DST, and DST.
A. The Discrete Fourier Transform.
The DFT is one of the most important tools that is widely used in digital signal processing and related fields. The forward Fourier transform is defined as the integral:
𝑋(𝑓) = ∫−∞∞ 𝑥(𝑡)𝑒−𝑗2𝜋𝐹𝑡𝑑𝑡 (1)
The DFT takes N samples in the time-domain
and transforms them into N
values X(k) in the frequency-domain. It means that DFT operates at a finite number of discrete data points. Thus eq. (1) becomes: 𝑋(𝑘) =
∑ 𝑥(𝑛). 𝑒𝑗𝜋𝑘𝑛𝑁 , 𝑘 = 0,1, … , 𝑁 − 1 𝑁−1
𝑛=0
(2)
By using Euler's formula than eq. (2) can be rewritten as:
𝑋(𝑘) = ∑ 𝑥(𝑛). (cos2𝜋𝑛𝑘
𝑁 − 𝑗 sin 2𝜋𝑛𝑘
𝑁 ) 𝑁−1
𝑛=0
(3)
It is clear that DFT takes two parts, real part and imaginary part.
B. The Discrete Cosine Transform
DCT is similar to DFT except in the fact that it exploits only the real part of DFT. It expresses the samples of the input signal as the sum of cosinusoidal functions oscillating at different frequencies. There are four types of DCT. However, the type-II DCT is the most commonly used and often called simply the DCT. DCT is given by [14]:
𝑋(𝑘) = √2
𝑁𝛽(𝑘) ∑ 𝑥(𝑘) (cos
𝜋𝑘(2𝑛+1)
2𝑁 ) , 𝑘 = 𝑁−1
𝑛=0
0,1, … . . , 𝑁 − 1 (4) Where X(k) is the nth sample of the input signal.
𝛽(𝑘) can be given as what follows [14]:
𝛽(𝑘) = {
1
√2, 𝑘 = 0
1 , 𝑘 = 0,1, … , 𝑁 − 1 (5)
Like any Fourier-related transform, DST expresses the input signal in terms of a sum of sinusoids with different frequencies and amplitudes. However, it uses only real functions instead of the complex functions used in the conventional DFT. There are many types of DST and DST-I type is considered in this paper. DST can be expressed by [15]:
𝑦(𝑘) = ∑ 𝑋(𝑛) sin (𝜋𝑘𝑛
𝑁+1) , 𝑘 = 1,2, … … , 𝑁 𝑁
𝑛=1
(6)
SC-FDMA SYSTEMS MODELS
A. DFT-SC-FDMA System
The block diagram of the DFT-SC-FDMA system is shown in Fig. 2. One base station and U uplink users are assumed. At the transmitter side, the encoded data is transformed into a multilevel sequence of complex numbers in one of several possible modulation formats. The resulting modulated symbols are grouped into blocks, each
containing N symbols and the DFT is performed. Then, the data symbols are mapped, using the interleaved or the localized subcarriers mapping technique. After that, an
M-point inverse discrete Fourier transform (IDFT) is performed and a cyclic prefix (CP) is added to the resulting signal. The transmitted signal from the uth user can be formulated as follows:
u N u T M add u
d F M F P
x 1 (7)
where is duan N×1 vector containing the modulated symbols of the uth (u=1,2,…., U)
user. FN is the N×N DFT matrix. MuT is an
M×N (M =Q.N) subcarriers mapping matrix of the uth user. Q is the bandwidth expansion factor of the symbol sequence. For perfect time and frequency synchronization, if all terminals transmit N symbols per block, the system can handle Q simultaneous transmissions without
interference. FM1 is the M×M IDFT matrix. Padd
is an (M +NC) × M matrix, which adds the CP.
Figure 2: Structure of the uplink DFT-SC-FDMA system. Transmitter of the user u.
Receiver of the user u
Modulation
N-points
DFT
Subcarriers
Mapping
M
-points IDFT
Add CP
FDE
M
-points DFT
Remove
CP Subcarriers
Mapping N-points
IDFT
Demodulation
Receiver.
u
Channel
Encoder Source
At the receiver side, assuming perfect time and frequency synchronization, the received signal at the base station can be written as follows:
n x H
r
u U u u 1 (8)
where
H
u is an (M+NC) × (M+NC) matrix describing the channel of the uth user. n is an (M+NC) × 1 vector containing the noise. After the removal of the CP, the received signal becomes:n x H
r
u u C U u ~ 1 (9)
where n is the noise after the CP removal. u N u T M u d F M F x 1
~ . u
C
H is an M × M circulant matrix describing the channel of the uth user.
After that, the received signal is transformed into the frequency domain via an M-points DFT as follows:
N X Λ
R
u u U u 1 (10)
where u
M u
x F
X ~ is an M × 1 vector
representing the transmitted samples from the
uth user after the mapping process. N is the DFT of n. Finally, the demapping, the
equalization, the IDFT, the demodulation and the decoding processes take place.
B. DCT-SC-FDMA System
The structure of the DCT-SC--FDMA system is shown in Fig. 3. At the transmitter part, which is the mobile unit, the structure of the DCT-SC-FDMA is similar to that of the DFT-SC-DCT-SC-FDMA except the IDFT and the DFT blocks are replaced by the IDCT and the DCT blocks, respectively. At the receiver part, which is the base station, the structure of the DCT-SC-FDMA still uses the DFT and the IDFT for the one-tap frequency domain equalizer in addition to the DCT and IDCT blocks. On the other hand, the receiver complexity of the DCT-SC-FDMA system is slightly higher than that of the DFT-SC-FDMA system. However, the increase
in the receiver complexity in the uplink is tolerable considering the advantages of the DCT-SC-FDMA system.
C. DST-SC-FDMA System
The structure of the DST-SC-FDMA system is similar to that of the DCT-SC-FDMA system in previous subsection. The difference is that the DCT and the IDCT blocks at the transmitter and receiver are replaced by the DST and the IDST blocks, respectively.
In this paper, the interleaved DFT-SC-FDMA is denoted by DFT-IFDMA, the localized DFT- SC-FDMA is denoted by DFT-LFDMA, the interleaved SC-FDMA is denoted by DCT-IFDMA, the localized DCT-SC-FDMA is denoted by DCT-LFDMA, the interleaved DST-SC-FDMA is denoted by DST-IFDMA, and the localized SC-FDMA is denoted by DST-LFDMA.
I. Simulation Results
In this section, PSNR and MSE metrics have been used to measure the quality of the transmitted Cameraman image over SC-FDMA system with different basis functions, different subcarriers mapping schemes and different modulation schemes by using MATLAB simulator. PSNR is defined as the ratio between the maximum possible power of a signal and the power of the corrupting noise that affects the fidelity of this signal. It can be given by the following formula
𝑃𝑆𝑁𝑅 = 10 𝑙𝑜𝑔 ( 𝑓𝑚𝑎𝑥
2
𝑀𝑆𝐸2) ( 11)
Where 𝑓𝑚𝑎𝑥 is the maximum pixel value in the image. The MSE is defined as follows:
𝑀𝑆𝐸 =∑ ∑ (𝐼𝑜(𝑖, 𝑗) − 𝐼𝑟(𝑖, 𝑗))
2 𝑀
𝑗=1 𝑀 𝑖=1
𝑀2 ( 12)
Figure 2: Structure of the uplink DFT-SC-FDMA system.
The extensive simulation parameters are shown in Table 1. A convolutional code with memory length seven and octal generator
polynomials (133,171) is chosen as the channel coding. The transmitted Cameraman image for all users of size 256 × 256 is shown in Fig. 4.
Table 1: Simulation Parameters.
Parameter Specification
Simulation method Monte Carlo
Total number of subcarriers M= 256
Number of users U= 4
Modulation type QPSK and 16QAM
Channel model vehicular A channel
Channel coding Convolutional code with rate ½
Subcarriers mapping mode Interleaved and Localized
Cyclic prefix length 20 samples
Channel estimation Perfect
System bandwidth 5MHz
Equalization MMSE
Source
Transmitter of the user u.
Receiver of the user u Modulation
N-points
DCT
Subcarriers Mapping
M-points IDCT
Add CP
M-points
IDFT FDE
M-points
DFT
Remove CP M-poits
DCT
Subcarriers Demapping
N-points
IDCT
Demodulation
Receiver.
u
Channel
Encoder
A.
PSNR Performance:As mentioned, the first parameter that is used for performance evaluation is PSNR. For this purpose, Cameraman image has been transmitted over the coded SC-FDMA systems. DFT, DCT and DST are used with different subcarriers mapping schemes and different
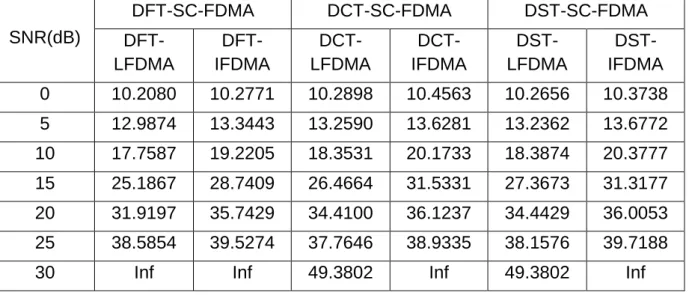
modulation schemes. PSNR values of the received image are calculated for different SNR values from 0 through 35 dB with 5 dB steps. The obtained values of PSNR are tabulated in Table 2 and 3 for QPSK and16QAM modulation schemes and plotted in Figs. 5 and 6, respectively.
Table 2: PSNR values of the received Cameraman image over the DFT-SC-FDMA, the DCT-SC-FDMA and the DST-SC-FDMA systems when QPSK is
used
SNR(dB)
DFT-SC-FDMA DCT-SC-FDMA DST-SC-FDMA
DFT-LFDMA
DFT-IFDMA
DCT-LFDMA
DCT-IFDMA
DST-LFDMA
DST-IFDMA
0 10.2080 10.2771 10.2898 10.4563 10.2656 10.3738
5 12.9874 13.3443 13.2590 13.6281 13.2362 13.6772
10 17.7587 19.2205 18.3531 20.1733 18.3874 20.3777
15 25.1867 28.7409 26.4664 31.5331 27.3673 31.3177
20 31.9197 35.7429 34.4100 36.1237 34.4429 36.0053
25 38.5854 39.5274 37.7646 38.9335 38.1576 39.7188
30 Inf Inf 49.3802 Inf 49.3802 Inf
Table 3: PSNR values of the received Cameraman image over the
DFT-SC-FDMA, the DCT-SC-FDMA and the DST-SC-FDMA systems when 16QAM is
used.
SNR(dB)
DFT-SC-FDMA DCT-SC-FDMA DST-SC-FDMA
DFT-LFDMA
DFT-IFDMA
DCT-LFDMA
DCT-IFDMA
DST-LFDMA
DST-IFDMA
0 8.7691 8.7008 8.7532 8.6578 8.7435 8.6850
5 10.2697 9.3899 10.0285 9.3900 10.0044 9.3696
10 13.0524 11.7599 12.8112 11.8620 12.8034 11.8552
15 16.4961 15.9245 16.1343 16.2217 16.0954 16.0546
20 21.0151 22.7711 21.2917 23.5329 21.1310 23.4453
25 26.9265 30.8800 28.6601 32.1253 28.3922 31.8325
30 33.2733 35.2852 35.2801 37.7103 35.4358 38.9662
35 44.4245 56.9953 44.3399 57.7223 47.9389 60.7519
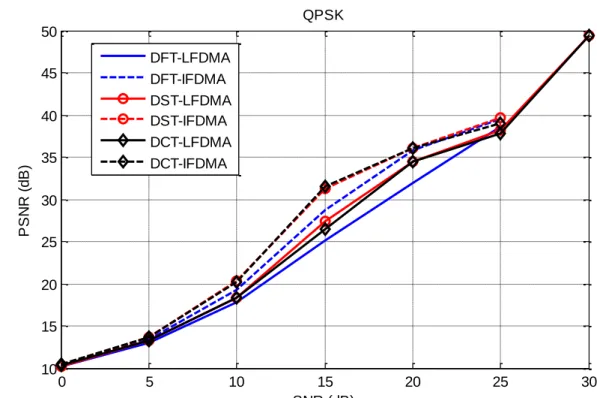
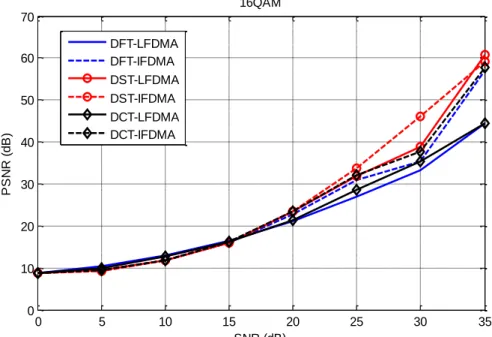
Fig. 5 and 6 show the relationship between PSNR and SNR when Cameraman image is transmitted through the DFT-SC-FDMA, DST- SC-FDMA and DCT- SC-FDMA systems for different subcarriers mapping schemes when QPSK and 16QAM modulation schemes are used, respectively. As illustrated in both figures, it is observed that PSNR is increased as SNR is increased Clearly, it is observed that the interleaved systems give better PSNR
performance than the localized systems. Moreover, it is also noted that DST-IFDMA and DCT-IFDMA systems provide better PSNR performance than DFT-IFDMA system. Furthermore, both DST-IFDMA and DCT-IFDMA systems provide the same PSNR performance as shown in Fig.5 but PSNR performance of DST-IFDMA is better than DCT-IFDMA beyond 20 dB as shown in Fig. 6.
Figure 5: PSNR against SNR of the Lena image transmission over the DFT-OFDMA,
0 5 10 15 20 25 30
10 15 20 25 30 35 40 45 50
SNR (dB)
P
S
N
R
(
d
B
)
QPSK
A.
MSE PerformanceIn this subsection, the overall performance of MSE is tested and investigated. For that purpose, Cameraman image is transmitted over DFT-SC-FDMA, DST-SC-FDMA and DCT-SC-FDMA for different subcarriers mapping schemes when the QPSK and the 16QAM modulation techniques are used. The obtained values of MSE are presented in Tables 4 and 5 and plotted in Figs. 7 and 8.
Figures 7 and 8 illustrate the relationship between MSE and SNR when Cameraman image is transmitted through the DFT-SC-FDMA, DST-SC-FDMA and DCT-SC-FDMA systems for different subcarriers mapping schemes when QPSK and 16QMA modulation schemes are used. It is observed that the MSE decreases when SNR increases. However, we observed that the interleaved systems give lower values of MSE than the localized systems.
Table 4: MSE values of the received Cameraman image over the DFT-SC-FDMA, the DCT-SC-FDMA and the DST-SC-FDMA systems when QPSK is used.
SNR(dB)
DFT-SC-FDMA DCT-SC-FDMA DST-SC-FDMA
DFT-LFDMA
DFT-IFDMA
DCT-LFDMA
DCT-IFDMA
DST-LFDMA
DST-IFDMA
0 8.7691 8.7008 8.7532 8.6578 8.7435 8.6850
5 10.2697 9.3899 10.0285 9.3900 10.0044 9.3696
10 13.0524 11.7599 12.8112 11.8620 12.8034 11.8552 15 16.4961 15.9245 16.1343 16.2217 16.0954 16.0546 20 21.0151 22.7711 21.2917 23.5329 21.1310 23.4453 25 26.9265 30.8800 28.6601 32.1253 28.3922 31.8325 30 33.2733 35.2852 35.2801 37.7103 35.4358 38.9662 35 44.4245 56.9953 44.3399 57.7223 47.9389 60.7519
Figure 6: PSNR against SNR of the Lena image transmission over the DFT-OFDMA, the DCT-OFDMA and the DST-OFDMA systems when the 16QAM is
used.
0 5 10 15 20 25 30 35
0 10 20 30 40 50 60 70
SNR (dB)
P
S
N
R
(
d
B
)
16QAM
Table 5: MSE values of the received Cameraman image over the DFT-SC-FDMA, the DCT-SC-FDMA and the DST-SC-FDMA systems when 16QAM is used.
SNR(dB)
DFT-SC-FDMA DCT-SC-FDMA DST-SC-FDMA
DFT-LFDMA
DFT-IFDMA
DCT-LFDMA DCT-IFDMA
DST-LFDMA
DST-IFDMA
0 0.1328 0.1349 0.1333 0.1362 0.1336 0.1354
5 0.0940 0.1151 0.0993 0.1151 0.0999 0.1156
10 0.0495 0.0667 0.0523 0.0651 0.0524 0.0652
15 0.0224 0.0256 0.0244 0.0239 0.0246 0.0248
20 0.0079 0.0053 0.0074 0.0044 0.0077 0.0045
25 0.0020
8.1658e-004 0.0014 6.1301e-004 0.0014
6.5577e-004
30
4.7062e-004
2.9613e-004
2.9647e-004 1.6942e-004
2.8604e-004
1.2688e-004
35
3.6104e-005
1.9974e-006
3.6814e-005 1.6896e-006
1.6074e-005
8.4102e-007
As illustrated in both figures, it is also noted that the DST-IFDMA and DCT-IFDMA systems give slightly lower MSE values than DFT-IFDMA system. Additionally, both DST-IFDMA and
DCT-IFDMA systems provide the same MSE values as shown in Fig.7 but MSE values of DST-IFDMA are little bit lower than DCT-IFDMA beyond 27 dB as shown in Fig. 8
Figure 7: MSE versus SNR of the Lena image transmission over the
DFT-OFDMA, the DCT-OFDMA and the DST-OFDMA systems when the QPSK
is used.
0 5 10 15 20 25 30
10-5 10-4 10-3 10-2 10-1
snr (dB)
M
S
E
QPSK
DFT-LFDAM DFT-IFDMA
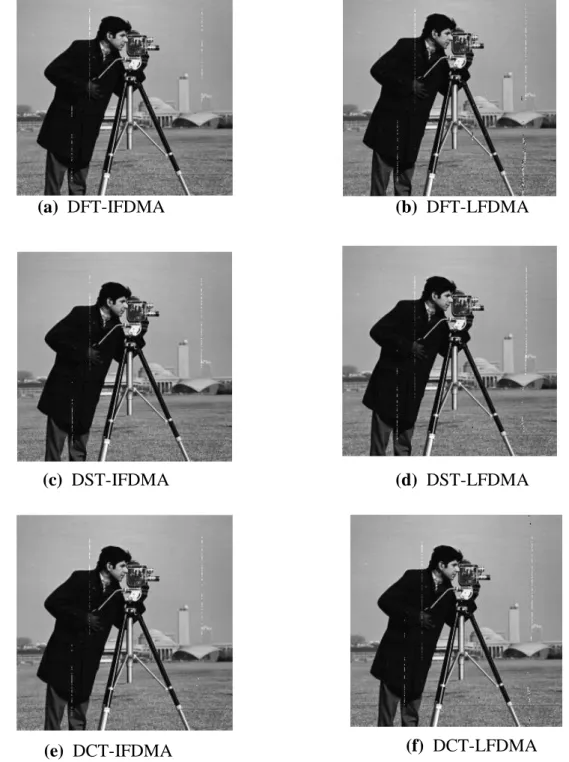
A.Clarity Investigation
As mentioned earlier, two metrics are used to measure and evaluate the performance of SC-FDMA for different basis functions, different modulation schemes and different subcarriers mapping schemes. To clarify the quality of the received image over the system, the reconstructed image at an SNR= 15 and QPSK dB are selected and shown in Fig. 9. By comparing the received images with the original images shown in Fig. 4, it is concluded that the quality of the received image by using DST-SC-FDMA and DCT-SC-DST-SC-FDMA systems are better than those images that are received by using the conventional DFT-SC-FDMA system for different subcarriers mapping schemes.
CONCLUSION
In this paper, the performance of SC-FDMA for different basis functions, different modulation schemes and different subcarriers mapping schemes has been investigated and tested. For that purpose, wireless transmission of gray-scale images over SC-FDMA system has been studied. It is concluded that transmits wireless images over SC-FDMA systems is possible for different basis functions. In addition, all of the simulation result achieved over DST-SC-FDMA and DCT-SC-FDMA systems show noticeable improvement in term of PSNR and MSE metrics. Moreover, the interleaved scheme provides better MSE and PSNR performances than the localized schemes for all systems. Figure 8: MSE versus SNR of the Lena image transmission over the DFT-SC-FDMA, the
DCT-OFDMA and the DST-OFDMA systems when the 16QAM is used.
.
0 5 10 15 20 25 30 35
10-7
10-6
10-5
10-4
10-3
10-2
10-1
100
SNR (dB)
M
S
E
16QAM
REFERENCES
[1] D. Falconer, A. Ariyavisitakul , A. Benyamin-Seeyar, B. Eidson,“ Frequency domain equalization for single-carrier broadband wireless systems,” IEEE Communications Magazine, Vol. 40, No. 4, pp. 58 – 66, Apr 2002.
[2] F. Pancaldi , G. M. Vitetta, R. Kalbasi, N. Al-Dhahir, M. Uysal, H. Mheidat, “ Single-carrier frequency domain equalization,” IEEE Signal
Processing Magazine, Vol. 25, No. 5, September 2008.
[3] H. G. Myung, J. Lim, and D. J. Goodman, “Single carrier FDMA for uplink wireless transmission,” IEEE Veh. Technol. Mag., Vol. 1, No. 3, pp. 30–38, 2006. [4] H. G. Myung and D. J. Goodman, Single Carrier FDMA: A New Air Interface for Long Term Evaluation, John Wiley & Sons, Chichester, UK, 2008.
[5] F. E. Abd El-Samie, F. S. kamali, A. Y. Al-Nahari, and M. I. Dessouky, SC-FDMA for Mobile Communications, CRC Press, 2013.
[6] A. Sohl and A. Klein, “ Comparison of localized, interleaved and block interleaved FDMA in terms of
(a) DFT-IFDMA (b) DFT-LFDMA
(c) DST-IFDMA (d) DST-LFDMA
(e) DCT-IFDMA (f) DCT-LFDMA
pilot multiplexing and channel estimation,” In Proceedings of 15th European signal processing
conference, 2007.
[7] U. Sorger, I. De Broeck, and M. Schnell, “Interleaved FDMA-a new spread-spectrum multiple-access scheme,” IEEE ICC’98, Jun. 1998.
[8] S. Jindal and D. Agarwal, “Performance evaluation of image transmission over MC-CDMA system using two interleaving schemes,” Proc. Of the ICACCI 2014, pp. 1341–1347, 2014
[9] F. S. Al-Kamali, A. A. Qasem, S. A. Abuasbaa and G. A. Qasem “SC-FDMA and OFDMA: An Efficient Wireless Image Transmission Schemes”,
Journal of Control and Systems Engineering, Vol. 4, No. 1, pp. 74-83, 2016.
[10] A. Elbehery,S. S. Abdelwahab, M. El Naby, E.S. Hassan and S. Elaraby. “ Image Transmission with DCT Based SC-FDMA System Using Continuous Phase Modulation”, IEEE 30th National Radio Science Conference (NRSC), P. 149 – 157, 16-18 April 2013
[11] F. S. Al-Kamali and A. A. Qasem, “Wireless Images Transmission over OFDMA Systems: Investigation and Evaluation,” IET JOE. pp. 1-12, 2016.
[12] A. F. Al-Junaid and F. S. Al-kamali, “Efficient wireless transmission scheme based on the recent DST-MC-CDMA,” Wireless Networks Journal, Springer, Vol. 22, No. 3, pp. 813-824, April 2016. [13] Y. Sun and Z. Xiong, “Progressive image transmission over space-time coded OFDM-based MIMO systems with adaptive modulation,” IEEE Trans. On Mobile Computing, Vol. 5, No. 8, pp. 1016-1028, 2006.
[14] P. Tan and N. C. Beaulieu, “A Comparison of DCT-Based OFDM and DFT-Based OFDM in Frequency Offset and Fading Channels”, IEEE Transactions on Communications , Vol. 54, No. 11, Nov. 2006.
[15]