Siriwan Piyapittayanan, M.D.*, Chomsiri Segsarnviriya, M.D.*, Chanon Ngamsombat, M.D.*, Theerapol Witthiwej, M.D.**, Pornsuk Cheunsuchon, M.D.***, Panida Charnchaowanish, B.Sc.*, Orasa Chawalparit, M.D.*
*Department of Radiology, **Department of Surgery, ***Department of Pathology, Faculty of Medicine Siriraj Hospital, Mahidol University, Bangkok 10700, Thailand.
Comparison between Dynamic Contrast-Enhanced
MRI and Dynamic Susceptibility Contrast MRI in
Glioma Grading
Correspondence to: Orasa Chawalparit E-mail: oak_art@yahoo.com
Received 11 October 2016 Revised 30 March 2017 Accepted 4 April 2017 doi:10.14456/smj.2017.69
ABSTRACT
Objective: To determine the usefulness of the dynamic contrast enhanced MRI (DCE-MRI) technique for differentiating
between low grade glioma and high grade glioma and compare with dynamic susceptibility contrast (DSC) MRI.
Methods: Conventional MRI, DCE-MRI and DSC-MRI were performed preoperatively in 17 patients with gliomas.
Permeability indices (Ktrans, rKtrans, V
e and Kep) from DCE-MRI and cerebral blood volume (CBV), rCBV from
DSC-MRI were quantified. The differences in Ktrans, rKtrans, V
e, Kep, CBV and rCBV between low grade glioma and high
grade glioma were analyzed and compared. Receiver operating characteristic (ROC) curve analyses were conducted.
Results: Ktrans, rKtrans, V
e, CBV and rCBV were significantly different between low grade glioma and high grade glioma
(p = 0.001, 0.014, 0.02, 0.025, and 0.034, respectively). The areas under the ROC curve for Ktrans, rKtrans, V
e, rCBV
and CBV were 0.986, 0.896, 0.829, 0.852, and 0.833, respectively. Ktrans was the best parameter for differentiating
low grade glioma from high grade glioma with cutoff value of 0.0091 min-1 (sensitivity 100%, specificity 80%, PPV 87.5%, NPV 100%, accuracy 94.1%).
Conclusion: DCE-MRI could be used to estimate neovascular permeability and for pre-operative grading of glioma.
Among the perfusion parameters, Ktrans was the best parameter for differentiating low grade glioma from high grade
glioma . DCE-MRI may be promising for better diagnostic performance than DSC-MRI.
Keywords: Dynamic contrast-enhanced MRI; cerebral blood volume; Ktrans; glioma (Siriraj Med J 2017;69: 369-376)
INTRODUCTION
Glioma is the most common primary intracranial neoplasm, being graded according to World Health Organization (WHO) classification from grade 1 to 4. The grading of glioma is clinically important as it determines the appropriate therapy for the patients. Conventional MRI (cMRI) provides important anatomical and diagnostic information of brain tumors. Although gadolinium-based cMRI is routinely used to predict the grade of a glioma, it is sometimes unreliable with wide range of sensitivity from 55.1% to 83.3%.1-5
Neovascular proliferation and degree of permeability are important in evaluation of biological aggressiveness and malignant grade in the context of glioma. The noninvasive perfusion MRI using dynamic susceptibility contrast (DSC) and dynamic contrast-enhanced (DCE) methods have been widely implicated in the assessment of glial neoplasm. In many previous studies, relative cerebral blood volume (rCBV) measurements from DSC-MRI showed reliable correlation with tumor grade and histopathologic findings of increased tumor vascularity6-9. However,
susceptibility artifact due to T2* effect on DSC-MRI which may influence the measurement. Recently, T1-weighted DCE–MRI has been found to permit evaluation of tumor neovasculature and permeability change with higher-spatial resolution and less susceptibility effect compared with DSC-MRI. Based on the MRI signal and pharmacokinetic models, the data have permitted the creation of parameters such as volume transfer constant (Ktrans) and volume of extravascular extracellular space
(EES) per unit volume of tissue (Ve) which lead to the qualitative and quantitative evaluation of the angiogenetic characteristics of tumors, assessment of tumor grade, and determination of the site for biopsy. Presently, there is no standard guideline or pharmacokinetic model of DCE-MRI in brain tumor. Additionally, the value of DCE parameters from each institute cannot be compared.
The aim of this study was to evaluate the diagnostic accuracy of the differentiation between low grade glioma
and high grade glioma with DCE-MRI compared to DSC-MRI in our institute.
MATERIALS AND METHODS
Patient selection
The approval for the study was obtained from ethical committee of the institute before enrolling the patients. The patients were enrolled during June 2013 to December 2014. Seventeen patients (8 males, 9 females; mean age 44.29 years old; age range 17-73 years old) who underwent tumor resection or biopsy with pathologically confirmed gliomas and classified into low grade glioma and high grade glioma according to the 2007 WHO classification were recruited (Table 1). No patient received any other treatment (radiotherapy, chemotherapy) before imaging or surgery. All patients underwent cMRI and DCE–MRI, but only 15 out of 17 patients underwent DSC-MRI within 1-34 days, preoperatively.
TABLE 1. Histopathologic diagnoses of gliomas.
Diagnosis Number of patients
Low-grade gliomas (n=10, 58.8%)
Ganglioglioma (WHO grade I) 1
Diffuse astrocytoma (WHO grade II) 5
Oligoastrocytoma (WHO grade II) 3
Oliogodendroglioma (WHO grade II) 1
High-grade gliomas (n=7, 41.2%)
Anaplastic oligoastrocytoma (WHO grade III) 1
Anaplastic oligodendroglioma (WHO grade III) 1
Glioblastoma (WHO grade IV) 5
Magnetic resonance techniques
MRI examinations were performed on a 3-Tesla MR system (Ingenia, Philips Medical System, Best, the Netherlands) with a 16-element head matrix coil. Routine cMRI included the following: non-contrast enhancement axial and sagittal T1-weighted image, axial and coronal T2-weighted image, axial fluid-attenuated inversion recovery (FLAIR), susceptibility weighted imaging (SWI) and diffusion weighted imaging/apparent diffusion coefficient map (DWI/ADC). Contrast-enhanced T1-weighted image was achieved in three orthogonal planes.
Perfusion MRI
DCE-MRI was performed in the first gadolinium injection. Three datasets of precontrast images were
factor 40) with flip angle of 6 degrees. The last image set consisted of 30 or 70 dynamic time points for each slice with temporal spacing of approximately 5.1 seconds. The total scan time of 30 and 70 dynamic measurements from DCE-MRI technique were 2.33 and 5.57 minutes, respectively. DCE-MRI was performed with 30 dynamic acquisitions in 12 patients and 70 dynamic acquisitions in 5 patients. From the datas of 70 dynamic series, DCE parameters of 30 dynamic series could also be evaluated. Then, DSC-MRI was performed using 3D Principles of Echo Shifting with a Train of Observations (PRESTO) sequence acquired during the first pass of Gadobutrol in the same amount of DCE at a rate of 5 mL/sec followed by a 30 mL saline flush. Imaging parameters were: FOV, 220x179 mm; section thickness, 3.5 mm; matrix, 64x 128; in-plane voxel size, 1.72x1.72 mm; flip angle, 7 degrees. A total of 60 dynamic images were acquired at 1-second intervals. Three baseline acquisitions were acquired before contrast injection. The total scan time of DSC-MRI technique was 1.16 minutes. The DSC-MRIs were available in 15 cases.
Image analysis
DCE data processing
Image analysis of DCE was carried out by using commercially available software (Philips IntelliSpace Portal, Philips Healthcare, Best, the Netherlands). The modified Tofts and Kermode pharmacokinetic model was used to calculate the Ktrans, V
e and Kep values10. This
pharmacokinetic model is based on the assumption that contrast agents exist in two interchanging compartments (plasma and EES).
Fig 1. A 43-year-old male with pathologically proven glioblastoma with oligodendroglial component WHO 2007 grade IV. Images demonstrate ROIs in enhancing areas of tumor and contralateral NAWM. a. CBV map from DSC-MRI and parameter maps from DCE-MRI with (1) 30 and (2) 70 dynamic acquisitions
The measurements of Ktrans, V
e and Kep were obtained
by simultaneous observation on axial post-contrast T1-weighted image and the corresponding parametric maps. Post-contrast T1-weighted image for enhancing tumors and T2-weighted image or FLAIR for non-enhancing tumors were used as a guide for tumor location. In some case, the parametric maps showed no color abnormality as compared with the normal background. The regions of interest (ROIs) were positioned on axial post-contrast T1-weighted mapping after careful inspection of T2-weighted image and FLAIR which showed the location of the tumor and automatically transferred on to the parametric maps. (Fig 1 and 2). Automatic search for arterial input function was done.
DSC data processing
Data processing was performed on commercial software (Philips Extended MR WorkSpace 2.6.3.5, Philips Healthcare, Best, the Netherlands). The measurements of CBV were obtained by observation on color maps.
ROI selection
An experienced neuroradiologist (S.P.) and neuroimaging fellow (C.S.) placed three to five separated ROIs for lesion in the most obvious enhancing portion or the maximal perfusion abnormality and the contralateral normal appearing white matter (NAWM) on DSC and DCE maps to obtain the Ktrans, V
e, Kep and CBV values.
Then the mean values of each parameter were calculated. Cystic, necrotic, hemorrhagic regions, and normal vessels within the ROI were avoided during ROI selection (Fig1 and 2). The ratios of CBV (rCBV) and ratio of Ktrans
(rKtrans) from the lesion compared with contralateral
Fig 2. A 19-year-old female with diagnosed diffuse astrocytoma, WHO 2007 grade II. Images demonstrate ROIs in non-enhancing tumor and contralateral NAWM. T2-weighted image or FLAIR were used as a guide for tumor. CBV map from DSC-MRI and parameter maps from DCE-MRI with (1) 30 and (2) 70 dynamic acquisitions
Statistical analysis
All statistical analyses were performed by using SPSS software (version 18.0.0, SPSS Inc., Chicago, IL, USA) The Wilcoxon signed ranks test was used to compare the lesions with contralateral NAWM. The median of the Ktrans, rKtrans, V
e, Kep, CBV and rCBV were compared
in each low grade glioma and high grade glioma. The Mann-Whitney U test was used to compare the low grade glioma and high grade glioma with respect to Ktrans, rKtrans,
Ve, Kep, CBV and rCBV values. A value of p < 0.05 was regarded as statistically significant. The ROC curve was performed to identify cutoff point and the diagnostic performance of each parameter for distinguishing low grade glioma from high grade glioma was calculated.
RESULTS
For the Ktrans of both groups of tumors, V e and
CBV of high grade glioma were significantly higher than NAWM. Whereas the Kep in both groups of tumor, Ve and CBV of low grade glioma were not significantly different from NAWM.
In low grade glioma, the Ktrans, rKtrans and V e value
from 30 dynamic acquisitions DCE; CBV and rCBV from DSC were significantly lower than those of high grade glioma (p = 0.001, 0.014, 0.02, 0.025, and 0.034, respectively). There was no significant difference of Kep between low grade glioma and high grade glioma (p = 0.89) (Tables 2, 3 and 4).
The ROC curve analysis of Ktrans, rKtrans, V e, CBV
and rCBV values for differentiation between low grade glioma and high grade glioma were statistically significant.
(Fig 3)
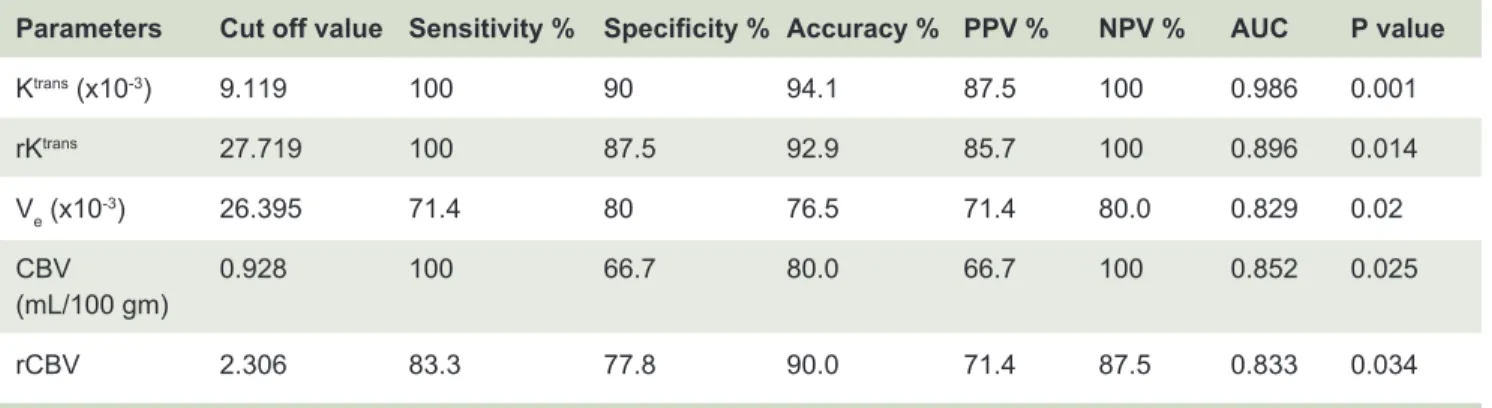
Diagnostic performance, including sensitivity, specificity, accuracy, positive predictive value (PPV) and negative predictive value (NPV) of imaging parameters with high predictive value (p <0.05) in differentiation of low grade glioma and high grade glioma using ROC analysis were demonstrated in Table 5.
When compared between 30 and 70 dynamic DCE, there was tendency of higher values of all parameters from 70 dynamic scans than that of 30 dynamic scans
(Table 3).
DISCUSSION
Our study demonstrated significant higher CBV in high grade glioma than in NAWM. However, CBV of low grade glioma was not significantly different from NAWM. Previous studies also showed the same findings.4,9
CBV and rCBV values of high grade glioma were also significantly higher than that of low grade glioma with the cutoff values of 0.928 ml/100gm for CBV (sensitivity 100%, specificity 66.7% and accuracy 80.0%) and 2.306 for rCBV (sensitivity 83.3%, specificity 77.8% and accuracy 90.0%). The cutoff rCBV value with sensitivity and specificity from our study were approximate to the result from Direksunthorn et al’s study.8
The permeability of vascular structure is able to be measured with DCE–MRI. According to the modified Tofts and Kermode pharmacokinetic model, Ktrans and V
e
TABLE 2. The median (range) for DCE parameters of 30 acquisitions from the tumor ROIs and the contralateral
NAWM ROIs.
TABLE 3. The median (range) for DCE parameters of 30 and 70 acquisitions from the tumor ROIs and the
contralateral NAWM ROIs in cases which underwent DCE with 70 dynamic acquisitions.
DCE 30 LGG (n=10) HGG (n=7)
Dynamic Lesions NAWM P value Lesions NAWM p value p value
scans LGG vs. NAWM* HGG vs. NAWM* LGG vs. HGG#
Ktrans 0.53 0.19 0.014† 42.22 0.23 0.018† 0.001†
(10-3/min) (0.04-21.61) (0-0.38) (12.54-280.36) (0-1.04)
rKtrans 2.49 94.63 0.014†
(0.62-207.82) (40.52-4833.72)
Ve 0 0 0.068 114.88 0 0.028† 0.02†
(10-3) (0-71.66) (0-0) (0-3456.28) (0-0.74)
Kep 0 0 0.109 54.36 0 0.075 0.089
(10-3/min) (0-183.72) (0-183.72) (0-223.52) (0-62.78)
Abbreviations: LGG = low-grade glioma, HGG = high-grade glioma, NAWM = contralateral normal appearing white matter, Ktrans = volume
transfer constant between EES and plasma (10-3/min), rKtrans = relative volume transfer constant between EES and plasma, V
e (10-3) = volume of
extravascular extracellular space per unit volume of tissue (10-3), K
ep (10-3/min) = rate transfer coefficient between EES and plasma (10-3/min)
*p value from Wilcoxon signed ranks test
# p value from Mann-Whitney U test
† significantly different between lesions and contralateral NAWM and between LGG and HGG, p < 0.05.
DCE LGG (n=3) HGG (n=2)
Lesions Lesions NAWM NAWM Lesions Lesions NAWM NAWM
30D 70D 30D 70D 30D 70D 30D 70D
Ktrans 5.38 15.28 0.18 1.03 31.94 63.75 0.73 3.21
(10-3/min) (0.68-5.7) (3.35-16.40) (0-0.38) (0.02-1.91) (21.66-42.22) (51.84-75.66) (0.41-1.04) (2.42-4.00)
Ve 20.30 46.49 0 2.49 146.86 751.83 0.37 5.39
(10-3) (1.73-71.6) (5.73-72.06) (0) (0-4.42) (32.49-261.23) (171.00-1332.67) (0-0.74) (3.37-7.42)
Kep 168.06 385.75 0 265.00 95.40 163.72 31.39 471.23
(10-3/min) (49.35-183.72) (229.44-568.17) (0) (42.36-335.24) (24.54-166.25) (15.64-311.79) (0-62.78) (405.57- 536.90)
According to small sample size of DCE 70 dynamic acquisitions, the statistical significant was not calculated.
Abbreviations: LGG = low-grade glioma, HGG = high-grade glioma, NAWM = contralateral normal appearing white matter, Ktrans =
volume transfer constant between EES and plasma (10-3/min), rKtrans = relative volume transfer constant between EES and plasma, V
e
(10-3) = volume of extravascular extracellular space per unit volume of tissue (10-(10-3), Kep (10-3/min) = rate transfer coefficient between EES
TABLE 4. The median (range) for CBV and rCBV of DSC-MRI from the tumor ROIs and the contralateral NAWM.
TABLE 5. Threshold values and diagnostic performance for each parameters for differentiation between LGG
and HGG.
DSC LGG (n=9) HGG (n=6)
parameters Lesions NAWM p value Lesions NAWM p value P value
LGG vs. NAWM* HGG vs. NAWM* LGG vs. HGG#
CBV 0.59 0.43 0.214 2.75 0.49 0.028† 0.025†
(mL/100gm) (0.25-3.70) (0.22-0.68) (1.01-6.16) (0.30-2.46)
rCBV 1.18 3.96 0.034†
(0.65-8.53) (1.72-9.14)
Abbreviations: LGG = low-grade glioma, HGG = high-grade glioma, NAWM = contralateral normal appearing white matter, CBV= cerebral
blood volume (ml/100 gm), rCBV = relative cerebral blood volume
* p value from Wilcoxon signed ranks test
# p value from Mann-Whitney U test
† significantly different between lesions and contralateral NAWM and between LGG and HGG, p < 0.05.
Parameters Cut off value Sensitivity % Specificity % Accuracy % PPV % NPV % AUC P value
Ktrans (x10-3) 9.119 100 90 94.1 87.5 100 0.986 0.001
rKtrans 27.719 100 87.5 92.9 85.7 100 0.896 0.014
Ve (x10-3) 26.395 71.4 80 76.5 71.4 80.0 0.829 0.02
CBV 0.928 100 66.7 80.0 66.7 100 0.852 0.025
(mL/100 gm)
rCBV 2.306 83.3 77.8 90.0 71.4 87.5 0.833 0.034
Abbreviations: LGG = low-grade glioma, HGG = high-grade glioma
and Ve values were increased. In our study, Ktrans and V e
values were significantly different between tumors and NAWM, particularly in high grade glioma which might be from more destroyed blood–brain barrier.
Our results also showed that the Ktrans, rKtrans and
Ve from DCE-MRI 30 dynamic acquisitions were able to distinguish low grade glioma from high grade glioma. This finding was in agreement with a prior study that showed a good correlation between Ktrans or V
e and the
grades of gliomas.11
It was known that Ktrans depended on blood flow,
blood volume, the product of the capillary wall permeability and the surface area, whereas Ve was the ratio of quantity of contrast agent leaked into the EES to that returned to the plasma space.11,12
Among three DCE-MRI parameters, Ktrans had the
best discrimination between the low grade glioma and high grade glioma with the best sensitivity (100%), specificity (90%), PPV (87.5%), NPV (100%) and accuracy (94.1%) with the largest area under the ROC curves (0.986) and lowest p-value (0.014). A number of studies on glioma grading by using pharmacokinetic parameters from DCE MR imaging (in particular, Ktrans, V
e, Kep and Vp) have
been published.6,11,13-17 The results of these and previous
investigations suggested that Ktrans was a better predictive
parameter for grading glioma.11,16
In this study, the best cutoff value of Ktrans = 0.0091/
min, and Ve = 0.0264 for differentiating between low grade glioma and high grade glioma were lower than obtained from previous studies.11,16,18 Jia et al., showed
that the cutoff value of Ktrans = 0.035/min (sensitivity
value of Ve = 0.130 (sensitivity 81.5%, specificity 94.1% and AUC 0.883) gave the best discrimination.11 The
discrepancy of the DCE parameters from each study may be associated with the difference in pulse sequence, arterial input function selection, the pharmacokinetic models and dynamic scan time.19
However, there were some disagreements in the ability of Ve values for differentiation between low grade glioma and high grade glioma. Lüdemann et al found that there were no significant differences of Ve between low grade glioma and high grade glioma.20 Our results
showed that Ve of low grade glioma was significantly lower than that of high grade glioma (Table 2). This indicated that the leakage volume was greater in high grade glioma than in low grade glioma. Ve value is influenced by several factors, such as the volume of the EES and the permeability of the vessels. For example, the volume of the EES increases in areas of necrosis or cyst formation and decreases in areas of higher cellularity. The volume of EES in high grade glioma is larger, probably due to necrosis, which may be why Ve in high grade glioma is increased. Although we avoided visualized cystic or necrotic portion on ROIs, there were micronecrosis and partial volume effect which might include more than one tissue types such as micronecrosis in a voxel.19 The
different method in placing ROI from the parameter maps of DCE-MRI may have influenced the Ve value due to the tumor inhomogeneity including area of higher cellularity, necrosis or micronecrosis.
The ability of Kep for tumor grading is still inconclusive. Awasthi et al found significant higher Kep in high grade glioma than low grade glioma and positive correlation between Kep and matrix metalloproteinase 9 which was overexpressed in malignant glioma cells and facilitated the invasiveness of tumor cells and tumor angiogenesis.13
Zhang et al found Kep in tumor tissue was significantly lower than that in normal brain tissue, but almost constant with the tumor grades.16 In our study, K
ep tended to be
higher in high grade glioma in 30 dynamic scans, but we did not find any significant differences between the tumor and contralateral NAWM and between tumor grades. We also demonstrated the tendency of higher values of DCE-MRI parameters from 70 dynamic scans than that of 30 dynamic scans. These results could be due to too short scan time in 30 dynamic acquisitions (2.33 minutes) which might not allow the contrast agent into the equilibrium stage, so that Kep values might not be well-evaluated. In 70 dynamic acquisitions (5.57 minutes), we observed more obvious enhancement on T1 mapping and more prominent abnormal permeability on DCE parametric maps. (Fig 1)
There were some limitations in this study. First, the sample size was slightly small for an effective statistical comparison, including accuracy of significant threshold value to distinguish the groups. Second, because of tumor inhomogeneity, the perfusion values from some parts of tumor might not reflect the entire-tumor characteristics and might have partial volume effect. Therefore, histogram analyses of pharmacokinetic parameters from parts of entire-tumor volumes may be useful. Lastly, short DCE scan time might not allow the contrast agent into the equilibrium stage. Longer DCE series might be better in representing the permeability.
CONCLUSION
DCE–MRI can be used to estimate neovascular permeability and for pre-operative grading of glioma. High grade glioma had significantly higher values of Ktrans, and V
e than low grade glioma. The cutoff values
of Ktrans = 0.0091/min and V
e = 0.0264 were effective
for differentiating between low grade glioma and high grade glioma. Among the perfusion parameters, Ktrans is
the best predictor due to highest sensitivity, specificity, accuracy, largest AUC. DCE-MRI had better diagnostic performance than DSC-MRI.
ACKNOWLEDGMENTS
The study was funded by Faculty of Medicine Siriraj Hospital. All of the authors in this study were supported by Chalermphrakiat Grant, Faculty of Medicine Siriraj Hospital, Mahidol University.
REFERENCES
1. Dean BL, Drayer BP, Bird CR, Flom RA, Hodak JA, Coons SW, et al. Gliomas: classification with MR imaging. Radiology. 1990;174(2):411-5.
2. Watanabe M, Tanaka R, Takeda N. Magnetic resonance
imaging and histopathology of cerebral gliomas. Neuroradiology. 1992;34(6):463-9.
3. Kondziolka D, Lunsford LD, Martinez AJ. Unreliability of contemporary neurodiagnostic imaging in evaluating suspected adult supratentorial (low-grade) astrocytoma. J Neurosurg. 1993;79(4):533-6.
4. Knopp EA, Cha S, Johnson G, Mazumdar A, Golfinos JG,
Zagzag D, et al. Glial neoplasms: dynamic contrast-enhanced T2*-weighted MR imaging. Radiology. 1999;211(3):791-8. 5. Law M, Yang S, Wang H, Babb JS, Johnson G, Cha S, et al.
Glioma grading: sensitivity, specificity, and predictive values of perfusion MR imaging and proton MR spectroscopic imaging compared with conventional MR imaging. AJNR Am J Neuroradiol. 2003;24(10):1989-98.
imaging with glioma grade. AJNR American journal of neuroradiology. 2004;25(5):746-55.
7. Law M, Young R, Babb J, Pollack E, Johnson G. Histogram analysis versus region of interest analysis of dynamic susceptibility contrast perfusion MR imaging data in the grading of cerebral gliomas. AJNR Am J Neuroradiol. 2007;28(4):761-6. 8. Direksunthorn T, Chawalparit O, Sangruchi T, Witthiwej
T, Tritrakarn SO, Piyapittayanan S, et al. Diagnostic performance of perfusion MRI in differentiating low-grade and high-grade gliomas: advanced MRI in glioma, A Siriraj project. J Med Assoc Thai. 2013;96(9):1183-90.
9. Aronen HJ, Gazit IE, Louis DN, Buchbinder BR, Pardo FS, Weisskoff RM, et al. Cerebral blood volume maps of gliomas: comparison with tumor grade and histologic findings. Radiology. 1994;191(1):41-51.
10. Chikui T, Obara M, Simonetti AW, Ohga M, Koga S, Kawano S, et al. The principal of dynamic contrast enhanced MRI, the method of pharmacokinetic analysis, and its application in the head and neck region. Int J Dent. 2012;2012:480659. 11. Jia Z, Geng D, Xie T, Zhang J, Liu Y. Quantitative analysis of
neovascular permeability in glioma by dynamic contrast- enhanced MR imaging. J Clin Neurosci. 2012;19(6):820-3. 12. Peng SL, Chen CF, Liu HL, Lui CC, Huang YJ, Lee TH, et al.
Analysis of parametric histogram from dynamic contrast- enhanced MRI: application in evaluating brain tumor response to radiotherapy. NMR Biomed. 2013;26(4):443-50.
13. Awasthi R, Rathore RK, Soni P, Sahoo P, Awasthi A, Husain N, et al. Discriminant analysis to classify glioma grading using
dynamic contrast-enhanced MRI and immunohistochemical markers. Neuroradiology. 2012;54(3):205-13.
14. Choi HS, Kim AH, Ahn SS, Shin NY, Kim J, Lee SK. Glioma grading capability: comparisons among parameters from dynamic contrast-enhanced MRI and ADC value on DWI. Korean journal of radiology. 2013;14(3):487-92.
15. Jackson A, O’Connor JP, Parker GJ, Jayson GC. Imaging tumor vascular heterogeneity and angiogenesis using dynamic contrast-enhanced magnetic resonance imaging. Clin Cancer Res. 2007;13(12):3449-59.
16. Zhang N, Zhang L, Qiu B, Meng L, Wang X, Hou BL. Correlation of volume transfer coefficient Ktrans with histopathologic grades of gliomas. J Magn Reson Imaging. 2012;36(2):355-63. 17. Provenzale JM, Wang GR, Brenner T, Petrella JR, Sorensen
AG. Comparison of permeability in high-grade and low-grade brain tumors using dynamic susceptibility contrast MR imaging. AJR Am J Roentgenol. 2002;178(3):711-6.
18. Jung SC, Yeom JA, Kim JH, Ryoo I, Kim SC, Shin H, et al. Glioma: Application of histogram analysis of pharmacokinetic parameters from T1-weighted dynamic contrast-enhanced MR imaging to tumor grading. AJNR Am J Neuroradiol. 2014;35(6):1103- 10.
19. Jackson A. Analysis of dynamic contrast enhanced MRI. Br J Radiol. 2004;77 Spec No 2:S154-66.