DOI: 10.21953/lse.sypd8fxo2bs5
Article received 11 June 2018, accepted 12 January 2019 and published 3 April 2019 Suggested citation:
Malley, J., Rand, S., Netten, A., Towers, A.-M., & Forder, J. (2019). Exploring the feasibility and validity of a pragmatic approach to estimating the impact of long-term care: The ‘expected’ ASCOT method. Journal of Long-Term Care, April, 67–83. doi:10.21953/lse.sypd8fxo2bs5
The Journal of Long-Term Care is an international, multi- and interdisciplinary, peer-reviewed, online journal established as a focus for advancing the research evidence base for all aspects of long-term care for adults. It is managed by the International Long-Term Care Policy Network at the London School of Economics and Political Science and has received funding from the National Institute for Health Research School for Social Care Research.
The Journal’s range includes empirical papers and theoretical discussions relevant to policy and practice, and methodological papers about improving methods in social care research.
The editorial board welcomes submissions of high quality, original articles that fit with the Journal’s remit. We will consider articles that are also relevant to the care of children and younger people where there is clear relevance for adult care (e.g. concerning issues of families or transitions into adult care). There is no fee for submitting or publishing articles, which will be made available with open access on the journal’s website to encourage maximum impact for all work.
Correspondence and enquiries should be addressed to the managing editor at: Journal.of.Long-Term.Care@lse. ac.uk. Further information is available on the journal website, https://www.ilpnetwork.org/journal/
Executive Editor: Dr Jose-Luis Fernandez, London School of Economics and Political Science Managing Editor: Dr Michael Clark, London School of Economics and Political Science Assistant Editor: Dr Juliette Malley, London School of Economics and Political Science Editorial Officer: Nick Brawn
Editorial Board
Professor David Abbott, University of Bristol Professor Jennifer Beecham, University of Kent
Dr Blanche Le Bihan, École des hautes études en santé publique Professor Yvonne Birks, University of York
Professor John Campbell, University of Michigan Professor David Challis, University of Manchester
Dr Barbara Da Roit, Universiteit van Amsterdam & Università Ca’ Foscari Venezia Professor Julien Forder, University of Kent
Professor Courtney Van Houtven, Duke University Professor Naoki Ikegami, Keio University in Tokyo Dr Lennarth Johansson, Karolinska Institutet
Professor Martin Knapp, London School of Economics and Political Science Dr Giovanni Lamura, Istituto Nazionale di Riposo e Cura per Anziani Professor Jill Manthorpe, King’s College London
Anji Mehta, London School of Economics and Political Science Professor Marthe Nyssens, Université catholique de Louvain Professor Heinz Rothgang, University of Bremen
Professor Ulrike Schneider, Vienna University of Economics and Business Administration Professor Gerdt Sundström, Jönköping University
Journal of Long-Term Care
Exploring the feasibility and validity of a
pragmatic approach to estimating the impact of
long-term care: The ‘expected’ ASCOT method
Juliette Malley, Stacey Rand, Ann Netten, Ann-Marie Towers and Julien Forder
Abstract
Context: Measuring the impact of long-term care (LTC) is essential if we are to allocate limited resources effectively. Objectives: We explored the feasibility and validity of a pragmatic approach to evaluation, known as the counter-factual self-estimation of programme participants (CSEPP). CSEPP forms part of the Adult Social Care Outcomes Toolkit (ASCOT), and is referred to as the ‘expected’ method since participants estimate their expected quality of life (QoL) in the absence of services.
Methods: We used survey data from interviews with 748 LTC users in 22 English local authorities, which included questions on self- and interviewer-assessed understanding of the ‘expected’ questions. We used these data to assess feasibility. Construct validity was assessed by examining hypothesised associations between the expected score and individual characteristics. Bias was assessed by comparing the CSEPP impact estimate to one produced using the instrumental variables approach used by Forder et al. (2016, 2018) on the same dataset.
Findings: We found evidence that the CSEPP/‘expected’ method was feasible and the self-estimated counterfac-tual outcome scores valid. There were indications that the method is less appropriate for some groups and that it may slightly overestimate the impact of LTC.
Limitations: The main limitation is that the between-methods comparison assumes that the instrumental variables approach provides a largely unbiased estimate of the effect of LTC, which is unlikely to be the case.
Implications: The CSEPP/‘expected’ method is a useful tool in the LTC context, but more research is needed to under-stand potential sources of bias and its feasibility with certain groups.
Keywords: Long-term care, ASCOT, counterfactual, self-estimation bias, impact evaluation, treatment effect.
Acknowledgements and disclaimers
Funding acknowledgements: The report is based on inde-pendent research commissioned and funded by the NIHR Policy Research Programme in Quality and Outcomes of person-centred care (QORU). The views expressed in the publication are those of the author(s) and not necessarily those of the NIHR, the Department of Health and Social Care, or its arm’s length bodies or other government departments. Acknowledgements: We thank everyone who participated in the research and Accent, who undertook the fieldwork. Declaration of conflicting interests: The authors declare that there is no conflict of interest.
Juliette Malley1 (), Stacey Rand2, Ann Netten2, Ann-Marie
Towers2, Julien Forder2
1 Personal Social Services Research Unit (PSSRU), London School of Economics and Political Science, Houghton Street, London, WC2A 2AE, UK. Email: [email protected]
Introduction
Research into the effectiveness of treatment, interven-tions and policy programmes is an important source of the evidence required to deliver evidence-based policy and practice (Nutley et al., 2003). Eff ectiveness research is chal-(Nutley et al., 2003). Eff ectiveness research is chal-. Effectiveness research is chal-lenging, particularly in the field of long-term care, not least because of what is referred to as the ‘fundamental evalua-tion problem’ (Heckman & Smith, 1995). To determine the effectiveness of an intervention it is not enough to know how it affects participants; we also need to know what would have happened to them if they had not received it – the counterfactual. Since only one of the two states (actual or counterfactual) can be measured for any given individual at any one point in time, it is not possible to observe the true effect of a given treatment on an individual.
A variety of research designs are used to estimate effec-tiveness, including randomised experiments, observational studies, pre-test–post-test, and other non-experimental evaluation designs, but the evidence obtained from dif-ferent designs is generally not viewed as equally valid and reliable. The hierarchy of evidence has favoured the ran-domised controlled trial (RCT) because the design provides the best mechanism for minimising the risk that the results are due to confounding influences rather than the treatment (Evans, 2003). All designs, however, have their limitations, in terms of their ability to provide unbiased estimates of the true treatment effect, cost, and applicability to the full range of evaluation settings, interventions and policy questions (Byford & Sefton, 2003; Heckman & Smith, 1995; McKee et al., 1999; Petticrew & Roberts, 2003). While acknowledging the superiority of RCTs for particular research questions, most researchers accept the need for a range of methods to provide evidence about effectiveness (Petticrew & Roberts, 2003).
Which approach is most appropriate depends in part on the nature of the intervention being evaluated, with some settings providing the scope for approaches that would be inappropriate in others. Mueller et al. (2014) describe a novel approach to the evaluation problem that they call the ‘counterfactual self-estimation of programme participants’ – CSEPP. The CSEPP design attempts to solve the evaluation problem by asking individuals to imagine their own coun-terfactual in the absence of the intervention, and estimate what their situation would be like then. Mueller and Gaus (2015) report on a study in the field of consumer education designed to explore the validity of estimates of the true treat-ment effect using the CSEPP method. The CSEPP method performed fairly well for estimates of short- and medium-term attitudes and behavioural intentions when compared with estimates derived from a randomised experiment. It performed less well for self-reported behaviour, producing biased estimates compared with the randomised experi-ment. They conclude that the CSEPP method may be suitable
for certain types of intervention and the estimation of self-reported mental constructs, but not self-self-reported behaviour. The CSEPP method would be inappropriate for much of health care, where self-evaluation of the counterfactual would be difficult if not impossible for patients. However, the compensatory nature of social care, which makes up much of long-term care, means that on a daily basis many service users face the question of what would happen if they had no help or support. The ‘expected’ method, equivalent to the CSEPP method, was developed independently by Netten et al. (2012a) as part of the Adult Social Care Outcomes Toolkit (ASCOT) for use within the long-term care (LTC) setting. Given Mueller and Gaus’s findings, the LTC setting is ideal for this type of approach because the focus of evalua-tion is the effect of intervenevalua-tions on quality of life (QoL) – an attitudinal construct.
Using question-testing methods, including cognitive interviews and think aloud responding, Netten et al. (2012a) explored LTC service users’ comprehension of questions designed to elicit the counterfactual situation. In general, they found that people could estimate their QoL in the counterfactual situation. While the study provided tenta-tive evidence for the feasibility of the CSEPP method as it is implemented within ASCOT, it did not provide an oppor-tunity to test the validity of the method, and is limited in the generalisability of the findings because of the small sam-ples involved. In this paper, therefore, we seek to improve the evidence base for the CSEPP approach within LTC. Using ASCOT data from a study of a sample of LTC service users in England, we explore (i) the feasibility of the CSEPP approach, and (ii) the validity of the method in terms of pro-viding (a) an estimate of the counterfactual situation, and (b) an unbiased estimate of the effect of LTC interventions.
Counterfactual self-estimation of outcomes
In their exposition of CSEPP, Mueller et al. (2014) set out how intervention effects are estimated using the potential outcomes framework (Rubin, 1974). Since there are no non-participants in the CSEPP method, the relevant concept from impact evaluation is the treatment-on-the-treated (TOT) effect. This is an estimate of the impact of the treat-ment on those who receive treattreat-ment. Following Mueller et al. (2014), the TOT effect under CSEPP can be calculated as
TOTCSEPP = E[Y(1)| D = 1] – E[YEST(0)| D = 1], (1)
where TOTCSEPP is the counterfactual self-estimation of the effect of treatment on the treated; D is the binary treatment variable, where D = 1 is treatment participation and D = 0 is non-participation; E[Y(1)|D = 1] is the expected mean value in the outcome of the participants; and E[YEST(0)| D = 1] is the expected mean value in the outcome estimated by the counterfactual self-estimation method.
individual to report their outcome under both conditions of treatment and no treatment at the same time, there is no problem of selection bias. All individuals are in both the treatment and control groups. Rather than selection bias, the CSEPP method suff ers from what Mueller et al. (2014) refer to as self-estimation bias (SEB), which they formalise as
SEB = E[Y(0)| D = 1] – E[YEST(0)| D = 1], (2)
where SEB is the deviation of the true counterfactual due to overestimation or underestimation of the counterfactual by self-estimation.
Th e extent of SEB will depend on the decision-making process people use to estimate the counterfactual situation. Since the feasibility and validity of the CSEPP method rest on the ability of people to estimate the counterfactual situa-tion reliably and without bias, it is important to understand the cognitive processes involved in estimating the counter-factual situation in the LTC setting. We discuss these in the later section on estimating the counterfactual.
The ASCOT ‘expected’ method
ASCOT is a set of multi-attribute utility measures developed primarily for use in the evaluation of long-term care inter-ventions, which in the UK are mainly provided through the social care system (Netten et al., 2011; Netten et al., 2012a). Th e measures have two components: a standardised multi-attribute descriptive system for classifying states of social care-related quality of life (SCRQoL), and a scoring algo-rithm derived from people’s valuations of diff erent SCRQoL states (Netten et al., 2012a; Potoglou et al., 2011). Th e descriptive system for the service user version of ASCOT, with which we are concerned here, consists of eight QoL attributes that are relevant to the assessment of the impact of LTC (for more details of the descriptive system see Malley et al., 2012). Ratings for each attribute are obtained by self-report1 with users asked to evaluate their current QoL for each attribute, and respond using one of four response options, broadly capturing an ideal state in which all needs and preferences are met, a state of no need, some needs and high-level needs.
To estimate the impact of LTC interventions, the inter-view version of ASCOT (ASCOT-INT4), includes a further two questions, which we refer to as the ‘fi lter’ question and the ‘expected’ SCRQoL question. Figure 1 illustrates the question process for the control over daily life attribute. Th e respondent is asked about their ‘current’ situation and then to refl ect on whether the services that they are receiving aff ect that aspect of their life. If the answer is yes the follow-ing ‘expected’ question asks users to imagine their situation in the absence of services and, assuming no other forms of
1 Th ere is a version of ASCOT for use in care homes that triangulates evidence from an observational schedule, self-report and proxy-reports (see e.g. Netten et al., 2012b; Towers et al., 2016), but this version is not considered in this article.
help step in, evaluate their QoL in that situation. It provides an estimate of the counterfactual. Th e dignity attribute does not have an associated ‘expected’ question as it asks about people’s experience of the process of care, so in the absence of services the condition can be scored at the ‘no needs’ level.
Th ese questions were refi ned during the development of the measure to address two challenges associated with eval-uating the eff ect of LTC (Netten et al., 2012a). First, LTC interventions tend to be ‘tailored’ to meet the needs of the user, in terms both of the type and quantity of care provided. It is, therefore, important to defi ne the intervention in order to have clarity over the counterfactual (absence of the inter-vention) condition. Consequently, the ‘expected’ situation is described with reference to the current service package, which may comprise multiple components, by listing each component. Th e second challenge is the problem of substi-tution, in which alternatives for the intervention exist and are used in the control condition (Heckman & Smith, 1995). Th ere are many close substitutes for LTC interventions. For example, where a person receives a meals service, this aspect could be replaced by internet-based delivery companies. Other aspects of home care could be replaced with help from family and friends. Where respondents have knowledge of the availability of close substitutes they may assume they use these in the counterfactual situation, so leading to an under-estimate of the intervention eff ect. Th e issue is not that the counterfactual is no longer the ‘untreated’ condition (many controlled experiments compare the new intervention with the best existing alternative). Th e diffi culty is that the alter-native is neither homogeneous across individuals, nor is it articulated. For this reason, the ASCOT-INT4 includes instructions and prompts for respondents to assume that ‘no other help steps in’.
Th e parallels between the ‘current’ and ‘expected’ SCRQoL questions mean that (i) for each person a SCRQoL
gain score can be estimated for each question, (ii) the scoring algorithm can be applied to both the ‘current’ and ‘expected’ SCRQoL questions, and (iii) a SCRQoL gain utility score, which is equivalent to , can be generated by subtracting the ‘expected’ from the ‘current’ SCRQoL utility score. More for-mally, this can be expressed as,
(3)
where Ycurrent is the utility score for the current items, Yexpected is the utility score for the ‘expected’ items, and Ygain is the average gain in utility over the sample of people. Equation (3) is the equivalent of (1) expressed using ASCOT terminology.
what their QoL would have been like without LTC services. Although in the context of survey research it is unusual to ask people to imagine what their life would be like in a hypothetical situation, psychologists argue that counterfac-tual thinking is a common feature of our mental landscape (Roese & Olson, 1997). Th at counterfactual thinking is an everyday process and that most LTC interventions are of an ongoing nature support the credibility of this method for estimating eff ectiveness. Service users may have already imagined what their life would be like in the absence of the help and support upon which they rely; for example, in response to fears about care not being forthcoming because a care worker is delayed or because of cuts in public provi-sion. Th is provides us with a signifi cant advantage in the application of the CSEPP method to LTC compared to other settings.
Nevertheless, we must take seriously the problem of self-estimation bias (SEB). Th e cognitive processes involved in estimating the counterfactual situation are as follows:
1. To imagine a situation without the LTC intervention
2. To imagine that nothing else about your current situ-ation would change: i.e. that there is no substitution with close alternatives to the intervention.
3. To judge your SCRQoL in that imagined situation. 4. To rate SCRQoL at one of four ASCOT outcome
levels.
Th e diff erence between the ‘current’ and ‘expected’ ASCOT questions lies in the fi rst two steps; SEB may arise during these steps. By contrast, steps three and four are common to all evaluative questions, substituting ‘imag-ined’ for real. Th ey refl ect the processes through which respondents evaluate their QoL (real or imagined) and pro-vide an appropriate response – for which the challenges are well-rehearsed (see for example Schwartz & Rapkin, 2004; Schwartz & Sprangers, 1999).
Several questions therefore need to be addressed if we are to have confi dence in using the ‘expected’ method to esti-mate the eff ectiveness of interventions.
First, can LTC service users estimate their own
of the method and with understanding whether the method is suitable for all groups of LTC users. Previous in-depth work with small samples of older service users had explored their understanding of and capacity to answer the questions. This study sought to build on these findings with a larger sample including younger adults.
Second, does the ‘expected’ method provide a valid mea-sure of the counterfactual situation? In asking this question, we are particularly concerned with the construct validity of the ‘expected’ SCRQoL measure, in terms of whether it measures what it is intended to represent, which in this case is the QoL of the person in the counterfactual situation of the absence of services.
Third, does the ‘expected’ method produce unbiased esti-mates of the impact of LTC? This final question is critical to the interpretation of results and their validity.
Methods
We explored the three research questions using data from the study ‘Identifying the Impact of Adult Social Care’ (Forder et al., 2016). Th is study was designed to provide esti-. This study was designed to provide esti-mates of the impact of LTC interventions on ASCOT and is described in detail elsewhere (Forder et al., 2016). Here we focus on key details of the data collection, before providing details of the statistical analyses conducted to answer the three research questions.
Data collection
Twenty-two local authorities in England with adult social care responsibilities participated in the study. They identi-fied eligible participants from their care records and invited them to participate in the study. Criteria for study inclu-sion were receipt of publicly-funded community-based LTC services (e.g. home care), not in nursing or residential care, aged ≥18 years, having mental capacity to consent to and participate in the study, and a primary reason for support of physical disability/sensory impairment or mental health condition. A fieldwork organisation contacted respondents to arrange an interview either face-to-face or by telephone. In total, 770 face-to-face or telephone interviews were conducted between June 2013 and March 2014. Written or verbal informed consent was obtained before each inter-view. This study uses a sub-sample of 748 cases, excluding cases where someone answered all of the ASCOT questions on behalf of the respondent without consultation.
Participants completed a structured interview that included the ASCOT-INT4 instrument (Netten et al., 2011; Netten et al., 2012a). Th e interview also covered the respond-. The interview also covered the respond-ents’ understanding of the ‘expected’ questions, through two questions that asked respondents to rate on a five-point scale (i) how easy or difficult they found the ‘expected’ ques-tions overall, and (ii) how easy or difficult they found it to assume that no other help would step in. Interviewers were asked to rate on a five-point scale the degree to which the
respondent understood what s/he was being asked to do and how much consideration the respondent gave to answering the questions. The interviewers also recorded their general comments in a free-text field at the end of the interview.
We used an adapted version of a standardised set of ques-tions to capture information on functional ability (activities of daily living, ADLs, and IADLs (instrumental activities of daily living)) and receipt of formal and informal care and support2 (NatCen et al., 2010). These questions were asked
before the ASCOT questions so that their responses could be used in the ASCOT ‘expected’ questions to help respond-ents to imagine the counterfactual situation, in the absence of services. Additionally, the interview included socio-demographic and socio-economic questions (e.g. age, sex, educational attainment, household finances) and questions concerning health conditions, self-reported general health, suitability of home design, and accessibility of the local area. Respondents were also asked to rate whether they had expe-rienced a situation where they did not have LTC in the last 12 months.
A subset of the sample took part in follow-up interviews, with inclusion dependent on the primary care need being physical disability or sensory impairment. A total of 100 interviews were completed between two and 43 days after the initial interview (mean=10.3, SD=5.19). The follow-up interview included the ASCOT-INT4 with revised ‘expected’ questions that omitted the instruction to assume that ‘no other help would step in’. The respondents were asked after each ‘expected’ question whether they assumed help would step in or not; if yes, then to provide the assumed source(s) of help. The follow-up interview also included the same I/ ADL questions to assess functional ability and items to ask respondents to rate any perceived change in overall health, QoL or service receipt since the initial interview. This study uses a sub-sample of 96 cases, excluding cases where some-one answered all of the ASCOT questions on behalf of the respondent without consultation.
Ethical approval was obtained from the English Social Care Research Ethics Committee (12/IEC08/0049).
Statistical analysis
All analyses were conducted in Stata version 13. We used different analytical methods to assess each research ques-tion, as we detail below.
Feasibility
To assess the feasibility of the ‘expected’ method and answer the question of whether LTC service users can estimate
their own counterfactual, we examined missingness statis-tics for the ASCOT questions (‘current’ and ‘expected’) and descriptive statistics for the two self-assessed and two interviewer-assessed understanding of the ‘expected’ ques-tions items. To explore whether there were any differences in feasibility between groups of LTC users, we examined asso-ciations between these items about understanding of the ‘expected’ questions and selected individual characteristics using ordinal logistic regression.
In the models, we tested for associations between the feasibility questions and characteristics hypothesised to be associated with self-estimation bias (SEB). Characteristics included severity of disability (measured by being unable to complete alone the I/ADLs of washing hands and face, bathing, and completion of paperwork and bills), complex-ity of care (with four or more different types of service) and perceptions of household finances. All of these factors may make it more difficult – emotionally and/or conceptu-ally – to imagine the counterfactual situation. Additionconceptu-ally, we tested for associations with indicators of educational level and cognitive/intellectual impairment (completion of the interview with help and the IADL of completion of paperwork and bills, a predictor of early stages of demen-tia (Barberger-Gateau et al., 1993; De Lepeleire et al., 2004; Sikkes et al., 2011)), which may affect people’s ability to engage with the ‘expected’ questions. Since earlier work sug-gested that respondents who had experience of situations with no support may find it easier to answer the ‘expected’ questions (Rand et al., 2012), we tested for an association with the respondents’ report of whether they had experi-enced a situation without services in the last 12 months. We also explored whether the administration mode (telephone or face-to-face interview) affected the ability of respond-ents to complete and understand the ‘expected’ questions, because this may inform future applications of the method.
Given the importance of the instruction to assume that no help steps in, we explored how people responded to the questions when this instruction was omitted in the follow-up interviews as part of the feasibility analysis. We examined responses to the questions asking whether people assumed help would step in and, if so, who they assumed would pro-vide it. We also looked at whether respondents’ assumptions about help stepping in were associated with their responses to the ‘expected’ questions, using Fisher’s exact test due to small cell counts (Mehta & Patel, 1986).
Construct validity
To assess whether the ‘expected’ method provides a valid measure of the counterfactual situation, we tested the construct validity of the ‘expected’ score (Yexpected) as a measure of the QoL of the person in the absence of services. We assumed that the ‘expected’ score will have a strong (f2>.35) negative relationship with social care need (Cohen, 1988), such that the greater the social care need the lower a person’s ‘expected’ score. We therefore regressed Yexpected on
a set of social care need variables using OLS estimation. Since the purpose of social care assessment is to assess social care need, we drew on the criteria used by social workers when carrying out assessments to select variables for inclusion in the model. During assessment, social workers consider a person’s underlying health and disabling conditions (e.g. chronic illnesses, impairments and disability), immediate environment (e.g. layout of the home, distance to shops), and resources (e.g. monetary and social support networks that provide informal help) (Department of Health, 2010). Therefore, we included ability to complete and difficulty with I/ADLs, which is considered to be the core driver of need for LTC (Wanless et al., 2006), overall self-rated health, and physical or mental health conditions as indicators of underlying conditions. As indicators of the immediate envi-ronment, which may compound or alleviate underlying functional impairments (Shakespeare, 2017), we included variables capturing whether the home or local environ-ment limited the individual. As indicators of resources that may be drawn upon to meet needs and substitute for LTC (Netten & Davies, 1990), we included variables capturing the availability of financial resources, whether the person lived alone, and whether they received unpaid care. Survey-administration factors may be potential sources of response bias and may confound observed relationships, so variables capturing these characteristics (help to complete the survey, interview mode) were also considered for inclusion in the model. These were entered in a hierarchical manner into the statistical model in four theoretically-informed blocks. Model specification and goodness of fit tests were carried out and all were found to be satisfactory.
Comparing estimates of the impact of LTC
To address the question of whether the ‘expected’ method produces unbiased estimates of effectiveness, we compared the average treatment effect estimated by the ‘expected’ method with those obtained using a production function method on the same dataset. Based in the economic theory of production relations, production functions have been used to estimate the relationship between care outcomes and levels of treatment (hours of care) from observational data in order to provide estimates of the effectiveness of care services (Davies et al., 2000; Fernandez, 2005). The earlier applications address selection bias by controlling for observ-able differences in the needs-related characteristics of the sample. Forder et al. (2016; 2014), extend the method by applying a spatial lag strategy to specify instrumental vari-ables to tackle selection on unobservvari-ables (Jones & Rice, 2011). The details of this approach are outlined in Forder et al. (2016) and a more detailed technical exposition is given in Forder et al. (2018).
look at whether the differences between the two estimates of the treatment effect vary according to factors posited to influence SEB. These factors include: the person’s level of disability (I/ADLs), the complexity of the service package, receipt of unpaid help from family and friends, the potential availability of informal care from other people in the house-hold, household finances, help to complete the interview, educational level, experience of a situation without formal long-term care services in the past 12 months and mode of interview administration.
Results
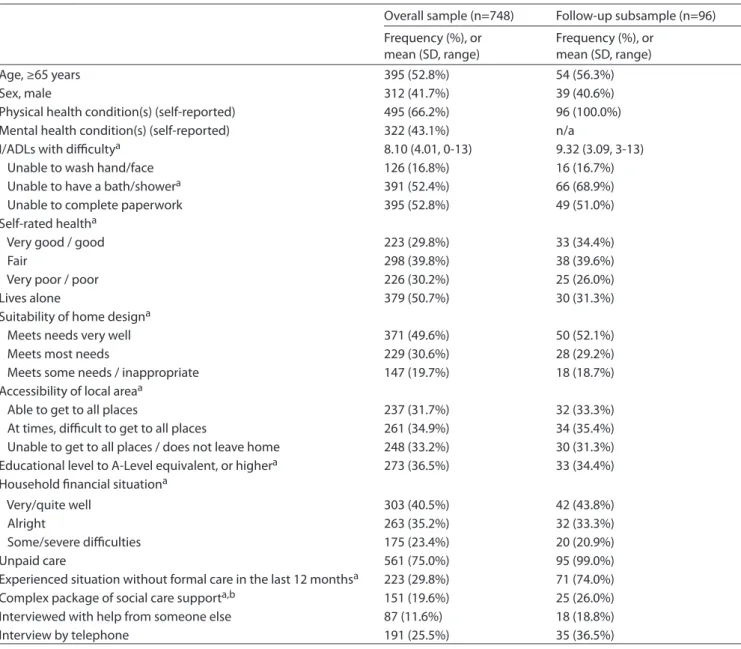
The sample characteristics are shown in table 1. The age, sex and overall health of the sample are as expected for a survey of social care users (Health and Social Care Information Centre, 2014). The follow-up subsample comprised only adults whose primary support reason was physical health conditions. All except one case received unpaid care from family or friends. The level of care needs in this subsample, as indicated by the number of I/ADLs undertaken with difficulty, was higher than the overall sample, with no cases finding difficulty with fewer than three I/ADLs.
Feasibility
Table 2 presents distributional statistics for the ‘current’ and ‘expected’ SCRQoL scores, overall and by attribute. While the overall ‘current’ score is positively skewed (mean=0.73, median=0.76), the overall ‘expected’ score is closer to a normal distribution (mean=0.34, median=0.32). There is a low proportion of missing values (all <1.0%) across the seven SCRQoL attributes where the respondent was asked to answer both ‘current’ and ‘expected’ questions.
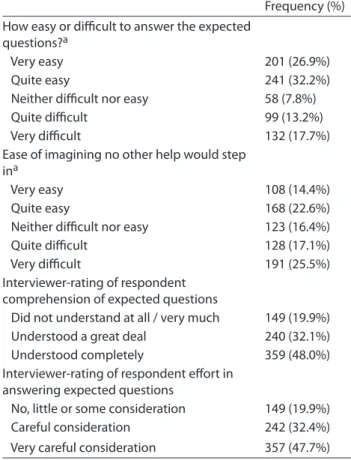
The self and interviewer ratings of the feasibility of the ‘expected’ questions are shown in table 3. Over half of the respondents reported that it was very or quite easy to answer the ‘expected’ questions. Interviewers rated that the major-ity of respondents understood the questions completely or a great deal, and gave the questions very careful or careful consideration. These positive findings were reflected in the comments provided by the interviewers. For example, com-ments included: ‘no problems with hypotheticals’, ‘able to imagine the hypotheticals well’, ‘seemed to find it very easy to imagine’. One interviewer also noted that ‘the respondent was able to imagine her situation of help was not available because of being in that situation in the past’, suggesting that experience may be valuable for imagining the counterfactual situation.
Although interviewers generally recorded positive expe-riences, they did note some problems. A few people needed the questions to be repeated, and some people with men-tal health conditions felt that the fluctuating nature of their condition made it difficult to answer the questions. They did not want to imply that their support had little impact on their QoL by evaluating the counterfactual situation in the
present when they felt well.
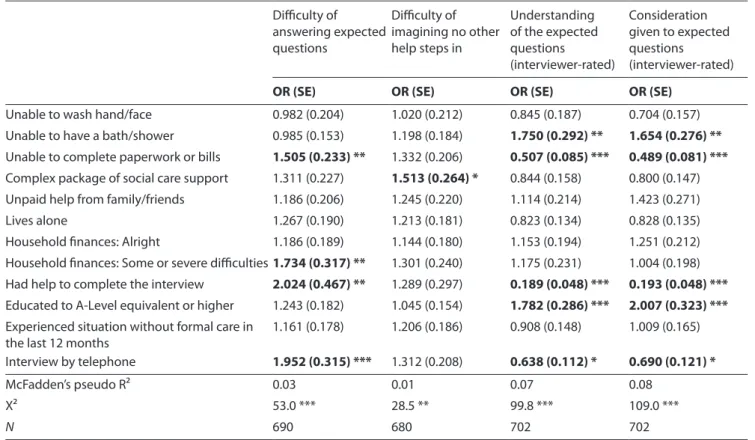
The characteristics influencing the feasibility of the ‘expected’ questions were systematically explored in ordi-nal logistic regressions, which are shown in table 4. Despite differences in the wording of the self-reported and inter-viewer-reported feasibility questions, there was some agreement on the characteristics associated with feasibility. Across the three questions pertaining to the feasibility of the ‘expected’ questions as a whole, administration of the sur-vey by telephone rather than face-to-face interview, poorer cognitive ability (as assessed through the difficulty with the IADL of paperwork and bills), and help to complete the interview were all significantly associated with lower self- or interviewer-reported feasibility in answering the ‘expected’ questions. The complexity of the care package, availability and receipt of informal care, experience of being without formal support and being unable to wash their face and hands were not associated with feasibility.
There were some differences, however, between the self-reported and the interviewer-self-reported questions in the characteristics that were associated with feasibility of the ‘expected’ questions. Respondents’ perceptions of finan-cial difficulties were significantly associated with greater self-reported difficulty in answering the ‘expected’ ques-tions. Higher educational attainment and the respondent being unable to bathe him/herself were both significantly associated with interviewer ratings of respondents having a better understanding of the questions and giving them more consideration.
From the comments recorded by the interviewers, the most difficult aspect of the ‘expected’ questions appeared to be related to imagining the counterfactual state under the constraint that no other help would step in. This is reflected in the survey responses, where approximately two-fifths of respondents reported that they found it very or quite easy to imagine no other help would step in. The comments sug-gested that the difficulty was related to an unwillingness, rather than an inability, to imagine themselves in the coun-terfactual situation due to their degree of dependence on services. Interviewers commented that the ‘expected’ ques-tions elicited responses such as ‘I don’t think my family would let me starve would they?’. Analysis of the character-istics associated with self-reported difficulty in assuming no other help would step in lends some support to this interpre-tation, as difficulty with this aspect of the ‘expected’ method was only significantly related to the complexity of the care package.
would make my own wheelchair out of spare parts’!
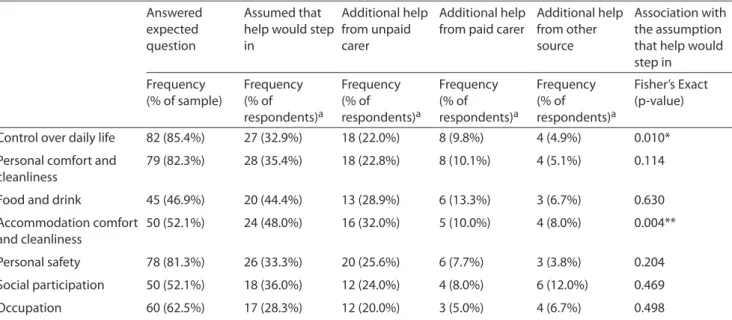
The results from the follow-up interviews, in which the ‘expected’ questions did not include the prompt to assume that no other help would step in, are shown in table 5. Of the service users who completed the ‘expected’ questions, a large proportion based their response on a counterfactual situation that assumed someone would step in to help them if existing sources of formal support were no longer avail-able. Most commonly, service users assumed that unpaid carers would provide additional support in the ‘expected’ situation. Less frequently, they assumed that paid care or other paid or unpaid sources of help, such as volunteers or cleaners, would substitute for publicly-funded formal care.
Importantly, ratings of expected control over daily life and accommodation were significantly associated with whether or not the respondent assumed someone else would step in. Respondents who said they assumed no other help would step in were more likely to rate high-level needs in these two attributes in the counterfactual situation compared to respondents who assumed someone else would help. A sim-ilar pattern of response was observed across the six other attributes, but the associations did not reach significance at the 5% level.
Table 1. Sample characteristics
Overall sample (n=748) Follow-up subsample (n=96) Frequency (%), or
mean (SD, range)
Frequency (%), or mean (SD, range)
Age, ≥65 years 395 (52.8%) 54 (56.3%)
Sex, male 312 (41.7%) 39 (40.6%)
Physical health condition(s) (self-reported) 495 (66.2%) 96 (100.0%) Mental health condition(s) (self-reported) 322 (43.1%) n/a
I/ADLs with difficultya 8.10 (4.01, 0-13) 9.32 (3.09, 3-13)
Unable to wash hand/face 126 (16.8%) 16 (16.7%)
Unable to have a bath/showera 391 (52.4%) 66 (68.9%)
Unable to complete paperwork 395 (52.8%) 49 (51.0%)
Self-rated healtha
Very good / good 223 (29.8%) 33 (34.4%)
Fair 298 (39.8%) 38 (39.6%)
Very poor / poor 226 (30.2%) 25 (26.0%)
Lives alone 379 (50.7%) 30 (31.3%)
Suitability of home designa
Meets needs very well 371 (49.6%) 50 (52.1%)
Meets most needs 229 (30.6%) 28 (29.2%)
Meets some needs / inappropriate 147 (19.7%) 18 (18.7%)
Accessibility of local areaa
Able to get to all places 237 (31.7%) 32 (33.3%)
At times, difficult to get to all places 261 (34.9%) 34 (35.4%) Unable to get to all places / does not leave home 248 (33.2%) 30 (31.3%) Educational level to A-Level equivalent, or highera 273 (36.5%) 33 (34.4%)
Household financial situationa
Very/quite well 303 (40.5%) 42 (43.8%)
Alright 263 (35.2%) 32 (33.3%)
Some/severe difficulties 175 (23.4%) 20 (20.9%)
Unpaid care 561 (75.0%) 95 (99.0%)
Experienced situation without formal care in the last 12 monthsa 223 (29.8%) 71 (74.0%)
Complex package of social care supporta,b 151 (19.6%) 25 (26.0%)
Interviewed with help from someone else 87 (11.6%) 18 (18.8%)
Interview by telephone 191 (25.5%) 35 (36.5%)
a Missing values (overall sample): I/ADLs with difficulty (64); Unable to have a bath/shower (2); Self-rated health (1); Suitability of home design (1); accessibility of local area (2); Educational level (5); Household financial situation (7); Experienced situation without formal care in last 12 months (21); Complex package of social care support (13).
Missing values (follow-up subsample): I/ADLs with difficulty (12); Unable to have a bath/shower (1); Household financial situation (2); Experienced situation without formal care in last 12 months (4); Complex package of social care support (2).
Construct validity
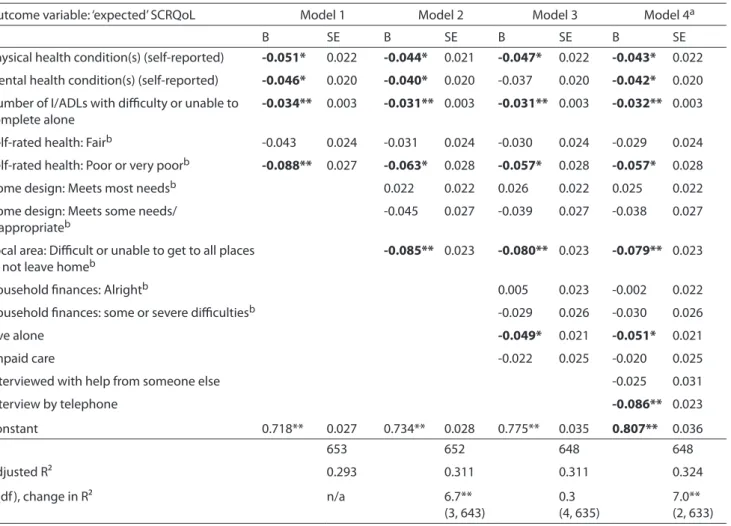
Table 6 presents the results of the hierarchical OLS regres-sion of factors associated with ‘expected’ SCRQoL score. At least one variable from each of the groups of factors was significantly associated with ‘expected’ SCRQoL and Cohen’s f2 for all models was >.35, providing good evidence for construct validity. Self-reported physical and mental
health conditions, the I/ADL score, and poor or very poor self-rated health were all significantly associated with worse ‘expected’ SCRQoL from the set of underlying health and disabling conditions indicators. Of the immediate environ-ment set of variables, the rating of local area accessibility was significantly negatively associated with ‘expected’ SCRQoL. Whether the person lived alone, which can be conceptualised Table 2. ASCOT social care-related quality of life (n=748)
SCRQoL
Frequency (%), or mean (SD, range) Expected SCRQoL Frequency (%), or mean (SD, range) Social care-related quality of life 0.73 (0.21, -0.13 to 1.00) 0.34 (0.29, -0.09 to 0.96)
Missing 11 (1.5%) 18 (2.4%)
Control over daily life
Ideal state 208 (27.8%) 69 (9.2%)
No needs 264 (35.3%) 71 (9.5%)
Some needs 219 (29.3%) 236 (31.6%)
High needs 55 (7.4%) 370 (49.5%)
Missing 2 (0.2%) 2 (0.2%)
Personal comfort and cleanliness
Ideal state 422 (56.4%) 156 (20.9%)
No needs 267 (35.7%) 126 (16.8%)
Some needs 49 (6.6%) 199 (26.6%)
High needs 9 (1.2%) 266 (35.6%)
Missing 1 (0.1%) 1 (0.1%)
Food and drink
Ideal state 522 (69.8%) 288 (38.5%)
No needs 171 (22.9%) 123 (16.4%)
Some needs 36 (4.8%) 118 (15.8%)
High needs 16 (2.1%) 216 (28.9%)
Missing 3 (0.4%) 3 (0.4%)
Accommodation comfort and cleanliness
Ideal state 449 (60.0%) 219 (29.3%)
No needs 224 (30.0%) 143 (19.1%)
Some needs 63 (8.4%) 156 (20.9%)
High needs 12 (1.6%) 230 (30.7%)
Missing 0 (0%) 0 (0%)
Personal safety
Ideal state 387 (51.8%) 133 (17.8%)
No needs 248 (33.2%) 157 (21.0%)
Some needs 81 (10.8%) 161 (21.5%)
High needs 31 (4.1%) 296 (39.6%)
Missing 1 (0.1%) 1 (0.1%)
Social participation and involvement
Ideal state 249 (33.3%) 134 (17.9%)
No needs 207 (27.7%) 136 (18.2%)
Some needs 188 (25.1%) 189 (25.3%)
High needs 104 (13.9%) 285 (38.1%)
Missing 0 (0%) 4 (0.5%)
Occupation (‘doing things I value and enjoy’)
Ideal state 188 (25.1%) 107 (14.3%)
No needs 200 (26.7%) 109 (14.6%)
Some needs 284 (38%) 271 (36.2%)
High needs 74 (9.9%) 255 (34.1%)
Table 3. Self-rated or interviewer-rated feasibility of expected SCRQoL questions (n=748)
Frequency (%) How easy or difficult to answer the expected
questions?a
Very easy 201 (26.9%)
Quite easy 241 (32.2%)
Neither difficult nor easy 58 (7.8%)
Quite difficult 99 (13.2%)
Very difficult 132 (17.7%)
Ease of imagining no other help would step ina
Very easy 108 (14.4%)
Quite easy 168 (22.6%)
Neither difficult nor easy 123 (16.4%)
Quite difficult 128 (17.1%)
Very difficult 191 (25.5%)
Interviewer-rating of respondent comprehension of expected questions
Did not understand at all / very much 149 (19.9%) Understood a great deal 240 (32.1%) Understood completely 359 (48.0%) Interviewer-rating of respondent effort in
answering expected questions
No, little or some consideration 149 (19.9%) Careful consideration 242 (32.4%) Very careful consideration 357 (47.7%)
a Missing values: Ease or difficulty of answering expected questions (17); Ease of imagining no other help would step in (30).
as an indicator of the availability of unpaid care, was signifi-cantly negatively associated with ‘expected’ SCRQoL from the set of resources indicators. Finally, from the survey administration variables, the respondents who completed the interview by telephone had significantly lower ratings of ‘expected’ SCRQoL. In the final model, as anticipated, by far the most important variable for predicting ‘expected’ SCRQoL was the I/ADL indicator of functional ability.
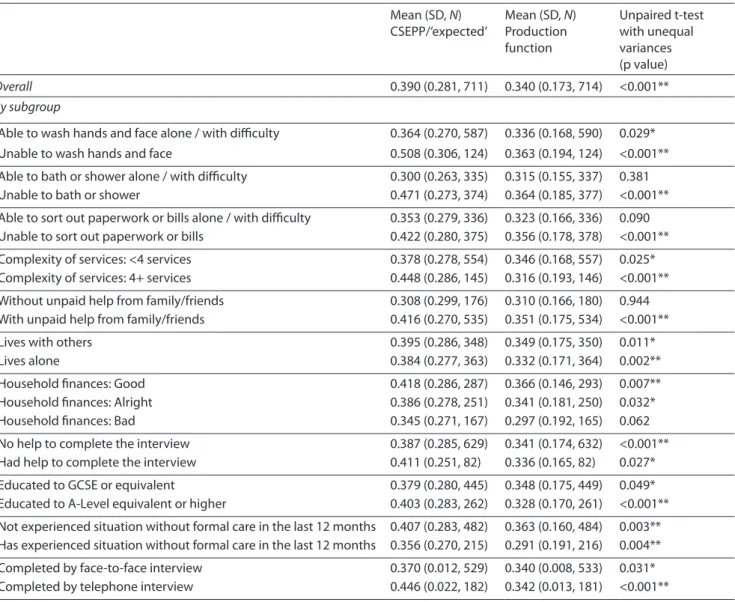
Comparing estimates of the impact of LTC
Estimates of the treatment effect from both the ‘expected’ and the production function methods are shown in in table 7. The treatment effect estimates are close in value overall: 0.39 for the ‘expected’ method compared with 0.34 for the production function approach. However, this is a statistically significant difference suggesting that either the production function approach underestimates the impact of services or that in the ‘expected’ approach people overestimate the effect of the absence of services on their QoL. Interestingly, the magnitude of the difference between the treatment effects estimated by the two methods varies by sub-group. Differences between the methods are greater than average where people were unable to undertake various I/ADLs, had a complex service package, had an informal carer, had higher educational attainment, or completed the survey by tele-phone. By contrast, the magnitude of differences are much
smaller (in some cases close to zero) and often statistically insignificant where people were able to undertake various I/ ADLs, had a less complex service package, had no informal carer, had lower educational attainment, or completed the survey by face-to-face interview.
Discussion
The ‘expected’ method is a novel approach for evaluating LTC interventions. It seeks to solve a crucial evaluation problem by asking individuals receiving the intervention to imagine their own counterfactual in the absence of the intervention, and estimate what their situation would be like in that coun-terfactual situation. The difference between their imagined situation in the absence of the intervention and their actual situation provides an estimate of the effect of the interven-tion. Previous work with small samples had explored older service users’ understanding of the questions and rele-vance of their responses. The purpose of the present study was to investigate with a larger and more diverse sample (i) whether LTC service users can estimate their own counter-factual, (ii) whether the ‘expected’ method provides a valid measure of the counterfactual situation, and (iii) whether the ‘expected’ method produces unbiased estimates of the impact of LTC. In addressing these questions, this study has expanded on the investigation by Netten et al. (2012a) of the feasibility of the ‘expected’ method by exploring comple-tion rates for the ‘expected’ quescomple-tions, and self-reported and interviewer-reported comprehension of the ‘expected’ ques-tions. This study is the first to explore, in the LTC context, the validity of the counterfactual outcome score produced using the ‘expected’ method and to compare the treatment effect estimated by the ‘expected’ method to estimates using an alternative method.
Overall, the evidence presented confirms previous find-ings about the feasibility of the ‘expected’ questions and suggests that many LTC service users are able to estimate their own counterfactual. The ‘expected’ questions had good response rates, and respondents and interviewers both reported that the questions were in general answered well. In addition, the ‘expected’ ASCOT score (i.e. for the coun-terfactual situation) had good construct validity. Regression analysis uncovered the anticipated relationships with the three groups of indicators of need for LTC support (underly-ing health and disabl(underly-ing conditions, immediate environment and resources available to meet needs) and a particularly strong relationship with functional (I/ADL) ability. This study, therefore, provides good support for the feasibility of the ‘expected’ method and the validity of self-estimated counterfactual outcome scores.
Table 4. Ordinal logistic regressions
Difficulty of answering expected questions
Difficulty of imagining no other help steps in
Understanding of the expected questions (interviewer-rated)
Consideration given to expected questions (interviewer-rated)
OR (SE) OR (SE) OR (SE) OR (SE)
Unable to wash hand/face 0.982 (0.204) 1.020 (0.212) 0.845 (0.187) 0.704 (0.157) Unable to have a bath/shower 0.985 (0.153) 1.198 (0.184) 1.750 (0.292) ** 1.654 (0.276) ** Unable to complete paperwork or bills 1.505 (0.233) ** 1.332 (0.206) 0.507 (0.085) *** 0.489 (0.081) *** Complex package of social care support 1.311 (0.227) 1.513 (0.264) * 0.844 (0.158) 0.800 (0.147) Unpaid help from family/friends 1.186 (0.206) 1.245 (0.220) 1.114 (0.214) 1.423 (0.271)
Lives alone 1.267 (0.190) 1.213 (0.181) 0.823 (0.134) 0.828 (0.135)
Household finances: Alright 1.186 (0.189) 1.144 (0.180) 1.153 (0.194) 1.251 (0.212) Household finances: Some or severe difficulties1.734 (0.317) ** 1.301 (0.240) 1.175 (0.231) 1.004 (0.198) Had help to complete the interview 2.024 (0.467) ** 1.289 (0.297) 0.189 (0.048) *** 0.193 (0.048) *** Educated to A-Level equivalent or higher 1.243 (0.182) 1.045 (0.154) 1.782 (0.286) *** 2.007 (0.323) *** Experienced situation without formal care in
the last 12 months 1.161 (0.178) 1.206 (0.186) 0.908 (0.148) 1.009 (0.165) Interview by telephone 1.952 (0.315) *** 1.312 (0.208) 0.638 (0.112) * 0.690 (0.121) *
McFadden’s pseudo R² 0.03 0.01 0.07 0.08
Χ² 53.0 *** 28.5 ** 99.8 *** 109.0 ***
N 690 680 702 702
*p<0.05, **p<0.01, ***p<0.001
This is not surprising as answering any structured question is likely to be more difficult for this group of people and the hypothetical nature of the question is particularly challeng-ing. The study also raised questions about the feasibility of using a telephone interview to administer the method, as this mode of administration was similarly associated with poorer self-reported and interviewer-reported feasibility of the ‘expected’ questions. Additionally, there is the sugges-tion from interviewers’ recorded comments that those with fluctuating mental health conditions may find the questions more difficult. It would be helpful to explore the relation-ship between these aspects and feasibility further, to gain a better understanding of the applicability of the ‘expected’ method to different groups of LTC users. In any such study it would also be helpful to include questions establishing how difficult respondents found it to respond to other ques-tions to provide a baseline comparison for the difficulty of the ‘expected’ items.
A further point of interest was the differences in the characteristics of users that explained user- and interviewer-assessed feasibility of the ‘expected’ questions. This could be explained by differences in the perspectives of service users and interviewers. Interviewers are likely to use cues that signal mental effort and confusion, which may explain the relationship between interviewer ratings of feasibility and educational attainment, as people with lower educational attainment are known to need text with lower readability scores and less abstract questions (Holbrook et al., 2006). By
contrast, perceived acceptability of the counterfactual situa-tion was an important considerasitua-tion for service users. This may explain the association between self-reported difficulty with the ‘expected’ questions and perceptions of house-hold finances, as those with financial difficulty have fewer resources available to address the situation by other means and are consequently more dependent on the public provi-sion of services.
A central concern with the CSEPP/‘expected’ method is the possibility that estimates suffer from self-estimation bias (SEB) (Mueller & Gaus, 2015; Mueller et al., 2014). One interpretation of the statistically significant difference in the treatment effect estimates from the between-methods com-parison is that SEB is present in the ‘expected’ estimates. If this interpretation is correct then analysis of the differences in the estimates by sub-group suggested that SEB, which manifests itself as over-estimation of the effect of LTC, may be greatest where people are unable to complete various I/ ADLs, have a complex service package, have an informal carer, have higher educational attainment, or are inter-viewed by telephone.
Table 5. Follow-up interviews (n=96)
Answered expected question
Assumed that help would step in
Additional help from unpaid carer
Additional help from paid carer
Additional help from other source
Association with the assumption that help would step in
Frequency
(% of sample) Frequency (% of respondents)a
Frequency (% of respondents)a
Frequency (% of respondents)a
Frequency (% of respondents)a
Fisher’s Exact (p-value)
Control over daily life 82 (85.4%) 27 (32.9%) 18 (22.0%) 8 (9.8%) 4 (4.9%) 0.010* Personal comfort and
cleanliness
79 (82.3%) 28 (35.4%) 18 (22.8%) 8 (10.1%) 4 (5.1%) 0.114
Food and drink 45 (46.9%) 20 (44.4%) 13 (28.9%) 6 (13.3%) 3 (6.7%) 0.630 Accommodation comfort
and cleanliness
50 (52.1%) 24 (48.0%) 16 (32.0%) 5 (10.0%) 4 (8.0%) 0.004**
Personal safety 78 (81.3%) 26 (33.3%) 20 (25.6%) 6 (7.7%) 3 (3.8%) 0.204 Social participation 50 (52.1%) 18 (36.0%) 12 (24.0%) 4 (8.0%) 6 (12.0%) 0.469 Occupation 60 (62.5%) 17 (28.3%) 12 (20.0%) 3 (5.0%) 4 (6.7%) 0.498
a Missing values: Control over daily life (2); Personal comfort and cleanliness (1); Food and drink (1); Personal safety (1); Social participation (3); Occupation (3).
*p<0.05, ** p<0.01
status is associated with problems with the ‘expected’ ques-tions (as judged by the interviewer) but with a smaller difference in the estimates of the average treatment effect from the two methods. It is not clear whether there is a relationship between self-judged or interviewer-judged feasibility of the ‘expected’ questions and SEB. There is, how-ever, some suggestion from interviewers’ comments that, where respondents were initially unwilling to imagine the counterfactual situation, there may be a degree of SEB.
Strengths and limitations of the study
A strength of this study was the ability to investigate the performance of the ‘expected’ method in LTC from a variety of perspectives. Nevertheless, the opportunistic nature of the study meant there were limitations in the methods used, which means there is some uncertainty around the study conclusions. There was limited information about mental health and no information on attitudes and personality, meaning it was not possible to investigate the impact of such factors on self-estimation bias. This could be an important omission as we might well expect people with depression, particularly long-term depression, to envisage a different counterfactual to others in the same situation. Moreover, since respondents chose whether to have a telephone or face-to-face interview, there is likely to be selection bias in the estimate of the effect of mode of administration on ratings of feasibility. Although we controlled for needs-related factors that are likely to be associated with this choice, it is possible that unobserved differences in the characteristics of people choosing the telephone and face-to-face modes explain the observed differences in perceptions of feasibility. More data about respondents’ problems in answering structured
questions in general would also provide a useful baseline for interpreting reported difficulties with the ‘expected’ ques-tions. This might provide useful insight into the greater divergence in estimated outcomes for people who have higher levels of need.
Th e most important methods limitation relates to the assumption underlying the between-methods compari-son: namely, that the production function method delivers largely unbiased estimates of the effect of LTC and, there-fore, represents a robust benchmark for the ‘expected’ estimate. The validity of this assumption depends on how well the statistical model controls for selection bias on observable and unobservable confounders. In the produc-tion funcproduc-tion approach, the latter is addressed through the instrumental variables estimation of the intensity of service input and the former through controlling for the types of needs-related characteristics already mentioned, i.e. under-lying conditions, immediate environment, and resources. If the instrumental variables estimation fails to fully account for unobserved confounders then the model will underes-timate the impact of LTC for this population. It is arguable that this may be most relevant for those with the highest and most complex needs. Either explanation – failure to fully account for selection bias or SEB – could account for the small difference in estimates of the treatment effect.
Table 6. Hierarchical regression analysis
Outcome variable: ‘expected’ SCRQoL Model 1 Model 2 Model 3 Model 4a
B SE B SE B SE B SE
Physical health condition(s) (self-reported) -0.051* 0.022 -0.044* 0.021 -0.047* 0.022 -0.043* 0.022 Mental health condition(s) (self-reported) -0.046* 0.020 -0.040* 0.020 -0.037 0.020 -0.042* 0.020 Number of I/ADLs with difficulty or unable to
complete alone -0.034**
0.003 -0.031** 0.003 -0.031** 0.003 -0.032** 0.003
Self-rated health: Fairb -0.043 0.024 -0.031 0.024 -0.030 0.024 -0.029 0.024
Self-rated health: Poor or very poorb -0.088** 0.027 -0.063* 0.028 -0.057* 0.028 -0.057* 0.028
Home design: Meets most needsb 0.022 0.022 0.026 0.022 0.025 0.022
Home design: Meets some needs/
inappropriateb -0.045 0.027 -0.039 0.027 -0.038 0.027
Local area: Difficult or unable to get to all places
or not leave homeb -0.085** 0.023 -0.080** 0.023 -0.079** 0.023
Household finances: Alrightb 0.005 0.023 -0.002 0.022
Household finances: some or severe difficultiesb -0.029 0.026 -0.030 0.026
Live alone -0.049* 0.021 -0.051* 0.021
Unpaid care -0.022 0.025 -0.020 0.025
Interviewed with help from someone else -0.025 0.031
Interview by telephone -0.086** 0.023
Constant 0.718** 0.027 0.734** 0.028 0.775** 0.035 0.807** 0.036
N 653 652 648 648
Adjusted R² 0.293 0.311 0.311 0.324
F (df), change in R² n/a 6.7**
(3, 643)
0.3 (4, 635)
7.0** (2, 633)
a The variance of the residuals is homogenous (Cook-Weisberg test for heteroskedasticity (X²(1) = 0.04, p=0.846). The Ramsey-Reset test suggests no evidence of omitted variable bias or functional form misspecification (F(3,630)=1.30, p=0.278)). The Link test also indicates that the model is adequately specified (hat² = 0.485, p=0.07).
b Base category: Health, good or very good; home design, meets needs very well; accessibility of local area, able to get to all areas; household finances, very or quite well.
*p<0.05; ** p<0.01
reaction to the thought of losing services on which they are highly dependent – a constant concern given the tight-ening of eligibility criteria to address demand pressures (Fernandez et al., 2013). In the case of those with support from family and/or friends, they may attribute some of the input from these unpaid carers to formal care services, hence the overestimate. Educational attainment is a socio-economic indicator and may be capturing people who are purchasing some of their care through private means. The ‘expected’ method, as it was implemented in this study, did not ask respondents to distinguish between sources of fund-ing, so the impact of care is likely to include the effect of both privately and publicly-funded care services. An alter-native explanation is that these are groups of LTC users for whom the production function method fails to completely address selection bias. This is an equally plausible explana-tion given the difficulty of estimating outcomes for those with the greatest levels of need (Davies et al., 2000; Forder et al., 2014; Malley, 2017).
Table 7. Comparison of effectiveness estimates between the CSEPP/‘expected’ and production function methods
Mean (SD, N) CSEPP/‘expected’
Mean (SD, N) Production function
Unpaired t-test with unequal variances (p value)
Overall 0.390 (0.281, 711) 0.340 (0.173, 714) <0.001**
By subgroup
Able to wash hands and face alone / with difficulty 0.364 (0.270, 587) 0.336 (0.168, 590) 0.029* Unable to wash hands and face 0.508 (0.306, 124) 0.363 (0.194, 124) <0.001** Able to bath or shower alone / with difficulty 0.300 (0.263, 335) 0.315 (0.155, 337) 0.381 Unable to bath or shower 0.471 (0.273, 374) 0.364 (0.185, 377) <0.001** Able to sort out paperwork or bills alone / with difficulty 0.353 (0.279, 336) 0.323 (0.166, 336) 0.090 Unable to sort out paperwork or bills 0.422 (0.280, 375) 0.356 (0.178, 378) <0.001** Complexity of services: <4 services 0.378 (0.278, 554) 0.346 (0.168, 557) 0.025* Complexity of services: 4+ services 0.448 (0.286, 145) 0.316 (0.193, 146) <0.001** Without unpaid help from family/friends 0.308 (0.299, 176) 0.310 (0.166, 180) 0.944 With unpaid help from family/friends 0.416 (0.270, 535) 0.351 (0.175, 534) <0.001**
Lives with others 0.395 (0.286, 348) 0.349 (0.175, 350) 0.011*
Lives alone 0.384 (0.277, 363) 0.332 (0.171, 364) 0.002**
Household finances: Good 0.418 (0.286, 287) 0.366 (0.146, 293) 0.007** Household finances: Alright 0.386 (0.278, 251) 0.341 (0.181, 250) 0.032* Household finances: Bad 0.345 (0.271, 167) 0.297 (0.192, 165) 0.062 No help to complete the interview 0.387 (0.285, 629) 0.341 (0.174, 632) <0.001** Had help to complete the interview 0.411 (0.251, 82) 0.336 (0.165, 82) 0.027* Educated to GCSE or equivalent 0.379 (0.280, 445) 0.348 (0.175, 449) 0.049* Educated to A-Level equivalent or higher 0.403 (0.283, 262) 0.328 (0.170, 261) <0.001** Not experienced situation without formal care in the last 12 months 0.407 (0.283, 482) 0.363 (0.160, 484) 0.003** Has experienced situation without formal care in the last 12 months 0.356 (0.270, 215) 0.291 (0.191, 216) 0.004** Completed by face-to-face interview 0.370 (0.012, 529) 0.340 (0.008, 533) 0.031* Completed by telephone interview 0.446 (0.022, 182) 0.342 (0.013, 181) <0.001**
*p<0.05; ** p<0.01
There is, however, some uncertainty around the effect of the instruction to assume no help steps in. This was the aspect of the method that presented most problems to respondents, but there were limitations to our ability to investigate the impact of this due to the non-experimental design of this element of the follow-up study, and small numbers. The lat-ter limitation meant we could not control for differences in observed characteristics of those who chose to assume that help stepped in and those who chose not to make this assumption. Randomisation of people to questionnaires with and without the instruction about help stepping in could address the limitation of this study and provide better evidence about the role of substitution on estimates of the treatment effect derived using the ‘expected’ method.
Reflections on the ‘expected’ method and future directions
Evaluation of outcomes is particularly challenging in LTC, giving greater force to the arguments in favour of the CSEPP/‘expected’ method given by Mueller et al.
know what works for whom and to what extent to help guide the allocation of finite resources.
A number of questions remain about the ‘expected’ method. First, there is evidence from this study that the question instructions may influence how people construct their counterfactual. More careful exploration of how var-iations in the instructions affect the counterfactual rating and the sensitivity of estimates of the treatment effect to such differences is warranted, including the problems asso-ciated with and methodological implications of assuming no other help would step in. Second, further investigation is needed of how mental health (in particular long-term depression), attitude and personality affect people’s ratings of the counterfactual. Third, the literature around counter-factual thinking suggests that the emotional significance of an issue affects counterfactual thinking (Mandel et al., 2007; Roese & Olson, 1997). There is evidence from this study that the counterfactual situation was emotionally charged for a number of participants. A more detailed examination of how the emotional significance of the counterfactual situa-tion affects people’s ability to engage with the quessitua-tions and their responses would be beneficial. Fourth, there appeared to be differences in the feasibility of the ‘expected’ method depending on the mode of administration of the survey. Future research should investigate the suitability of tele-phone administration for the ‘expected’ method.
Finally, we have only been able to investigate SEB in a limited way in this study, by exploring the factors influ-encing feasibility of the ‘expected’ questions and whether the difference between the ‘expected’ method and produc-tion funcproduc-tion method estimates for the effect of LTC differ according to sub-groups of the population. The findings from this aspect of the study are not conclusive given that perceptions of infeasibility may not lead to SEB and that the treatment effect estimates from the production func-tion method may also be subject to selecfunc-tion bias. Despite this, the comparison with the production function method is still useful as it is often the only feasible option in the LTC context (Byford & Sefton, 2003; Forder et al., 2014) and is a well-established method in the econometric liter-ature (Angrist et al., 1996; Newhouse & McClellan, 1998). Future applications of the CSEPP/‘expected’ method should attempt to determine the extent of SEB and to investigate its determinants (Mueller & Gaus, 2015). In the LTC set-(Mueller & Gaus, 2015). In the LTC set-. In the LTC set-ting we speculate that SEB may arise from three sources: systematic differences between individuals in the aspects of the LTC intervention they exclude from the counterfactual situation; systematic differences between individuals in the assumptions they make about substitutionfor current formal services with other forms of provision; and systematic dif-ferences in the length of time people imagine themselves in
the counterfactual situation without services. This study iden-tified some groups of service users for whom SEB may be an issue. It may be possible to explore SEB further among such groups of service users using verbal protocol analysis to uncover the strategies that people use to construct their counterfactual situation (Ericsson & Simon, 1980, 1993). Our previous research suggests that such an approach would be feasible with LTC users (Netten et al., 2012a). Comparison of the estimates from the ‘expected’ method with a more robust benchmark would also enable a more detailed investigation of SEB.
Conclusion
Overall, the evidence suggests that the CSEPP/‘expected’ method, as implemented within ASCOT, could be a useful tool for use in LTC. It is an easy-to-implement method that can be used to generate results quickly. Importantly, the results from this study suggest that the ‘expected’ method produces estimates of effectiveness of LTC that are plausible and provide relevant inferences for policy development, when compared with the available alternative. Although a promising method, the potential for bias and, in partic-ular, over-estimation of the effect of LTC services means that evidence about the effectiveness of interventions obtained using the ‘expected’ method should be supported by evidence from other studies conducted using alternative research designs. Further work is needed to investigate the impact of factors such as depression and other fluctuating needs, attitude and personality as this might suggest the need to routinely include questions that could assist in interpreta-tion of responses. Nevertheless, the ‘expected’ method may be particularly useful for small-scale, exploratory studies that seek primary evidence about the effectiveness of LTC interventions.