VOLUME 15 ISSUE 3 (2017), Page 77 – 92
SIX YEARS (1999-2015) OF ESCALATING HOUSE PRICE: CAN FDI BE BLAMED?
Ema Izati Zull1, & Tajul Ariffin Masron2
1,2School of Management
UNIVERSITI SAINS MALAYSIA
Abstract
In Malaysia, house price has increased drastically. Problem arises in areas that received relatively lower number of FDI. The house price in these areas accelerated at growth which are somewhat equivalent to areas which benefit from FDI spillover. As the relationship between FDI and locals’ well-being is becoming crucial due to the escalating high price, this paper intends to examine the long-term impact of FDI on house price in Malaysia. Our long-run estimation results showed that FDI inflows have affected house price in Malaysia negatively between the period of 1999 and 2015. The effect however reversed when liberalization policy is included. With the presence of liberalization policy, FDI inflows have actually caused house price in KL and Penang (highly dynamic states) to increase in the long-run. The positive effect of FDI inflows on house price are also found in relatively slow-progressive states like Pahang and Kedah confirming the nationwide effect of liberalization policy regardless of economy level of a state. Other than FDI inflows, this study also examined house supply, gross domestic per capita and interest rate as independent variables.
Keywords: House price, FDI inflows, liberalization, Malaysia, Johansen
Cointegration Test
INTRODUCTION
In many parts of the world, house price has increased by more than 50% between year 2000 and 2015 (IMF, 2015). Out of 64 countries, 67% recorded increase in house price in the first quarter of 2015. Joining the list are developing countries from Asia such as Malaysia, Thailand and the Philippines. The trend indicates that global housing market is booming and on the country individual level, the demand for better housing and housing areas are growing as well. On the macro level, the housing market development was no longer seen as a sole responsibility of a country’s government. The market has received a significant and active participation not only from the local but also foreign developers.
Active participation from developers are also seen in Malaysia, particularly since 2009. During the year, Malaysia has relaxed its real estate policy, among others abolishing the Foreign Investment Committee function in filtering and monitoring foreigners’ application in buying real estate in Malaysia. Real estate industry in Malaysia hailed the government’s action and believed the relaxation would invite more foreign direct investment (FDI) into the country. It was seen such way as FDI has always been one of the Malaysia engine for growth since 1980s. Therefore, it was believed, with the liberalization of real estate policy, FDI into Malaysia would continue to boost the country’s growth as a whole. The effect of FDI on a country’s growth has also been evident in many countries following the FDI-led growth hypothesis (Cipollina et al., 2012; Gursoy, Sekreter & Kalyoncu, 2013).
The perception that FDI might accelerate a country’s growth nonetheless is uncertain when there are emerging evidences that show it might not necessary be the case (Yalta, 2013; Adeniyi et al., 2013). Further, while FDI might contribute to a country’s growth, it is ambiguous whether the spillover has actually benefit individual well-being. It is a growing concern in Malaysia as the country enjoys steady inflows of FDI and considerable growth, the house price has escalated to a very high level since 2009, or to be precise, since the relaxation of real estate policy takes place. The country’s house price index has increased by more than 60% between 2009 and 2015 but the income per capita increased at single digit only during the same period. Together with the increasing of price in many goods, many locals cannot afford to even put down the 10% deposit to buy a home.
well-being. As the relationship between FDI and local’s well-being is becoming crucial due to the escalating high price, this paper intends to examine the long-term impact of FDI on house price in Malaysia.
A number of FDI studies have been performed on other macroeconomic variables such as on trade (Belloumi, 2014; Dash & Parida, 2014) and domestic investment (Liuyong & Guoliyang, 2002; Onaran, Stockhammer & Zwickl, 2013). The study of FDI effect were also performed on industry level such as in manufacturing (Masron, Zulkafli & Ibrahim, 2012; Fernandes & Paunov, 2012) and service industry (Jia, 2014; Shu & Lin, 2012). The resentment over the discrepancy between what a country wants to achieve and what an individual is struggling on should be looked carefully particularly by revising the impact of FDI inflows on their need to have a home, thus making this paper filling the gap. Considering the issue, this paper attempts to analyse the long-run relationship between FDI and house price in Malaysia. The impact of FDI will be measured in five different states which will represent different economic dynamic in Malaysia. The states that were observed are Kuala Lumpur (KL), Selangor, Penang, Kedah and Pahang. Kuala Lumpur is not a state but a city. The city is included in this observation since it is Malaysia’s capital city. This study is expected to reveal some interesting findings as period of liberalization will also be considered. The reason for its inclusion is to observe whether the period would actually affecting the role of FDI in providing comfort to Malaysian.
LITERATURE REVIEW
While the effect of FDI has been studied largely by scholars, to our knowledge, there is no study that analysed the effect of FDI on house price. The FDI-house price analysis is important in the rising trend of real estate industry today as many emerging countries are exercising liberalization policy on their country’s real estate. At the same time, these countries are also capitalizing on FDI to sustain their growth. House price is traditionally determined by the classic supply and demand factors. Price theory asserts that in a free market economy the market price is determined by supply and demand. The equilibrium price is set so as to equate the quantity being supplied and that being demanded. In reality however, the price may be distorted by other factors, such as tax and other government regulations.
The house price studies can be divided into several clusters - dynamics study (Bork & Møller, 2015; Bajari et al. 2013), cycle study (Huang & Tang, 2012; Ferrero, 2015). While there is a substantive body of literature studies on house prices, in particular in the current decade, no fixed set of price determinants has been identified. For example, Glindro, Subhanji and Zhu (2011) study the macroeconomic and institutional impact in explaining the differential impact between fundamental and speculative housing bubbles. According to them, the spillover effects of housing bubbles only have a mild adjustment on Asia Pacific property development and introduced only small damage to banking system. House prices are also said to be synchronized across countries (Hirata et al., 2012) in addition to the finding that global interest rate shocks tend to have a significant negative effect on global house prices. The global monetary policy nonetheless does not have such an impact and they are inconclusive about other shocks that might have impact house price significantly. Although the model throws light on global cause of house price it falls short in including the significant role of FDI inflows. Therefore, leaving a gap between what FDI can contribute to an urban area, particularly property growth.
RESEARCH METHODOLOGY
This study analysed the effect of FDI on house price in the long-run in five states in Malaysia; Kuala Lumpur, Selangor, Penang, Kedah and Pahang. The dependent variable for this study is house price index, while the independent variables are number of house supply, gross domestic per capita, interest rate and FDI inflows.
Data and Sources
is included to represent macroeconomic variable and the policy variable is net FDI inflows. All data were obtained from Bank Negara Malaysia. In mathematical form, the equation is as follows:
) , , ,
(HS GDC IR FDI f
HPIij ,
where HPIij is house price index for j states, HS is supply, GDC is gross domestic
product per capita, IR is lending interest rate and FDI is net foreign direct investment. The relationship is examined based on quarter period between Q1:1999 and Q4:2015 due to availability of data. It is acknowledged that the data set is not large; however, in the spirit of earlier studies on technology that suffered from the same issues in 1980s to mid-1990s, it is hoped that this study to pave a new path for further analysis. It is anticipated that, in time, this study will encourage the development of more active property data in Malaysia.
This study considers the effect of liberalization by employing dummy variable that hold “1” to represent period with housing liberalization, which began from Q3:2009 until Q4:2015.
Methodology
The analysis was begun by performing unit root test to examine whether our series suffer from unit root issue. Then correlation analysis was performed to observe the association between the variables and to check whether multicollinearity issue arises. Next, the long-run relationship was examined by employing the Johansen Cointegration test, with the null hypothesis of no cointegration relationship in the equation system. This cointegration analysis determines the number of cointegrating vectors, r, using the maximal eigenvalue procedure as given in Johansen (1988). The number of cointegrating vectors was determined sequentially based on the log-likelihood ratio test statistics. There are two tests provided, namely trace and maximal eigenvalue tests. The main importance of these two tests is the both tests have no standard distributions under the null hypothesis. Nevertheless, Johansen and Juselius (1990) suggest that the maximal eigenvalue test is more powerful than the trace test.
Hypotheses
Based on notion that FDI promotes growth (Borensztein, De Gregorio & Lee, 1998; Vu & Im, 2013; Al-Sadig, 2013), it is hypothesized that FDI spillover would contribute to transfer of technology in developing real estate, particularly in terms of technique in building house at a cheaper level. Hence, H1: FDI inflows affect house price level negatively.
Since price of house is partly determined by supply, it is hypothesized that high house supply would cause the house price to decline. Therefore, H2: House supply affects house price level negatively. High standard of living, which is proxied by gross domestic per capita is expected to influence house price positively due to availability of demand of individual living in comfort and has access to sufficient material which allow individual to purchase a house. Thus, H3: Standard of living affects house price level positively. Lending interest rate is essential in home loan purchasing since potential buyers will look for financing their home with lower interest rate. Thus, lower interest rate will attract more potential buyers therefore, would drive housing demand, consequently the house price. Hence, H4: Interest rate affects house price level negatively.
RESULTS AND DISCUSSION
This section elaborates on the findings of the long-run relationship analysis that have been conducted. Prior to the analysis, the unit root test is conducted to ensure the series (lnHPIM, lnHPIKL, lnHPISEL, lnHPIPNG, lnHPIKDH, lnHPIPHG,
lnHS, lnGDC, lnIR and lnNFDI) are free from unit root which could cause
spurious results later. By utilizing the ADF Unit Root test, it is confirmed that all series are integrated of order 1, I (1).
Then, the association between these variables was examined by performing correlation analysis (Table 1) and the results indicated a possibility of multicollinearity issue between lnGDC-lnIR (
(lnGDC|lnIR) 0.829).Table 1 Correlation analysis results
lnHPIM lnHS lnGDC lnIR lnNFDI lnHPIM 1.000
lnHS -0.279 1.000
lnGDC 0.955 -0.338 1.000
lnIR -0.776 0.055 -0.829 1.000
lnNFDI 0.601 -0.038 0.623 -0.517 1.000
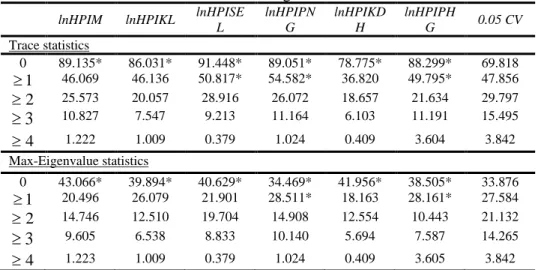
The analysis proceeded by conducting the Johansen Cointegration analysis to examine the possibility of FDI inflows and house price having a cointegrating relationship. The null hypothesis of no cointegrating relationship was assumed. In order to confirm the results, the outcomes were referred against the 5% critical value of the Trace and Max-Eigenvalue statistics (Table 2). It can be seen that house price in selected states, regardless of their economic dynamic are cointegrated with the IVs in the long-run. Their test results are all above the 5% critical values of Trace and Max-Eigenvalue - justifying there is at least 1 cointegrating relationship in the system. To further confirm the impact of lnFDI
on lnHPI, the analysis was continued by checking the VECM.
Table 2 Johansen Cointegration Test Results
lnHPIM lnHPIKL lnHPISE L
lnHPIPN G
lnHPIKD H
lnHPIPH
G 0.05 CV
Trace statistics
0 89.135* 86.031* 91.448* 89.051* 78.775* 88.299* 69.818
1
46.069 46.136 50.817* 54.582* 36.820 49.795* 47.856
2
25.573 20.057 28.916 26.072 18.657 21.634 29.797
3
10.827 7.547 9.213 11.164 6.103 11.191 15.4954
1.222 1.009 0.379 1.024 0.409 3.604 3.842
Max-Eigenvalue statistics
0 43.066* 39.894* 40.629* 34.469* 41.956* 38.505* 33.876
1
20.496 26.079 21.901 28.511* 18.163 28.161* 27.584
2
14.746 12.510 19.704 14.908 12.554 10.443 21.132
3
9.605 6.538 8.833 10.140 5.694 7.587 14.2654
1.223 1.009 0.379 1.024 0.409 3.605 3.842
*Reject the null hypothesis of no cointegration at 5% significant level.
lnNFDI and lnHPIM (various combinations)
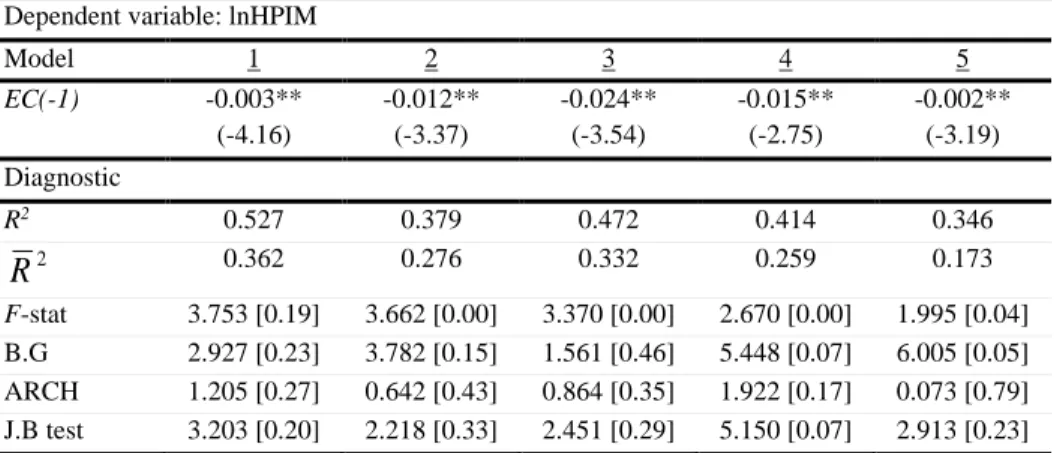
In the first setting, the study tested the house price model and the VECM results are shown in Table 3. There were five sub-models ranging from model which included all variables (Model 1) to models which this study excluded one variable at a time. The VECM results show that all models have negative error correction terms (ECT), which are significant at 1% level. All models show that the disequilibrium will be corrected at speed between 0.3% and 2.4% quarterly. In the long-run, the effect of FDI inflows was consistent throughout the models (Table 4). FDI inflows affected house price in Malaysia negatively, thus supported the hypothesis. When GDC was excluded, a 1% increase in net FDI inflows reduced Malaysia house price by 6.8% (Model 3). The magnitude of net FDI inflows effect was smaller when GDC was included, implying its significance in mitigating FDI’s effect on house price.
Table 3 VECM results for lnHPIM
Dependent variable: lnHPIM
Model 1 2 3 4 5
EC(-1) -0.003** (-4.16) -0.012** (-3.37) -0.024** (-3.54) -0.015** (-2.75) -0.002** (-3.19) Diagnostic
R2 0.527 0.379 0.472 0.414 0.346
2
R
0.362 0.276 0.332 0.259 0.173F-stat 3.753 [0.19] 3.662 [0.00] 3.370 [0.00] 2.670 [0.00] 1.995 [0.04] B.G 2.927 [0.23] 3.782 [0.15] 1.561 [0.46] 5.448 [0.07] 6.005 [0.05] ARCH 1.205 [0.27] 0.642 [0.43] 0.864 [0.35] 1.922 [0.17] 0.073 [0.79] J.B test 3.203 [0.20] 2.218 [0.33] 2.451 [0.29] 5.150 [0.07] 2.913 [0.23]
( ) denotes t-statistics, [ ] denotes p-value, * and ** indicates coefficient is significant at 5% and 1% level respectively. B.G test refers to Breusch – Godfrey Serial Correlation LM. ARCH is used to test the heterogeneity. J.B is Jacque-Bera test for normality.
Table 4 Long-run results for lnHPIM
Dependent variable: lnHPIM
Model 1 2 3 4 5
lnHS -0.249*
(-1.92) -1.036** (-3.13) -1.789 (-1.16) -0.745 (-1.52) -
lnGDC -0.454
(-1.31)
-3.008** (-4.27)
- -1.485*
(-1.93)
4.478 (1.42)
lnIR 0.978*
(1.82)
-1.933 (-1.44)
3.877 (0.91)
- 11.181*
(2.00)
lnNFDI -0.408** (-3.65)
- -6.793**
(-5.03)
-1.127** (-3.17)
-5.333** (-4.59)
C 4.88 45.33 64.56 30.22 -32.94
lnNFDI and lnHPI (various states)
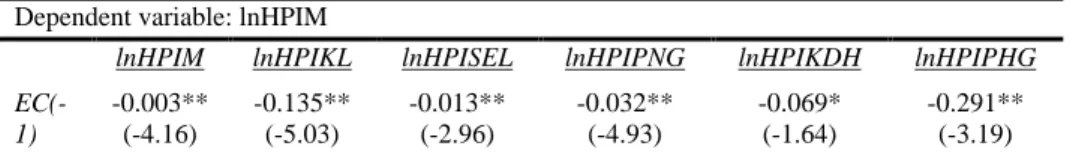
In second setting, this study compared house price models in 5 states and began the analysis with VECM. The error correction terms produced desired negative figures across states and they were significant at 1% level. The disequilibrium in these states’ house price equation adjusted at speed between 1.3% and 30% every quarter – the fastest correction was in house price in Pahang (Table 5).
Table 5 VECM results for lnHPI (various states)
Dependent variable: lnHPIM
lnHPIM lnHPIKL lnHPISEL lnHPIPNG lnHPIKDH lnHPIPHG
EC(-1)
-0.003** (-4.16)
-0.135** (-5.03)
-0.013** (-2.96)
-0.032** (-4.93)
-0.069* (-1.64)
-0.291** (-3.19)
( ) denotes t-statistics
In Table 6, the long-run estimation results show that FDI inflows affected house price negatively in all states except Penang (due to its insignificance). By comparison, lnNFDI affected house price in Selangor the most, as result suggested an increase of 1% in net FDI inflows has caused the house price in Selangor to reduce by 1.59%. The effect of lnFDI on house price in KL and Kedah were about the same, although the dynamic of the states’ economy were different. The small impact of lnNFDI on house price in KL might be due to small direct investment in the capital city since the city is already congested and nearly saturated compared to Selangor. The lesser impact of lnFDI on house price in Kedah on the other hand might be due to the lesser effort in attracting foreign inflows, thus, impacted house price at a smaller magnitude than in Selangor.
On control variables such as lnHS and lnGDC, their beta coefficients show mixed results. Earlier, it was hypothesized that house supply will affect house price negatively and results in Table 6 show that the hypotheses are supported for house price in KL and Penang. High house supply, however, has caused house price in Kedah and Pahang to increase significantly. Since the data of house supply in this study is not based on state’s data, it is suspected the high increase in house price in Kedah and Pahang is due to the country’s house supply spillover effect onto the states. On the standard of living, it was hypothesized that a higher standard of living would cause house price to increase. Interestingly, in KL and Penang (the two dynamic states), low standard of living have influenced price in these states to be high. These results confirmed that the average living standard of locals could not catch up with the high house price in KL and Penang.
Table 6 Long-run results for lnHPI of states
Dependent variable: lnHPI
lnHS -0.249* (-1.92) -0.270** (-5.29) 0.067 (0.16) -1.143** (-3.79) 0.082* (1.65) 0.158** (3.60)
lnGDC -0.454 (-1.31)
-0.969** (-7.22)
- -2.266**
(-2.82)
- 0.218
(1.26)
lnIR 0.978* (1.82) -0.121 (-0.55) -0.417 (-0.37) -0.811 (-0.61) 0.759** (5.56) 0.221 (0.92)
lnNFDI -0.408** (-3.65) -0.259** (-5.43) -1.585** (-4.38) -0.282 (-1.05) -0.267** (-6.05) -0.731** (-7.87)
C 4.88 11.83 8.53 37.96 -4.89 -3.54
( ) denotes t-statistics, * and ** indicates coefficient is significant at 5% and 1% level respectively.
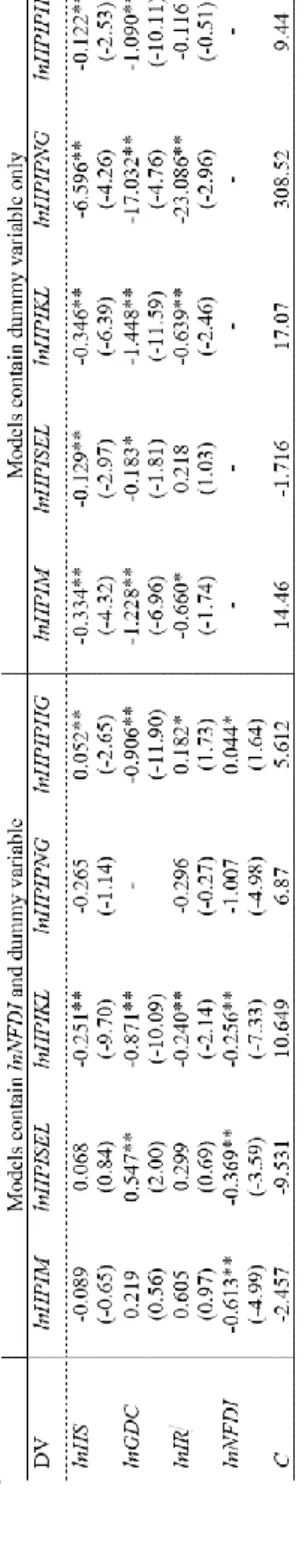
lnHPI and Dummy Variable, with and without lnNFDI
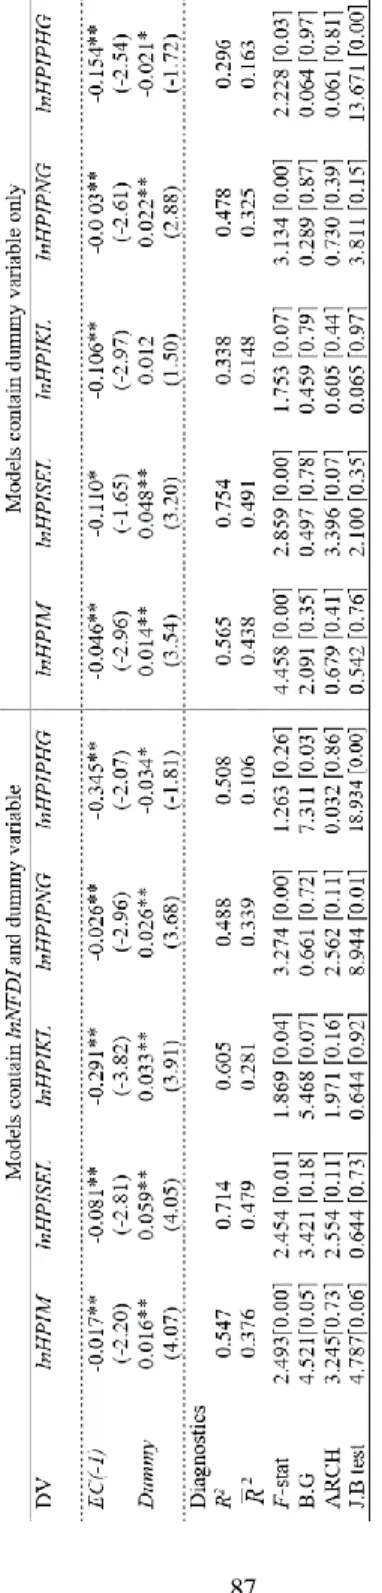
The study also examined the effect of liberalization policy on house prices by using dummy variables in the third setting. At the same time, it wanted to observe whether the inclusion of the dummy variable would jeopardize the FDI inflows effect on house price. Table 7 provides the results for two VECMs. In the short-run, it can be said that all equations had a negative ECT in the models that included dummy variable. It implies significant speed of the adjustment happened in the short-run house price models regardless of whether FDI inflows present or not. The dummy variables produced positive coefficient signs, showing that the liberalization policy has affected house price positively in the short-run, again, regardless of whether FDI inflows took place or not in the country. In fact the magnitude of the policy impact did not differ much in the short-run. Referring to the long-run estimation results (Table 8), the negative influence of FDI inflows on house price remain the same as the previous tests.
Since VECM only allow dummy variable to be included as exogenous variable and the results are referring to short-run only, we utilized the FMOLS to capture the policy’s effect in the long-run (Table 9). Overall, these models have high R2 and the regression passed all diagnostic tests.
In FMOLS regression, this study included dummy variable as endogenous variable and as predicted, the liberalization policy has a positive impact on house price in Malaysia and all states under observation. The results suggest that liberalization policy put forward by the government has indeed increased the house price in these areas by 0.12% to 0.33%. The highest impact was on the dynamic states – KL and Penang.
Table 7. VECM results for lnHPI of states containing dummy variable, with and without lnNFDI ( ) den o tes t -statis tics , [ ] d en o tes p -v alu e, * and ** indicates coef ficien t is sig n if ican t at 5 % an d 1% level respe ctiv ely . B.G test ref
ers to Breus
ch – Go d frey Ser ial Co rrelation L M. ARC
H is us
ed
to test th
e heterog
en
eity
. J.
B is Jacq
Table 8 Long-run results for lnHPI of states containing dummy variable, with and without lnNFDI
(
)
den
o
tes t
-statis
tics, * an
d
**
ind
icates coef
ficien
t is sig
n
if
ican
t at
5
% an
d
1%
level respecti
v
ely
.
Table 9 FMOLS results of house price models
DV lnHPIM lnHPISEL lnHPIKL lnHPIPNG lnHPIKDH lnHPIPHG lnHS 0.081
(1.31) 0.116** (2.47) -0.148** (-2.56) -0.125** (-2.35) -0.136** (-5.00) -0.192** (-3.98) lnGDC 0.492**
(3.02)
0.597** (4.80)
- - - -
lnIR 0.029 (0.12) 0.175 (0.97) -0.589** (-2.61) -0.609** (-2.96) -0.696** (-6.56) -0.912** (-4.87) lnNFDI -0.006
(-0.17) -0.014 (-0.57) 0.080** (2.27) 0.063* (1.93) 0.054** (3.24) 0.093** (3.15) Afterlib 0.167*
(1.94) 0.124* (1.89) 0.329** (4.02) 0.274** (3.66) 0.167** (4.17) 0.167** (2.50)
C -1.912**
(-2.30) -3.721* (-1.87) 6.771** (8.15) 6.712** (8.83) 7.09** (18.11) 7.837** (11.34)
R2 0.882 0.883 0.816 0.807 0.886 0.847
2
R
0.871 0.873 0.805 0.794 0.879 0.837( ) denotes t-statistics, * and ** indicates coefficient is significant at 5% and 1% level respectively
CONCLUSION
House price in Malaysia increased dramatically since the Government opened up the property sector to outsiders. One of the reasons for the opening up of the sector was to attract larger FDI inflows and to keep up with the neighbouring countries in liberalizing their properties. The effectiveness of the measure is, however, questionable as the locals are finding greater difficulties in owning a home. The role of FDI in assisting locals in purchasing a house is questioned although it might have contributed to the country’s growth as a whole. Is it fair to blame FDI for the higher house price? Or, does the presence of property liberalization policy affect the role of FDI inflows in benefitting Malaysians, particularly in purchasing an asset?
This study analysed the effect of FDI on the house price in the long-run and as discussed earlier, it was found that FDI inflows has affected the house price in Malaysia or to be specific, house price in KL, Selangor, Penang, Kedah and Pahang. FDI inflows affected house price in this states negatively, which means that 1 unit increase in FDI is suggested to reduce the price of houses by 0.25 to 1.25 percent. While one wanted to be happy with the result, the presence of liberalization policy may have tarnished the glee. The role of FDI changed when the liberalization policy was included into the analysis model. The results showed that liberalization policy has caused the house price to increase in both dynamic and slow-progressive areas. In fact, the magnitude of the effect are somewhat the same, confirming a worrisome question: How do locals who work in Kedah and Pahang (receiving relatively low wages) could afford to buy a house which its price increase at the speed of KL and Penang’s house price?
inflows in assisting Malaysians, particularly in housing market. The major limitation is the length of data. Nonetheless, it is hoped this will pave a way to more upcoming studies on housing. Future researchers are also suggested to probe into neighbouring countries analysis to compare their FDI inflow influence on house price.
ACKNOWLEDGEMENT
The authors wish to thank Universiti Sains Malaysia for supporting this research under grant Short-Term 304/PMGT/6313288
REFERENCES
Adeniyi, O., Omisakin, O., Egwaikhide, F. O., & Oyinlola, A. (2012). Foreign direct investment, economic growth and financial sector development in small
open developing economies. Economic Analysis and Policy, 42(1), 105-127.
Al-Sadig, A. (2013). The effects of foreign direct investment on private domestic
investment: evidence from developing countries. Empirical Economics,
44(3), 1267-1275.
Aleksynska, M., & Havrylchyk, O. (2013). FDI from the South: the role of
institutional distance and natural resources. European Journal of Political
Economy, 29, 38-53.
Bajari, P., Chan, P., Krueger, D., & Miller, D. (2013). A dynamic model of housing
demand: Estimation and policy implications. International Economic
Review, 54(2), 409-442.
Belloumi, M. (2014). The relationship between trade, FDI and economic growth in Tunisia: An application of the autoregressive distributed lag model.
Economic Systems, 38(2), 269-287.
Borensztein, E., De Gregorio, J., & Lee, J. W. (1998). How does foreign direct investment affect economic growth?. Journal of international Economics, 45(1), 115-135.
Bork, L., & Møller, S. V. (2015). Forecasting house prices in the 50 states using
Dynamic Model Averaging and Dynamic Model Selection. International
Journal of Forecasting, 31(1), 63-78.
Cipollina, M., Giovannetti, G., Pietrovito, F., & Pozzolo, A. F. (2012). FDI and growth: What cross‐country industry data say. The World Economy, 35(11), 1599-1629.
Dash, R. K., & Parida, P. C. (2013). FDI, services trade and economic growth in
India: empirical evidence on causal links. Empirical Economics, 45(1),
217-238.
Dunning, J.H. (1979) Explaining Changing Patterns of International Production: In
Defence of the Eclectic Theory. Oxford Bulletin of Economics and Statistics,
41, 269-295. http://dx.doi.org/10.1111/j.1468-0084.1979.mp41004003.x Ferrero, A. (2015). House price booms, current account deficits, and low interest
Fernandes, A. M., & Paunov, C. (2012). Foreign direct investment in services and
manufacturing productivity: Evidence for Chile. Journal of Development
Economics, 97(2), 305-321.
Glindro, E. T., Subhanij, T., Szeto, J., & Zhu, H. (2011). Determinants of house prices
in nine Asia-Pacific economies. International Journal of Central
Banking, 7(3), 163-204.
Gursoy, F., Sekreter, A., & Kalyoncu, H. (2013). FDI and economic growth
relationship based on cross-country comparison. International Journal of
Economics and Financial Issues, 3(2), 519-524.
Jia, M. A. (2014). Effect of FDI on development of service industry in Jilin
Province. Value Engineering, 17, 115.
Jiang, D., Chen, J. J., & Isaac, D. (1998). The effect of foreign investment on the real
estate industry in China. Urban Studies, 35(11), 2101-2110.
Johansen, S. (1988). Statistical analysis of cointegration vectors. Journal of economic
dynamics and control, 12(2-3), 231-254.
Johansen, S., & Juselius, K. (1990). Maximum likelihood estimation and inference
on cointegration—with applications to the demand for money. Oxford
Bulletin of Economics and statistics, 52(2), 169-210.
Hirata, H., Kose, M. A., Otrok, C., & Terrones, M. E. (2012). Global house price
fluctuations: Synchronization and determinants (No. w18362). National
Bureau of Economic Research.
Huang, H., & Tang, Y. (2012). Residential land use regulation and the US housing
price cycle between 2000 and 2009. Journal of Urban Economics, 71(1),
93-99.
Kedia, B., Gaffney, N., & Clampit, J. (2012). EMNEs and knowledge-seeking
FDI. Management International Review, 52(2), 155-173.
Liuyong, Y., & Guoliang, S. (2002). The squeeze-in and squeeze-out effects of
foreign direct investments on domestic investments. Statistical Research, 3,
001.
Masron, T. A., Zulkafli, A. H., & Ibrahim, H. (2012). Spillover effects of FDI within
manufacturing sector in Malaysia. Procedia - Social and Behavioral
Sciences, 58, 1204-1211.
Mathews, J. A. (2006). Dragon multinationals: New players in 21st century globalization. Asia Pacific Journal of Management, 23(1), 5–27
Onaran, Ö., Stockhammer, E., & Zwickl, K. (2013). FDI and domestic investment in
Germany: crowding in or out? International Review of Applied
Economics, 27(4), 429-448.
Shu, Y., & Lin, L. X. (2012). The empirical research on the stimulative effect of foreign direct investment in China on its service export based on the gravity
model. Journal of GuizhouUniversity of Finance and Economics, 5, 005.
Temiz, D., & Gökmen, A. (2014). FDI inflow as an international business operation by MNCs and economic growth: An empirical study on Turkey.
Vu, T. B., & Im, E. I. (2013). Impacts of FDI relations between the US and East Asia
on economic growth. Asia-Pacific Journal of Social Sciences, 5(1), 18-30.
Yalta, A. Y. (2013). Revisiting the FDI-led growth hypothesis: The case of
VOLUME 15 ISSUE 3 (2017), Page 93 – 104
DUPLICATION OF URBAN PLANNING FUNCTIONS IN A NIGERIAN STATE: UNCOVERING THE CAUSALITY
Oluwole Daramola1, Olorunfemi Olojede2, Akintayo Ojo3, & Oluwaseun Olowoporoku4
1,2,3,4Department of Urban and Regional Planning
OBAFEMI AWOLOWO UNIVERSITY, ILE-IFE, NIGERIA
ABSTRACT
This study examines the duplication in urban planning functions in Osun State of Nigeria. Data for the study were sourced from questionnaire administered on the directors of all the 35 planning agencies in the state. Data collected include respondents’ characteristics and the operation of the planning agencies and these were analysed using frequency distribution. The study revealed that the agencies experienced conflict of interest and the reason for that was mostly jurisdictional. Also, the agencies seldom related with one another. The study concluded that the structure of urban administration in the state causes duplication of urban planning functions and recommends, among others, legislative changes in urban administration of the state and Nigeria.
Keywords: administration, duplication, Nigeria, planning, urban
Date Received: 15th March 2017