Office for National Statistics 1
Rural and urban areas: comparing
lives using rural/urban
classifications
By Tim Pateman, Office for National Statistics
Abstract
Most people have a clear impression of what the cities, towns and countryside look like in the UK, both physically and in terms of the lives of the people who live there. This article compares rural and urban areas statistically for themes such as working, earnings, services and population, using geographical classifications.
There is quantitative evidence that rural areas are better off than urban areas on a number of different measures, such as unemployment and crime, but there are substantial
differences within both rural and urban areas. In a few respects rural areas are worse off. Analysis indicates that house prices are less affordable to local workers in rural areas than urban areas and the costs, travel time and carbon emissions resulting from transport tend to be higher in rural areas.
Using classifications that show sparse areas of England, some topics, such as incomes and qualifications, show ‘two countrysides’ – a better off, less sparse and more accessible one, and a less populous and isolated sparse countryside. Patterns within urban areas often differ, with the most urban areas of England frequently showing different trends from those in other places, and the widest variations.
This article shows that while no single rural/urban classification can be used for all
geographies, using such a product helps to better understand the differing characteristics of rural and urban areas in a consistent, transparent way. This article will be of interest to those who wish to explore local authority or small area datasets, covering countries within the UK, for rural/urban differences, as well as those who wish to develop a greater
understanding of rural/urban differences in general. It will also be of interest to those
involved in local policy development and the allocation of resources within areas, as well as academics, journalists, researchers and members of the public with an interest in the
Office for National Statistics 2
Contents
Abstract... 1 Introduction ... 3 Rural/urban classifications ... 5 Working... 22Income and earnings ... 35
Services and life chances ... 41
Physical environment ... 50
Population and demography ... 62
Residents’ perception of their area ... 69
Conclusion ... 71
References... 73
Office for National Statistics 3
Introduction
Despite the continued spread of our towns and cities, the UK geographic landscape is still
predominantly rural. Whichever classification is used, for all four countries in the UK, less than one-third of the land area is classified as urban. However, at least 60 per cent of the population is concentrated in these smaller urban areas.
The topographic differences between town and country might be expected to lead to very different experiences for their residents. Transport and access to services are the most obvious areas for study, and this article looks at these as well as population structures, education, health and the physical environment. Although the article does not look at change over time and the recent recession, there is an emphasis on household finances and working lives.
The rural/urban classifications established for different nations and geographies within the UK present excellent opportunities to examine all these themes. The aim of this paper is to apply seven recognised classifications to a variety of datasets to determine if differences and patterns exist in UK life according to how rural or urban a place is.
These classifications allow us to study not just specific places, but ‘place’ in general. They potentially allow differences between places to be shown for big groupings of people, and the bigger the groups, the more quickly or more cheaply robust statistics can be produced. In effect, classifications offer opportunities to help understand complex differences, with less information.
Seeing clear differences between broad groupings of areas may present opportunities for designing, implementing and monitoring policy; but it raises the question – are the differences positive or negative? What effects do they have on the people who live there? Qualitative research is better placed to answer that question1. However, official statistics can be used to consider
whether barriers exist (in which case differences might be divisive), or whether people appear to be moving freely, in which case differences could be argued to represent genuine diversity and
choice. Both rural and urban areas have been painted positively (idylls and cosmopolitan centres), and as traps. Statistical classifications allow us to dig deeper than stereotypes and impressions.
Sources
Some of the data used in the article were already aggregated to urban and rural area types. However, this is mainly an exercise in taking publicly available datasets, published at local
authority or small area level, and matching to a rural/urban classification then aggregating the data directly.
It is worth noting that a wealth of data are available at the small area level from the 2001 Census. This was considered too out of date for analysis for this article. However, when 2011 Census data are released over the next few years there will be many opportunities for rural/urban analysis.
This article aims to complement the large volume and wide variety of rural/urban material published by other UK organisations. For England these include the Commission for Rural 1
Office for National Statistics 4 Communities (CRC), the Department for Environment, Food and Rural Affairs (Defra) and the Office for National Statistics (ONS) through its Neighbourhood Statistics Service. The Welsh Government (WG) publishes topic reports and compendia, such as ‘Statistical Focus on Rural Wales’ which gives more information on the local authority level rural/urban classification used here.
The Scottish Government publishes rural/urban material, and, as with other countries, this is both in the form of dedicated reports (for example briefings and key facts documents) and as
appendices or sub-sections of wider reports. Different government departments in Northern Ireland publish rural/urban statistics, including the Northern Ireland Statistics and Research Agency
(NISRA), Department of Agriculture and Rural Development (DARD) and Department for Social Development (DSD).
The data used in the figures are available at:
www.statistics.gov.uk/downloads/theme_compendia/RegionalSnapshot/rt43-rural-urban-areas.xls
Issues and limitations
There are a number of things to bear in mind when interpreting the material in this article.
Interpretation
• Policies designed specifically for urban or rural areas might refer to extremes – inner cities or small villages. Using a statistical classification puts every place in a country, including the areas most people think of as suburbs, into either an urban or a rural area type
• These classifications make it easy to slip into the ‘ecological fallacy’ – for example thinking of all people in the most deprived areas as deprived, when in fact many people in the most deprived areas are by no means ‘poor’ and the majority of deprived people do not live in deprived areas. Even the biggest rural/urban difference can obscure there being more variation within areas than there is between them
• On the other hand, it is often hypothesised that neighbourhoods do affect people. For example, studies on deprivation and health sometimes show that even when many other factors are taken into account, simply living in a deprived neighbourhood is associated with poorer health
• Classifications may feel wrong for particular areas. None of the classifications used in this article take account of the look and feel of a particular place, rather they are modelled using sets of definitions and rules
Presentation
• In all cases areas can be split into urban and rural groups (or more accessible, less accessible for local authorities in Northern Ireland), but most classifications give at least one more detailed way of breaking down the data. This report shows a number of different ways of sub-dividing such classifications. However, not all the classifications offer breakdowns of urban areas
• Urban and rural areas should not be compared using more than one classification, so in general each country is analysed separately
Office for National Statistics 5
• Data are not collected and published consistently across the UK, especially for devolved matters such as housing. Although many datasets used here are multi-country, sometimes there has only been space for data analysis for a single country
Data accuracy
• In order that official statistics do not identify individual people or businesses, data are subject to disclosure control. In many cases the datasets here have been subject to some degree of rounding or suppression (where some data may not be available). Unfortunately this is more likely to affect smaller areas. Since this article aggregates published data, for local authority datasets the estimates for rural areas (which tend to be less populous) are likely to be less accurate
• While some datasets, such as those covering crime and General Certificate of Secondary Education (GCSE) or equivalent scores, are derived from administrative sources, in most cases a sample survey has been used. All the figures in this report should be assumed to be
estimates and subject to sampling variability, unless stated otherwise
• Where national figures are published in this report, they may have been aggregated from local data, and therefore may differ from national figures published elsewhere. Different time periods, geographies and use of public (disclosure controlled) datasets may also make figures here difficult to compare with those elsewhere
Rural/urban classifications
This article uses two main types of classification to divide areas into rural and urban. To cover small area data and local authority level data for the four countries of the UK requires seven classifications. A summary of each of these, including the data used, publication links, and the headline proportions of urban and rural people, can be found in Appendix A. This section presents a map and a table of key population figures for each one.
Many alternative and older classifications exist – it was estimated in 2007 that 30 different
definitions were in use across the UK (Scott, Gilbert and Gelan, 2007). Some classifications cover only some types of area – for example the Commission for Rural Communities’ uplands areas. Other products cover the whole of the UK, but do not focus on rural and urban issues alone. ONS’s Local Authority Classification and Output Area Classification products have some categories that show rural areas; however, these show different geographical distributions from those developed by or with Defra, and are not widely used as rural/urban classifications.
Dedicated rural/urban classifications are generally based on complex modelling exercises. Some aspects have been devised subjectively, for example, selecting the Valleys group of local
authorities in Wales using local knowledge and existing policy area boundaries. Thresholds differ, so that any settlement with more than 10,000 people will be considered urban in any UK small area definition; however, settlements with between 3,500 and 10,000 people are treated differently in each classification. Several have been updated, and it is worth noting that a number of government organisations, including Communities and Local Government (CLG), Defra, ONS and WG, are
Office for National Statistics 6 jointly looking into updating the rural/urban definition covering small areas in England and Wales for use with 2011 Census outputs.
What makes a good rural/urban classification? A common approach is to take several continuous data variables, not just one, and look for clusters of areas. Commonly-used factors are population size, population concentration and remoteness (which can be measured as physical distance to other settlements, travel time, or a modelled measure of where people are in relation to each other known as ‘population potential’). Ultimately there is no limit to the kinds of settlements a
classification can pick out. Vickers’ 2003 UK district classification2 picks out area groupings such as ‘agricultural fringe’ and ‘averageville’ but this classification has seen less use in recent years than simpler definitions. The perfect classification would be comparable across different nations. Only the Eurostat ‘urban-rural typology’3 can offer this at the moment; however, because it is based on larger (NUTS 34) areas than those used in this article, and it does not allow different kinds of urban area to be distinguished, it is not widely used in analyses such as those in this article.
The classifications used in this article are based on different sets of criteria. Individual classifications may have methodological limitations. Such issues tend to be set out in a methodology or technical report for each classification, links to some of which can be found in Appendix A.
The Rural/Urban Definition (England)
Map 1, which uses a small area geography based on Middle Layer Super Output Areas (MSOAs), shows a complex patchwork of area types. Of particular note are the ‘sparse’ areas, both urban and rural, which are few in number, and concentrated in particular areas broadly round the fringes of the country. This definition picks out a far larger number of urban areas than the local authority definitions do, but groups them all together, so that, for example, Westminster and Weston-super-Mare are shown in the same group. It is also worth noting that Town and Fringe – Less Sparse areas almost always lie next to Urban – Less Sparse ones.
2
For an example of this classification being used, see ONS’s Population Trends 134, available at:
www.statistics.gov.uk/StatBase/Product.asp?vlnk=6303&Pos=1&ColRank=1&Rank=272
3
More information on the Eurostat ‘urban-rural typology’, which can be used to compare urban and rural regions across different countries, can be found here:
http://epp.eurostat.ec.europa.eu/statistics_explained/index.php/Urban-rural_typology 4
Some 133 ‘Nomenclature of Territorial Units for Statistics level 3’ areas cover the UK, and tend to cover groups of local authorities, resulting in areas such as ‘Lancashire’ in England, and ‘Monmouthshire and Newport’ in Wales.
Office for National Statistics 7 1 Middle Layer Super Output Areas.
Source: Office for National Statistics
Contains Ordnance Survey data © Crown copyright and database right 2011 Urban – Less Sparse
Urban – Sparse
Village, Hamlet & Isolated Dwellings – Sparse Village, Hamlet & Isolated Dwellings – Less Sparse Town & Fringe – Sparse Town & Fringe – Less Sparse
Taunton Blackpool Leeds Southampton Liverpool Southend-on-Sea Nottingham Exeter Leicester Northampton Carlisle Brighton and Hove Sheffield
Kingston upon Hull
Norwich Bristol Oxford Reading Stoke-on-Trent Ipswich Manchester Birmingham Stockton-on-Tees Newcastle upon Tyne
Bournemouth Plymouth Lancaster Guildford Portsmouth Lincoln London Folkestone Cambridge
Map 1
The Rural/Urban Definition for MSOAs
1in England
Office for National Statistics 8
Table 2
Key population figures for England: by Rural/Urban
Definition area type, 2009
Wider area
type Narrower area type
Mid-2009 population, thousands Percentage of total population Percentage of total land area Percentage change in population since 2001
Urban Urban1 – Less Sparse 42,071 81.2 20.5 5.5
Urban1 – Sparse 114 0.2 0.4 2.6
Rural Town & Fringe – Less Sparse 4,424 8.5 16.1 5.2
Town & Fringe – Sparse 220 0.4 2.1 4.7
VHID2 – Less Sparse 4,573 8.8 47.7 5.6
VHID2 – Sparse 407 0.8 13.2 4.9 Urban - 42,185 81.4 21.0 5.5 Rural - 9,625 18.6 79.0 5.4 Less sparse - 51,068 98.6 84.4 5.4 Sparse - 741 1.4 15.6 4.5 Total - 51,810 100.0 100.0 5.4
1 Greater than 10,000 population
2 Village, Hamlet & Isolated Dwellings (VHID)
Source: 2009 Middle Layer Super Output Area Mid-Year Population Estimates, Office for National Statistics
Table 2 shows the predominance of the Urban – Less Sparse area type; no other area type in this report includes such a high proportion of people. There is an interesting symmetry in the difference between urban and rural areas: in England urban areas contain about 80 per cent of the population but cover roughly 20 per cent of the land area, rural areas cover roughly 80 per cent of the land and 20 per cent of the population. Some 42 million people live in urban England by this definition, and just under 10 million in rural England.
Sparse areas, which cover three narrower area types in both rural and urban areas, contain 1.4 per cent of the population. Only 15 per cent of this group are resident in urban areas and the
remainder in rural areas. The Urban – Sparse area type, in particular, is very small with a population, of 114,000, which compares, for example, to that of the 2001 Census-defined urban areas of Southport or St Albans. Sparse area types should therefore be expected to have distinct characteristics where survey data are being analysed, as sample sizes are likely to be close to the acceptable minimum. A population pyramid showing the age structure for the rural and urban populations is presented in Figure 52 on page 63.
Office for National Statistics 9
The Rural/Urban Definition (Wales)
While the Rural/Urban Definition is the same for Wales (shown in Map 3) as for England, the aggregation of area types into urban and rural wider area types can in practice be done in different ways. For example, in Wales, the Town and Fringe area types may sometimes be divided into urban and rural areas by population size. This report follows the convention of classifying all town and fringe areas as rural.
Urban – Less Sparse Urban – Sparse
Village, Hamlet & Isolated Dwellings – Sparse Village, Hamlet & Isolated Dwellings – Less Sparse Town & Fringe – Sparse
Town & Fringe – Less Sparse
Contains Ordnance Survey data © Crown copyright and database right 2011 1 Middle Layer Super Output Areas.
Source: Office for National Statistics
Wrexham Swansea Cardigan Holyhead Bangor Welshpool Aberystwyth Newtown Carmarthen Llanelli Brecon Cardiff
Map 3
The Rural/Urban Definition for MSOAs
1in Wales
Table 4 shows that according to the Rural/Urban Definition two-thirds of people in Wales live in urban areas (just below 2 million people), and a third in rural areas (just above 1 million). One in seven Welsh people live in a sparse area; these cover just over 60 per cent of the land area of Wales. With 430,000 people, this is greater than the population of any urban area in Wales from the 2001 Census (Cardiff urban area had a population of 328,000), and roughly equivalent in population size to the Bristol or Sheffield urban areas in England. Higher proportions of the total population live in each sparse area type compared with England, and in most of the rural areas types. At 11 per cent of the population, the Village, Hamlet and Isolated Dwellings (VHID) – Sparse
Office for National Statistics 10 area type is the third biggest in population terms in Wales, and one that covers more than half of the total land area.
Table 4
Key population figures for Wales: by Rural/Urban Definition
area type, 2009
Wider area
type Narrower area type
Mid-2009 population, thousands Percentage of total population Percentage of total land area Percentage change in population since 2001
Urban Urban1 – Less Sparse 1,925 64.2 12.0 3.5
Urban1 – Sparse 56 1.9 1.0 2.5
Rural Town & Fringe – Less Sparse 393 13.1 8.4 2.0
Town & Fringe – Sparse 39 1.3 1.8 1.8
VHID2 – Less Sparse 252 8.4 18.9 4.8
VHID2 – Sparse 334 11.1 57.9 3.3 Urban - 1,981 66.1 13.0 3.4 Rural - 1,018 33.9 87.0 3.1 Less sparse - 2,570 85.7 39.3 3.4 Sparse - 430 14.3 60.7 3.0 Total - 2,999 100.0 100.0 3.3
1 Greater than 10,000 population
2 Village, Hamlet & Isolated Dwellings (VHID)
Source: 2009 Middle Layer Super Output Area Mid-Year Population Estimates, Office for National Statistics
Roughly one in eight of the population lives in an area that is both rural and sparse, two in eight in less-sparse rural areas, and five in every eight in urban areas. A population pyramid showing the age structure for the population of Wales is presented in Figure 53 on page 64.
Population by area type (England and Wales)
Figure 5 shows the population of England, Wales and each English region for the six narrower area types. There are three regions that have a similar proportion of their population living in rural areas to Wales: the South West (33 per cent), the East of England (31 per cent) and the East Midlands (29 per cent). Data for Figure 5 and subsequent figures area available at:
Office for National Statistics 11
Figure 5
Population proportions: by area type, region and country,
2009
England and WalesPercentage 0 10 20 30 40 50 60 70 80 90 100 South West East East Midlands South East Yorkshire and The Humber North East West Midlands North West London Wales England
Urban – Less Sparse Urban – Sparse
Town & Fringe – Less Sparse Town & Fringe – Sparse VHID – Less Sparse VHID – Sparse
Source: 2009 Middle Layer Super Output Area Mid-Year Population Estimates,Office for National Statistics
The Rural/Urban Local Authority Classification (England)
Map 6 shows which rural/urban area type each local authority in England falls into. Note that this is based on pre-April 2009 boundaries, which gives a higher level of geographical detail for some areas than using current boundaries5. However, the methodology for the classification based on the new boundaries has been updated, with a small number of changes, mostly resulting in local authorities moving between the Significant Rural and Other Urban area types. Where new boundaries have been used in this article, this is indicated. See Appendix A for more details.
Rural local authorities exist in all regions except London. Most regions have local authorities in all six narrower area types. Note that in some cases local authority types are defined by their
population (for example, large urban local authorities have populations of 250,000 to 750,000 people);
5
On 1 April 2009 the reorganisation of some local authorities in England resulted in the creation of nine new unitary authorities, replacing 37 former local authorities (including the Isles of Scilly which is considered as a unitary authority for coding purposes).
Office for National Statistics 12 Contains Ordnance Survey data © Crown copyright and database right 2011
Major Urban Large Urban Other Urban Significant Rural Rural-50 Rural-80 Southampton Southampton Nottingham Nottingham Leicester Leicester Northampton Northampton Norwich Norwich Oxford Oxford Stoke-on-Trent Stoke-on-Trent Ipswich Ipswich Birmingham Birmingham Lincoln Lincoln Cambridge Cambridge Reading Reading Lancaster Lancaster Taunton Blackpool Leeds Lancaster Southampton Liverpool Southend-on-Sea Nottingham Exeter Leicester Northampton Carlisle Brighton and Hove Sheffield
Kingston upon Hull
Norwich Bristol Oxford Stoke-on-Trent Ipswich Manchester Birmingham Stockton-on-Tees Newcastle upon Tyne
Bournemouth Plymouth Guildford Reading Portsmouth Lincoln London Folkestone Cambridge
Map 6
The Rural/Urban Local Authority Classification (England)
Office for National Statistics 13 but the proportion of people in rural areas is used for other types (so Rural-80 local authorities have 80 per cent of their population living in rural areas). Table 7 details key population information for each area type.
Table 7
Key population figures for England: by Rural/Urban Local
Authority Classification area type, 2009
Wider area
type Narrower area type
Mid-2009 population, thousands Percentage of total population Percentage of total land area Percentage change in population since 2001
Urban Major Urban 18,183 35.1 6.0 4.5
Large Urban 7,618 14.7 4.6 4.2
Other Urban 7,119 13.7 4.7 5.1
Rural Significant Rural 6,769 13.1 16.5 5.0
Rural-50 6,047 11.7 22.8 4.8 Rural-80 6,074 11.7 45.3 5.7 Urban - 32,920 63.5 15.3 4.5 Rural - 18,890 36.5 84.7 5.2 Total - 51,810 100.0 100.0 4.8
Source: 2009 Mid-Year Population Estimates, Office for National Statistics
Nearly two-thirds of England’s population live in urban local authorities, covering around 15 per cent of the total land area. The classification splits the population into area types of roughly equal numbers of people (with the exception of the much larger Major Urban area type) and similar levels of population growth.
The local authority classification for Wales
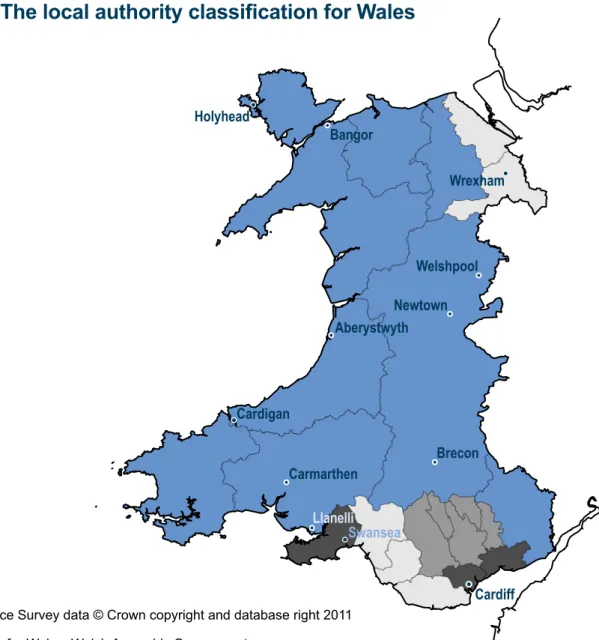
Map 8 shows the local authority rural/urban classification for Wales, used for example, in ‘A Statistical Focus on Rural Wales'. For more information, see Appendix A.
The map shows a continuous block of Rural local authority areas through the west, centre and north of the country. The Urban and Other area types are split across two different geographical blocks, in the north east and south of Wales. The Valleys local authorities are a group of ex-mining and industrial areas. The local authorities in this group contain the Heads of the Valleys Action Area which is the focus of a programme that takes action on deprivation.
All local authorities in Wales are a mix of urban and rural areas to some degree. There are urban areas within rural local authorities and the reverse.
Office for National Statistics 14 Rural
Valleys Urban
Other
Contains Ordnance Survey data © Crown copyright and database right 2011 Cardigan Wrexham Swansea Holyhead Bangor Welshpool Aberystwyth Newtown Carmarthen Llanelli Brecon Cardiff
Map 8
The local authority classification for Wales
Source: Statistics for Wales, Welsh Assembly Government
Table 9
Key population figures: by ‘local authority classification for
Wales’ area type, 2009
Wider area
type Narrower area type
Mid-2009 population, thousands Percentage of total population Percentage of total land area Percentage change in population since 2001 Urban Urban 708 3.6 3.7 5.5 Valleys 622 20.7 4.9 0.6 Other 679 22.6 9.6 3.0 Rural Rural 990 33.0 81.7 3.0 Urban - 2,009 67.0 18.3 3.1 Rural - 990 33.0 81.7 3.0 Total - 2,999 100.0 100.0 3.1
Office for National Statistics 15 Two-thirds of Wales’ population of about three million people live in urban local authorities. Such areas cover only a sixth of the total land area of Wales, as set out in Table 9. These urban local authorities are split into three narrower area types of broadly equal population size. It is interesting to note that since mid-2001, populations in the Urban narrower area type have expanded the most, while Valleys local authorities have shown the smallest population growth of any area type.
Population densities vary from nine people to every hectare in Urban local authority areas, to just one person to every two hectares in Rural ones.
The Scottish Government Urban Rural Classification
Map 10 shows the distribution of area types for Data zones in Scotland, using the classification with the largest number of area types of any of the classifications used in this article. Large Urban Areas (with populations greater than 125,000) cover Edinburgh, Glasgow, Dundee and Aberdeen. Very Remote Small Towns (which have populations between 3,000 and 10,000 people, and are more than 60 minutes by road and ferry to a settlement of more than 10,000 people) appear in all corners of the country, including the Western Isles and Shetland Isles. The sophisticated measure of remoteness, based on driving time rather than distance, makes a distinction between more accessible rural areas south of Edinburgh and Glasgow, and the more remote areas that start just a short distance north and west of Glasgow.
The proportion of the population living in urban areas according to the Scottish Rural/Urban Classification (shown in Table 11) is more than 81 per cent, covering nearly 6 per cent of
Scotland’s land area. This classification could therefore be said to give a ‘tighter’ urban group than the ‘Randall’ definition of local authorities (see below), picking up more people but covering a smaller area. Population growth rates differ too: post-2001 growth is similar in areas defined by local authorities, but far higher in rural areas when defined using Data zones. By contrast Very Remote Rural Areas contain 3 per cent of the population, but cover almost half of the land area.
Populations in all three narrower types of rural areas have shown at least moderate growth since 2001, and average 9 per cent for rural areas as a whole, which is far greater than for urban areas (1.2 per cent). The population within the Remote Small Towns and Very Remote Small Towns area types have actually declined over this period. The classification allows areas to be split by
settlement type and remoteness as well. The remote group covers some 305,000 people; the very remote group is even smaller, at 225,000 people, although this is more than the current population of Aberdeen. A population pyramid for the Scottish population is presented in Figure 54 on page 65.
Office for National Statistics 16 Inverness Wick Dundee Stirling Stornoway Glasgow Ayr Dumfries Aberdeen Fort William Edinburgh Lerwick Campbeltown Thurso Oban Kirkwall
Large Urban Areas Other Urban Areas Accessible Small Towns Remote Small Towns Very Remote Small Towns
Very Remote Rural Areas Remote Rural Areas Accessible Rural Areas
Contains Ordnance Survey data © Crown copyright and database right 2011
Source: Scottish Government
Map 10
Scottish Government Urban Rural Classification for
Data zones
Office for National Statistics 17
Table 11
Key population figures: by Scottish Government Urban
Rural Classification area type, 2009
Wider area
type Narrower area type
Mid-2009 population, thousands Percentage of total population Percentage of total land area Percentage change in population since 2001
Urban Large Urban Areas 2,023 38.9 1.2 1.9
Other Urban Areas 1,583 30.5 2.0 1.0
Accessible Small Towns 438 8.4 1.5 0.3
Remote Small Towns 130 2.5 0.7 - 0.7
Very Remote Small Towns 65 1.2 0.3 - 3.9
Rural Accessible Rural Areas 620 11.9 25.4 11.0
Remote Rural Areas 176 3.4 21.8 7.7
Very Remote Rural Areas 160 3.1 47.0 3.5
Urban - 4,238 81.6 5.8 1.2 Rural - 956 18.4 94.2 9.0 Accessible - 4,664 89.8 30.2 2.5 Remote - 305 5.9 22.5 4.0 Very remote - 225 4.3 47.3 1.3 Total - 5,194 100.0 100.0 2.6
Source: 2009 Data zone Mid-Year Population Estimates, National Records of Scotland
The 'Randall' definition of Scottish local authorities
Map 12 shows a much simpler geography than that of the small area classification in Map 10. It gives a continuous stretch of Urban local authority areas, sandwiched between Rural local
authority areas, running from Dundee in the east to the Isle of Arran, which is part of North Ayrshire local authority, in the west. Aberdeen, which lies in its own local authority area, is classified as Urban; however Inverness, which lies in the Highland Council area and has a low overall
population density, is not. These examples show why the more refined small area classification is to be preferred, if data can be produced at the appropriate geographic level.
Some 70 per cent of Scotland’s population live in the 10 per cent of the land area covered by local authorities classified as Urban, according to the ‘Randall’ definition shown in Table 13. Population densities are extremely low in Rural local authorities, with an average of one person to every five hectares of land.
Office for National Statistics 18 Contains Ordnance Survey data © Crown copyright and database right 2011
Rural Urban Wick Stornoway Aberdeen Fort William Lerwick Campbeltown Thurso Oban Kirkwall Inverness Dundee Stirling Glasgow Ayr Dumfries Edinburgh
Map 12
The 'Randall' definition of Scottish local authorities
Source: Scottish Government
Table 13
Key population figures: by 'Randall' definition of Scottish
local authorities area type, 2009
Area type Mid-2009 population, thousands Percentage of total population Percentage of total land area Percentage change in population since 2001 Urban 3,646 70.2 10.2 3.3 Rural 1,548 29.8 89.8 2.2 Total 5,194 100.0 100.0 2.6
Office for National Statistics 19
The Northern Ireland Urban-Rural Classification of settlements
The Northern Ireland settlement classification in Map 14 does not give continuous spans of
particular area types; rather it highlights and classifies particular settlements against a background of small villages, hamlets and open countryside. Less populous urban and more populous rural areas are clustered around Lough Neagh and Belfast, and lie roughly between the middle of the country and the east coast. There is a smaller cluster around Derry in the north west, but some of the larger settlements in the western part of the country are very isolated. Omagh in particular has few urban neighbours.
Contains Ordnance Survey data © Crown copyright and database right 2011
Coleraine Antrim Newry Belfast Ballymena Derry Bangor Craigavon Omagh Enniskillen Limavady Cookstown Strabane Larne
A Belfast Metropolitan Urban Area B Derry Urban Area
C Large Town D Medium Town E Small Town
H Small Village, Hamlet and Open Countryside G Village
F Intermediate Settlement
Map 14
The Northern Ireland Urban-Rural Classification of settlements
for output areas
Source: Northern Ireland Statistics and Research Agency
Of Northern Ireland’s 1.8 million inhabitants, some 36 per cent, or around two-thirds of a million, live in rural areas (Table 15). This is a slightly smaller proportion than in the local government district classification, yet it covers a much greater proportion of the land area – in other words the small area definition is much more precise. This is true of different levels of small area data too. The 2001 Census Output Area geography is used here, because data based on this geography are compatible with a number of other datasets. However, it gives a very slightly lower proportion of the population living in rural areas than data based on precise settlement boundaries.
Office for National Statistics 20
Table 15
Key
population
1figures: by Northern Ireland Urban-Rural
Classification of settlements area type, 2008
Wider area
type Settlement area type
Mid-2008 population, thousands Percentage of total population Percentage of total land area Percentage change in population since 2001
Urban A – Belfast metropolitan urban area 579 32.6 2.2 - 0.4
B – Derry urban area 93 5.2 0.5 1.1
C – Large town 237 13.4 1.5 5.2
D – Medium town 109 6.2 0.9 6.0
E – Small town 111 6.3 1.2 5.6
Rural F – Intermediate settlement 71 4.0 1.1 8.1
G – Village 77 4.4 1.9 8.3
H – Small village, hamlet and open
countryside 496 28.0 90.8 11.7
Urban - 1,130 63.6 6.2 2.0
Rural - 645 36.4 93.8 10.9
Total - 1,775 100.0 100.0 2.4
1 Population for 2001 Census Output Areas
Source: 2008 Mid-Year Small Area Population Estimates, Northern Ireland Neighbourhood Information Service
Table 15 shows band A (Belfast) is the largest settlement area type by population size, with nearly a third of the population of Northern Ireland; bands B to G are much smaller, each covering 4 to 14 per cent of the population and up to 2 per cent of the land area. More than a quarter of the
population, just less than half a million people, live in the most rural areas (band H), covering 91 per cent of the country. Population growth since 2001 has been highest in this settlement band and above average in other rural areas. A population pyramid for Northern Ireland is presented in Figure 55 on page 66.
Office for National Statistics 21
The less accessible/more accessible Northern Ireland local government district
classification
This classification, shown in Map 16, splits the country into two area types. The more accessible group of local authorities, sometimes referred to as ‘urban’, or simply ‘eastern’, is centred in and around Belfast. The less accessible group of local authorities or ‘western’ group can be used to define areas as rural, although this group includes Northern Ireland’s second most populous city, Derry.
Contains Ordnance Survey data © Crown copyright and database right 2011
Source: see Appendix A
Coleraine Newry Ballymena Belfast Bangor Derry Antrim Craigavon Omagh Enniskillen Limavady Cookstown Strabane Larne Less accessible More accessible
Map 16
Less accessible/more accessible Northern Ireland local
government district classification
Office for National Statistics 22
Table 17
Key population figures: by Northern Ireland local
government district classification area type, 2009
Area type Mid-2009 population, thousands Percentage of total population Percentage of total land area Percentage change in population since 2001
More accessible (urban) 1,092 61.0 30.8 4.4
Less accessible (rural) 697 39.0 69.2 8.3
Total 1,789 100.0 100.0 5.9
Source: 2009 Mid-Year Population Estimates, Northern Ireland Statistics and Research Agency/Office for National Statistics
Table 17 shows that the Northern Ireland local government district classification defines a larger proportion of the total population as rural than the other classifications set out in this section, at 39 per cent of the population. However, this population lives in over two-thirds of the area of the country, suggesting the classification is picking out a distinct area type. Population growth in the less accessible, western group of local authorities has been almost twice that of the more accessible group since 2001.
Working
Job locations
In 2008 the UK had an estimated 32 million jobs and 40 million people aged 16 to 64, which includes students, homemakers, those with multiple jobs, and others not actively seeking work. This jobs estimate is based on workplace location, and includes the self-employed, those on government training schemes and HM Forces. A ‘jobs density’ can be calculated by dividing the number of jobs in an area by the number of residents aged 16 to 64, and is one way of measuring disparities between the number of workers and jobs. It can be produced for local authority areas. The UK average is 0.79 jobs per person; national rates range from 0.71 in Wales to 0.80 in Scotland. This section aims to answer the question, are rural areas generally ‘dormitories’, with more workers than actual jobs? Figures 18 to 21 examine the patterns country by country.
In England two of the urban area types have the highest jobs densities, at 0.83 jobs per person for Other Urban6 and 0.82 for Major Urban, the group of local authorities covering the cities with the biggest populations. There is no clear pattern among the other area types, and differences are small overall. Of the eight rural local authorities with jobs densities above one, six are in the Rural-80 group (the most rural areas). Some are self-contained by virtue of their geography – the Isles of Scilly, for example; others have historic importance – such as Stratford-on-Avon.
6
The Other Urban area type includes cities (such as Derby), ‘historic’ towns and cities (such as Oxford and Worcester), and towns (such as Hastings and Barrow-in-Furness). For more information see Appendix A or
Office for National Statistics 23
Figure 18
Jobs densities in England: by area type, 2008
England
Jobs per person (aged 16 to 64)
0.0 0.2 0.4 0.6 0.8 1.0 Rural-80 Rural-50 Significant Rural Other Urban Large Urban Major Urban England
Source: Office for National Statistics
Of all urban local authorities, the City of London has an exceptionally high density of 37 jobs per resident aged 16 to 64; Westminster is next highest at 3.3. A number of London boroughs appear at the top and bottom of the urban rankings, with Lewisham showing the lowest jobs density in England at 0.41.
In Wales, the Valleys area type shows the lowest jobs density of any area type at 0.57 jobs per person, while local authorities in the Urban area type7 have the highest jobs density at 0.87. The Rural area type jobs density is only a little lower than that of Wales as a whole. The highest jobs density is for an Urban local authority (Newport, 0.92), the lowest in a Valleys area (Blaenau Gwent, 0.49).
7
The Urban area type in Wales includes only the most urban local authorities – Cardiff, Swansea and Newport.
Office for National Statistics 24
Figure 19
Jobs densities in Wales: by area type, 2008
Wales
Jobs per person (aged 16 to 64)
0.0 0.2 0.4 0.6 0.8 1.0 Rural Other Valleys Urban Wales
Source: Office for National Statistics
Figure 20
Jobs densities in Scotland: by area type, 2008
Scotland
Jobs per person (aged 16 to 64)
0.0 0.2 0.4 0.6 0.8 1.0
Rural Urban Scotland
Source: Office for National Statistics
There are only small differences in jobs density between Urban and Rural areas in Scotland, with Urban areas showing a jobs density of 0.81 jobs per person, compared with Rural areas at 0.77. Some of the most isolated Rural local authorities have the highest jobs densities – Highland, Shetland Islands and Orkney Islands all have densities above 0.90. However, the highest jobs
Office for National Statistics 25 density, at 1.27, is in an Urban local authority – Aberdeen City – which may relate to jobs offshore in the oil and gas industries. This is three times as high as the lowest jobs density – 0.39 in East Renfrewshire (an Urban area).
Figure 21
Jobs densities in Northern Ireland: by area type, 2008
Northern Ireland
Jobs per person (aged 16 to 64)
0.0 0.2 0.4 0.6 0.8 1.0
Less accessible More accessible Northern Ireland
Source: Office for National Statistics
The less accessible area type covering local authorities in the western part of Northern Ireland shows a lower than average jobs density, at 0.66 jobs per person. The highest value for this area type is 0.79 for Coleraine – so while this group has fewer jobs than might be expected, there are no highly isolated areas that have high jobs densities because commuting out of these areas is hard. Local authority areas in the more accessible area type vary substantially, from 0.38 in Carrickfergus to 1.33 in Belfast.
There is no evidence that rural areas are simply ‘dormitories’ in any country of the UK. If anything, urban areas could be said to contain a higher proportion of more ‘dormitory’ local authorities, with the highest and lowest jobs densities tending to appear in urban areas.
Office for National Statistics 26
Working patterns
ONS’s Annual Population Survey (APS) is an on-going social survey based on the Labour Force Survey, which asks a large sample of people a variety of questions about working life. The records include the Rural/Urban (MSOA) Definition area type; Figure 22 examines the urban/rural and less sparse/sparse dimensions. It is worth noting that some aspects of working life not shown here, such as patterns of part-time working, display only very small differences across area types.
Figure 22
Working patterns in England: by area group, 2009/10
England Percentages 0 5 10 15 20 25 30 35 40 Underemployed Worked overtime Second job Higher managerial/ professional occupation Never worked, unemployed, not classified Self-employed Home working/based Rural Urban 0 5 10 15 20 25 30 35 40 Underemployed Worked overtime Second job Higher managerial/ professional occupation Never worked, unemployed, not classified Self-employed Home working/based
Sparse Less sparse
Note: All variables refer to proportions of people estimated to be in employment except the ‘never worked’ and ‘higher managerial’ groups, which refer to estimates of all people aged 16–64
Source: Annual Population Survey, Office for National Statistics
Self-employment and working from home (or being based at home) are both more common in rural areas of England than in urban areas. They are more common still in sparse areas, where people are twice as likely to be home-based or self-employed, as those in less sparse areas (one in four in sparse areas compared with roughly one in eight in less sparse areas). While Figure 18 shows that there are fewer jobs per worker than average in rural areas, Figure 22 shows that people access work in different ways in both rural and sparse areas compared with urban and less sparse areas.
Office for National Statistics 27 Rural areas have slightly higher proportions of people in higher managerial and professional occupations (12 per cent of people aged 16 to 64 compared with less than 10 per cent in urban areas), and lower proportions of people who have never worked (which include students) than urban areas. Interestingly, sparse areas show the reverse pattern, with about half the proportion of people in the higher managerial and professional occupation (some 6 per cent) compared with rural areas.
The APS asks a number of questions to estimate how many people want or need to work more than the standard hours for their job. There is no clear pattern in the results – respondents in urban or less sparse areas are somewhat more likely to have worked overtime recently, and to want to work more hours at their current rate of pay (classified as ‘underemployed’). Likewise, respondents in sparse areas are more likely than those in less sparse areas to have a second job (7 per cent of workers compared with 4 per cent in less sparse areas). Figure 23 shows the same data for Wales.
Working patterns in Wales show very similar rural/urban differences to those in England. Working based from home or being self employed are far more common in both rural and sparse areas than in urban and less sparse areas. Workers in higher managerial or professional occupations are slightly more common in rural areas and less common in sparse ones. There are only small differences in the proportions of people with second jobs; however, working overtime and wanting to work more hours at the same rate of pay (underemployment) are more common in urban and in less sparse areas.
Office for National Statistics 28
Figure 23
Working patterns in Wales: by area group, 2009/10
Wales Percentages 0 5 10 15 20 25 30 35 40 Underemployed Worked overtime Second job Higher managerial/ professional occupation Never worked, unemployed, not classified Self-employed Home working/based Rural Urban 0 5 10 15 20 25 30 35 40 Underemployed Worked overtime Second job Higher managerial/ professional occupation Never worked, unemployed, not classified Self-employed Home working/based
Sparse Less sparse
Note: All variables refer to proportions of people estimated to be in employment except the ‘never worked’ and ‘higher managerial’ groups, which refer to estimates of all people aged 16–64
Source: Annual Population Survey, Office for National Statistics
Employers
The ONS Inter-Departmental Business Register (IDBR), from which the following data are taken, covers the vast majority of UK economic activity, using administrative records and survey
estimates. The 2010 IDBR details nearly 2.2 million ‘local units’ in England, and around a further 113,000 in Wales. A local unit is defined as an individual business site, such as a branch of a national retail chain, located in a geographically identifiable place, as opposed to the parent ‘enterprise’ such as a head office. Local units are sometimes referred to as ‘businesses’, however, it is important to remember that they include public sector employers as well as those in the private sector. Figure 24 shows which of the 17 industries8 showed the biggest differences in prevalence between rural and urban areas, using the small area (MSOA) Rural/Urban Definition. Is the rural economy dominated by farming?
8
These 17 industries are derived from the United Kingdom Standard Industrial Classification of Economic Activities (SIC) 2007. For more information see: www.statistics.gov.uk/statbase/Product.asp?vlnk=14012
Office for National Statistics 29 There were nearly 560,000 rural local units in England in 2010, representing a quarter of all
businesses (or some 23 per cent when agriculture, forestry and fishing units are excluded). Given that 19 per cent of all people live in rural areas, the prevalence of local units in rural areas might be greater than that expected, even when agriculture, forestry and fishing is excluded.
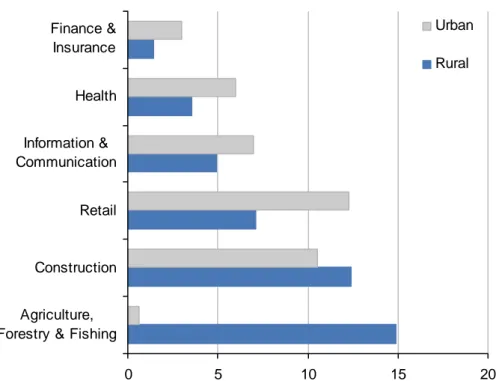
Figure 24
Local business units in England for selected industries: by
area type, 2010
EnglandPercentage of all businesses for area type
0 5 10 15 20
Agriculture, Forestry & Fishing
Construction Retail Information & Communication Health Finance & Insurance Urban Rural
Note: The chart shows separate breakdowns of local business units for urban and rural areas by Broad Industry Group Source: Inter-Departmental Business Register, Office for National Statistics
Figure 24 shows some of the largest percentage point differences in the prevalence of businesses in urban and rural areas by broad industry group. Just under 15 per cent of all rural local units were in the agriculture, forestry and fishing category, while retail represents a notably higher proportion of local units in urban areas. Construction has a higher proportion of the industry mix in rural areas than in urban areas, with one in eight Rural area units being in that industry. None of the 17 broad industry groups are absent from rural areas, with finance and insurance having the smallest proportion of total units by broad industry group in rural areas. Public administration and defence units, not shown, are also noticeably more prevalent in urban than rural areas, with just 18 per cent of these located in rural areas (compared with 26 per cent of all units).
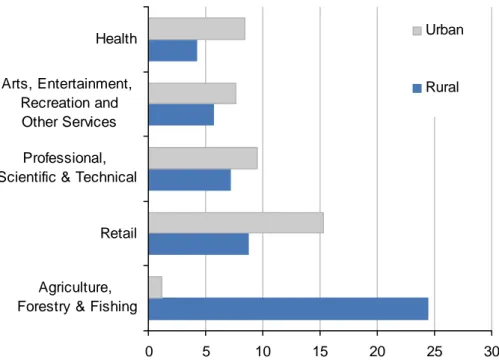
Nearly half of Wales’ 110,000 local units were located in rural areas. When agriculture, forestry and fishing local units are excluded, this falls to 42 per cent of all local units. When compared with the population living in rural areas (34 per cent of the total population) this is higher than might be
Office for National Statistics 30 expected. Just under a quarter of all rural businesses were in the agriculture, forestry and fishing sector.
Figure 25
Local business units in Wales for selected industries: by
area type, 2010
WalesPercentage of all businesses for area type
0 5 10 15 20 25 30
Agriculture, Forestry & Fishing
Retail Professional, Scientific & Technical
Arts, Entertainment, Recreation and Other Services
Health Urban
Rural
Note: The chart shows separate breakdowns of all local business units for urban and rural areas by Broad Industry Group
Source: Inter-Departmental Business Register, Office for National Statistics
Figure 25 shows that several industries, and especially the retail category, have a higher share of the industry mix in urban areas than in rural areas. As is the case in England, there is no industry that shows a very strong urban or rural predominance, beyond agriculture, forestry and fishing. Public administration and defence local units (not shown) are less likely to be located in a rural area than local units are in general, with 37 per cent of such units present here. Two industries, health and finance and insurance (not shown), had fewer than a third of their units in rural areas (at 32 per cent in both cases).
In relation to their resident population, rural areas are home to a relatively high proportion of local units and they are more likely to be small employers. Some 75 per cent of rural units in both England and Wales have fewer than five employees; this compares with 66 per cent of urban local units in England and just under 60 per cent in Wales.
Office for National Statistics 31
Unemployment and inactivity
The APS is the main source for official unemployment estimates at sub-regional level. Bespoke data were obtained from the survey using the more geographically detailed 2001 Census Output Area level definition, which separates ‘Villages’ from ‘Hamlets and Isolated Dwellings’. A
disadvantage of looking at data this way is that sample sizes for the smallest area types, such as Very Remote Rural areas in Scotland, for example, will give less reliable results than for more populous area types. Figure 26 shows three key measures of economic activity for England for the financial year 2009/10 using the Output Area level definition. Figures 26 to 28 reflect an
aggregation of narrower area types.
Figure 26
Labour market activity in England: by area type, 2009/10
England
Percentage point difference from England average
-6 -4 -2 0 2 4 6 8 10
Rural Urban Sparse Less Sparse Hamlet & Isolated
Dwellings Village Town & Fringe Urban
Employment Rate Unemployment Rate Economic Inactivity Rate
Note: employment and inactivity rates are based on the population aged 16–64; unemployment also takes account of adults of any age who are in work or seeking work (economically active).
Source: Annual Population Survey, Office for National Statistics
Some 7.9 per cent of the economically active population of England was estimated to be unemployed in 2009/10, and 23 per cent of the population aged 16 to 64 was economically
Office for National Statistics 32 inactive. The rural/urban unemployment rates show clear differences, ranging from an estimated 8.6 per cent in urban areas (1.8 million people), to 5.2 per cent in rural areas (260,000 people).
The employment rate is higher and inactivity rate lower than the national average in rural areas. In the most rural settlement types unemployment was estimated at just 4 per cent, just over half the national average. Sparse areas differ in their labour market characteristics from rural areas9. On average, sparse areas have a relatively low unemployment rate close to that of the whole rural group, but a rate of economic inactivity that is only slightly below average.
Inactivity covers a broad range of circumstances. In rural areas generally, and in all three rural area types, below national average proportions of the population (aged 16 to 64) are economically inactive students, home-makers, or sick/disabled. However, there are above national average proportions of early retired people. Figure 27 shows the equivalent data for Wales.
The rural/urban differences in Wales are generally smaller than in England. Unemployment is estimated at 6.2 per cent in rural areas, and is roughly half as high again in urban areas, at 9.6 per cent. Interestingly, all three labour market rates are close to average in Town and Fringe areas; the rural pattern is only seen in the Village, and Hamlet and Isolated Dwellings settlement types, where unemployment is less than two-thirds of the national average.
9
The sparse group in both England and Wales is made up of a small proportion of all the rural areas, and an even smaller proportion of all urban areas.
Office for National Statistics 33
Figure 27
Labour market activity in Wales: by area type, 2009/10
Wales
Percentage point difference from England and Wales average
-6 -4 -2 0 2 4 6 8 10
Rural Urban Sparse Less Sparse Hamlet & Isolated
Dwellings Village Town & Fringe Urban
Employment Rate Unemployment Rate Economic Inactivity Rate
Note: employment and inactivity rates are based on the population aged 16–64; unemployment also takes account of adults of any age who are in work or seeking work (economically active).
Source: Annual Population Survey, Office for National Statistics
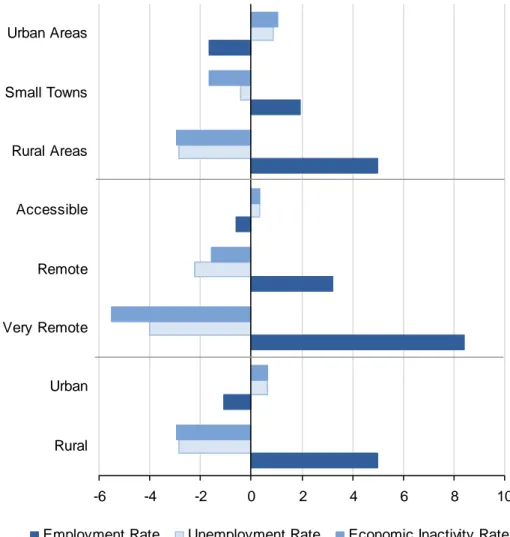
Figure 28 shows the equivalent data for Scotland. Some 7.3 per cent of the economically active population was estimated to be unemployed in 2009/10, and 23 per cent of the population aged 16 to 64 was economically inactive. There is a very strong rural/urban difference in Scottish working life. While in Urban Areas the unemployment rate was estimated to be 8.0 per cent, and 24 per cent of people aged 16 to 64 were economically inactive, Rural Areas had corresponding rates of 4.5 per cent and 20 per cent.
Office for National Statistics 34
Figure 28
Labour market activity in Scotland: by area type, 2009/10
Scotland
Percentage point difference from Scottish average
-6 -4 -2 0 2 4 6 8 10 Rural Urban Very Remote Remote Accessible Rural Areas Small Towns Urban Areas
Employment Rate Unemployment Rate Economic Inactivity Rate
Note: Employment and inactivity rates are based on the population aged 16–64; unemployment also takes account of adults of any age who are in work or seeking work (economically active).
Source: Annual Population Survey, Office for National Statistics
Compared with Scotland as a whole, economically inactive students or sick/disabled people represent lower proportions of the rural population aged 16 to 64; similar proportions are looking after homes or families, and a higher proportion of people are early-retired. Small Towns have employment and unemployment rates lying between those for Urban and Rural Areas; however, economic inactivity rates, and specific types of inactivity, are closer to those for rural areas generally.
Very Remote areas10 had the highest employment rates at an estimated 80 per cent of the
population aged 16 to 64 and Accessible areas the lowest at 71 per cent. The unemployment rate in very remote areas, at 3.3 per cent, was less than half that for Scotland as a whole.
Unemployment rates for Remote areas show rates in between those of Very Remote and Accessible areas.
10
Office for National Statistics 35
Income and earnings
Average incomes
Differences in income, as distinct from earnings or overall wealth (which is difficult to measure at small area level), are a useful indicator of economic wellbeing. Modelled data for MSOAs show that in 2007/08 the average weekly gross income per household in England was £670, and £540 in Wales. When taking account of household composition (a process known as ‘equivalisation’), deductions such as tax, and housing costs, incomes fell to £420 and £380 respectively. Figure 29 shows how incomes in England vary by area type, using the small area (MSOA) definition. Are incomes higher in one type of area?
Considering areas by their rurality and sparsity, however income is measured; the most rural and the least sparse areas perform better. Total weekly income was as high as £751 per week in Village, Hamlet and Isolated Dwellings – Less Sparse (VHID – Less Sparse) households (equivalent to about £39,000 a year), and as low as £533 in Urban – Sparse households11 (or about £28,000 a year). Urban – Sparse areas had lower incomes than average, ranging from 79 per cent of the national average when using total income, to 83 per cent when taking household structures into account (either before or after household costs). Among less sparse areas there is greater variation in incomes. The highest earning 10 per cent of Urban – Less Sparse MSOAs had almost twice the total income of the bottom 10 per cent of MSOAs. Wales, not shown in Figure 29, shows similar patterns of differences between area types; however, the variations in income between area types tend to be smaller in value.
11
Urban – Sparse areas are a very small group of MSOAs spread across England and Wales, covering settlements such as Berwick-upon-Tweed, Scarborough, Aberystwyth and Carmarthen.
Office for National Statistics 36
Figure 29
Average weekly household income: by area type, 2007/08
England
Difference from English mean weekly household income (£)
-160 -140 -120 -100 -80 -60 -40 -20 0 20 40 60 80 100 VHID – Sparse
VHID – Less Sparse Town & Fringe –
Sparse Town & Fringe –
Less Sparse Urban – Sparse
Urban – Less Sparse
Total Income Net income
Net income (EQ, BHC) Net income (EQ, AHC)
Note: Equivalised (EQ) incomes adjust for different household structures; these income measures are shown before and after housing costs (BHC and AHC).
Source: MSOA Model-Based Income Estimates, Office for National Statistics
Poverty
Poverty is conventionally measured by the proportion of all households that fall below the
recognised poverty threshold, which is set at 60 per cent of the England and Wales mean weekly equivalised income (after housing costs). In 2007/08 for England and Wales this was estimated at £199 per week (or £862 per month). Figure 30 shows how poverty rates in Wales varied by small area (MSOA) type.
Office for National Statistics 37
Figure 30
Percentage of households below poverty threshold: by
area type, 2007/08
Wales Percentages 0 5 10 15 20 25 30 VHID – Sparse VHID – Less Sparse Town & Fringe –Sparse Town & Fringe –
Less Sparse Urban – Sparse
Urban – Less Sparse
Source: MSOA Model Based Estimates of Households in Poverty, Office for National Statistics
Both sparsity and rurality appear to affect poverty levels. VHID – Less Sparse12 areas have the lowest estimated poverty rate at one household in five. Sparse areas that fall into the town and fringe or urban settlement types have the highest proportions of households below the poverty threshold; however, results may be less reliable for these areas because they each contain very small proportions of the total population and are more difficult to estimate. No area type is poverty free – there is often more variation within area types than there is between them.
England shows similar differences by area type; however, the two Town and Fringe area types have lower relative poverty. Both types of less-sparse rural area (Town and Fringe and VHID) show well below average poverty levels for England.
Across England and Wales there were 75 MSOAs where more than 50 per cent of households were in poverty, all in urban areas. Of these MSOAs only one was in Wales (in Cardiff) and 21 were in Birmingham. The highest percentage of households in poverty was in a Leicester MSOA at 68 per cent; the lowest level, at less than 5 per cent of households, was an MSOA in Wokingham, Berkshire. Both these MSOAs are classed as Urban – Less Sparse.
12
Village, Hamlet and Isolated Dwellings (VHID) areas are the most rural types of LSOA or MSOA for the rural/urban definition for England and Wales – see Classifications section or Appendix A for more details.
Office for National Statistics 38
Earnings flow
The rural/urban differences in income suggest investigating the flow of earnings for people who earn in one area type and live in another area type. Are rural/urban areas self-sufficient, or dependent on well-paid jobs elsewhere? The ONS Annual Survey of Hours and Earnings (ASHE) estimates workers’ earnings based on both where people live and where they work, at local authority level13. The data in Figures 31 to 32 reflect a snapshot of weekly average earnings as at 1 April 2010. Areas types with a ‘positive’ flow are those where workers living in the area,
regardless of where they work, earn more on average than those whose jobs are located in the area, regardless of where they live.
In England all three rural local authority area types have a positive earnings balance for each identified employee type (Figure 31). Differences in the levels of these positive balances are similar for all three rural area types, suggesting that this situation doesn’t just cover people in rural areas adjacent to urban ones, commuting out to take high paid jobs. Conversely earnings are ‘flowing out’ of Major Urban areas at a higher level than in any other area type (that is, employees living in these areas earn less than those working there). The rural/urban earnings flow is much more pronounced for male and full-time workers, although it is important to recognise that more men than women work full-time.
13
Local authority areas after the April 2009 boundary reorganisation are used; the classification for these local authorities uses a slightly different methodology from that used for the pre-2009 boundaries shown in
Office for National Statistics 39
Figure 31
Flow of earnings in England: by area and earner type, 2010
England
Average residential incomes minus average workplace incomes (£ per week)
-60 -40 -20 0 20 40 60 80 100 Female employees Male employees Part-time employees Full-time employees All employees
Rural-80 Rural-50 Significant Rural Other Urban Large Urban Major Urban Source: Annual Survey of Hours and Earnings, Office for National Statistics
In Wales, for all types of employees, there is a net flow of earnings into Rural local authority areas from non-rural areas; and overall earnings are also flowing into Urban area type local authorities (Figure 32). For the Other14 area type, there is a net earnings outflow for males employees but a larger net earnings inflow for female employees. For both Other and Valleys local authority areas there is a net earnings outflow for all employees, though a net earnings inflow for part-time
employees in Valleys areas. These findings suggest that there are important gender differences in earning flows, with women bringing net earnings into Rural and Other areas, and out of Valleys and Urban areas.
14
Other areas in Wales includes local authorities in the north such as Wrexham, and local authorities in the south such as Bridgend – see Map 8 for more information.
Office for National Statistics 40
Figure 32
Flow of earnings in Wales: by area and earner type, 2010
Wales
Average residential incomes minus average workplace incomes (£ per week)
-20 -10 0 10 20 30 40 50 Female employees Male employees Part-time employees Full-time employees All employees
Rural Other Valleys Urban Source: Annual Survey of Hours and Earnings, Office for National Statistics
Within Scotland there is a net earnings flow from Urban local authorities into Rural ones. This effect is more pronounced for full-time and male workers.