Ten-Year Recidivism Follow-Up
Of 1989 Sex Offender Releases
Bob Taft
Reginald A. Wilkinson
Governor Director
State of Ohio
Department of Rehabilitation and Correction
Ten-Year Recidivism Follow-Up
Of 1989 Sex Offender Releases
Office of Policy
Dr. Maureen S. Black, Deputy Director
Bureau of Planning and Evaluation
Evalyn Parks, Chief
Paul Konicek, Principal Researcher
April 2001
EXECUTIVE SUMMARY
The
baseline recidivism rate of sex offenders
followed-up for
ten years
after
release from prison was
34%.
This rate was comprised of:
Recommitment for a New Crime
22.3 %
Sex Offense
8.0 %
Non-Sex Offense
14.3 %
Recommitment for a Technical Violation
11.7 %
Sex Offense
1.3 %
Sex Lapse
1.7 %
Non-sex Related
8.7 %
The total
sex-related recidivism rate
, including technical violations of
supervision conditions, was
11.0%
.
Recidivism rates differed considerably based on a victim typology:
Sex offender type
General recidivism
Sex recidivism
Rapists – (adult victims)
56.6%
17.5%
Child Molester – extrafamilial
29.2%
8.7%
Child Molester – incest
13.2%
7.4%
Sex offenders who returned for a new sex related offense did so within a few
years of release. Of all the sex offenders who came back to an Ohio prison for
a new sex offense, one half did so
within two years
, and two-thirds
within
three years
.
Paroled Sex offenders completing
basic sex offender programming
(level 1)
while incarcerated appeared to have a somewhat lower recidivism rate than those
who did not have programming. This was true both for recidivism of any type
(33.9% with programming recidivated compared with 55.3% without
programming) and sex-related recidivism (7.1% with programming recidivated
compared with 16.5% without programming).
TABLE OF CONTENTS SECTION PAGE METHODOLOGY……… 1 DEMOGRAPHICS……… 2 VICTIM INFORMATION……… 4 TYPOLOGY………. 5 RECIDIVISM……… 7 GENERAL RECIDIVISM………. 8 SEX RECIDIVISM……… 10
SEX OFFENDER PROGRAMMING……….. 15
RISK SCORES……….. 19
POLICY IMPLICATIONS……… 22
SUMMARY………... 24
In an effort to understand the nature of recidivism for the sex offender population, the Ohio Department of Rehabilitation and Correction (ODRC) has conducted a ten-year follow-up study of sex offenders released from Ohio prisons in 1989. The following report examined characteristics of 879 sex offenders. Information on the rate of return to Ohio prisons for any new offense including technical violations was collected, with particular interest given to the number of new sex offenses.
METHODOLOGY
This study examined the data from 14,261 offenders released from Ohio prisons in 1989. The Department maintains a database that contains records on all inmates in the state prison system. This database tracks entrance and release dates, as well as institutional transfers. It also contains sentencing, and demographics data. Data on conviction offenses allowed us to determine the number of offenders that had been incarcerated for a sex offense, based on the Ohio Criminal Code that aggregates into chapter 2907 all offenses considered sex offenses. This method of selecting sex offenders could potentially under-select, as there is always the possibility that an offender committed a sex related offense, but was convicted of a crime that is not part of the criminal code sex offense crime list. For example, an offender who committed a kidnapping and rape may have been able to plea-bargain both charges down to abduction. The abduction offense is not considered a sex offense, although a sexual assault may have occurred.
All offenders committed for crimes considered sex offenses were initially selected for this study. Details of the offense were examined and coded, resulting in some cases being eliminated. For purposes of this study, those committed for prostitution offenses were omitted. There were 879 sex offenders released from Ohio prisons in 1989, or 6% of those released.
The follow-up period for this cohort was ten years. One important consideration for most recidivism questions is the empirical finding that the longer the follow-up period, the larger the percentage of offenders who are known to have relapsed (Gibbons, Soothill, & Way, 1981). Given that many sex offenses go undetected, the number of known recidivists after ten years may well be a more accurate reflection of the number who have actually recommitted an offense than is the number of known recidivists after two years (as it may take a long time for some offenders to get caught). Because most recidivism studies seek to determine how many offenders are repeating unlawful behavior, it is generally true that the longer the follow-up period, the more accurate the results (Furby, Weinrott & Blackshaw, 1989).
Recidivism studies employ a variety of measures to determine the rate at which offenders recidivate. Re-arrest, re-conviction and re-incarceration are commonly used. The question of which measure to use is debated in criminological literature. For this study it was decided it would be most feasible to use re-incarceration data. While it was the most convenient, there are drawbacks to this measure. In looking at general recidivism (return to prison for any type of crime, or violation of supervision), there will undoubtedly be a certain number of new crimes committed by this release cohort for which the offender will not be
re-incarcerated, thus underestimating recidivism (Prentky, Lee, Knight & Cerce, 1997). Only those offenses serious enough to warrant a prison sentence will be captured. Thus the rates will be lower than re-arrest or even re-conviction measures. This will be true for new sex offense recidivism as well, however, it is likely this under-representation would be smaller, as a prior sex offender with a new sex offense charge would be unlikely to receive a non-prison sentence. No matter what measure is used, the actual re-offending behavior cannot be completely known, as some offenders are certain to commit new crimes without being caught. This may be particularly true for sex offenses because they are among the most underreported offense types and may often go undetected (Furby, Weinrott & Blackshaw, 1989).
Another issue concerning the reported recidivism rates is that offenders who were released from Ohio prisons, and subsequently incarcerated in another state were removed from this analysis. This is because the Department does not currently have access to corrections data from any state except Ohio. For these reasons, the new sex offense recidivism rate should be considered a conservative estimate of the actual level of sexual re-offending.
DEMOGRAPHICS
The sex offenders released in 1989 were compared to the other inmates released that year. The following five demographic variables were used for comparison (see Table 1).
Age at admission: It is commonly found that sex offenders tend to be older than other types of offenders (Greenfeld, 1997; State of New York, n.d.). This population shows similar findings. The sex offenders as a group were older at the time of admission to prison. The average admission age for sex offenders was 31, or three years older than the average age of all other offenders. A closer look at this population revealed that within sex offenders there are differences in the average age, based on the type of sex offender (see Table 5).
Race: This sex offender cohort once again falls in line with other studies that found that white offenders make up a higher proportion of the sex offender population than other races (Greenfeld, 1997, State of New York, n.d.).
Sex: Most sex offenders are male. This is consistently shown in studies of sex offenders, and can be clearly seen in examining jail and prison population reports (ODRC census report, 1998). Although women comprise about 12% of all other types of offenders, they make up only about 1% of the sex offenders in this study.
Region: Most criminal offenders entering Ohio prisons tend to come from urban areas (ODRC commitment report, 1999). While this holds true for sex offenders as well, a larger proportion of sex offenders (47%, versus 37% of all other offenders) were committed from rural counties.
Release Type: In this study fewer sex offenders were given a flat sentence (44%, compared with 53% of non-sex offenders) and were more likely to have been released on parole (38%, versus 28% of the non-sex offenders).
TABLE 1: OFFENDER DEMOGRAPHICS
SEX OFFENDERS OTHER RELEASES AGE AT ADMISSION Number Percent Number Percent
Below 21 yrs 109 12.4% 2153 16.1% 21 to 25 186 21.2% 3871 28.9% 26 to 30 200 22.8% 3063 22.9% 31 to 35 136 15.5% 2164 16.2% 36 to 40 112 12.7% 1161 8.7% 41 to 60 114 13.0% 883 6.6% Over 60 yrs 22 2.5% 87 .7% Average age 31.18 28.20 RACE Black 293 33.3% 6741 50.4% White 586 66.7% 6641 49.6% SEX Male 869 98.9% 11746 87.8% Female 10 1.1% 1636 12.2% REGION1 Urban area 462 52.5% 8442 63.1% Rural area 417 47.5% 4940 36.9% TYPE OF RELEASE Shock Probation 147 16.7% 2150 16.1% Shock Parole 271 2.0% Parole 339 38.6% 3748 28.0% Sentence Expired 393 44.7% 7213 53.9%
The State of Ohio Criminal Code defines four major categories for sex offenders. Rape is defined as sexual intercourse with another, by force. Sexual Battery is a somewhat broader offense and is defined as sexual conduct by coercion. Gross Sexual Imposition is different in scope, as it applies to persons having sexual contact, (i.e. touching, or fondling) with an unwilling person. Corruption of a Minor occurs when a person who is 18 years or older engages in sexual conduct with another person who is less than sixteen but older than 13 years of age. If the offender is less than four years older than the victim, the crime is considered a misdemeanor, and the offender generally does not serve time in prison.
1
Six Ohio counties make up 44% of the total population of Ohio, based on 1990 census figures. These six counties, Cuyahoga, Franklin, Hamilton, Lucas, Montgomery, and Summit, average 798,000 people. The other 82 counties average a population of 73,000.
TABLE 2: SEX OFFENSE CONVICTION
OFFENSE FREQUENCY PERCENT
Gross Sexual Imposition 352 40.0%
Rape 247 28.1%
Sexual Battery 202 23.0%
Corruption of Minor 71 8.1%
Other sex offense* 7 .8%
TOTAL 879 100.0%
* Other sex offenses include: Disseminating material harmful to juveniles, sexual imposition, sodomy, pandering, illegal use of minor in nudity oriented material, & pandering sexual material to a minor.
Sex offenders in this study were most likely to have been incarcerated for the crime of Gross Sexual Imposition (GSI). Forty percent had been convicted of this crime. Another 28% had been convicted of Rape, followed by 23% who were imprisoned for the crime of Sexual Battery. A smaller number had been convicted of Corruption of a Minor (8.1%). These numbers help to gain insight into the number of offenders convicted of certain offenses but give us little help in understanding the nature of the sex offense or anything about the victims. An offender’s conviction offense is often the product of a plea bargain (Sourcebook, 1999). It is more useful to examine victim information in order to classify sex offenders.
VICTIM INFORMATION
Information on the characteristics of the victims of sex offenders was collected by looking at departmental records for each offender. Pre-sentence investigations, containing official reports on the details of the offense, were valuable in determining the age and sex of the victim, as well as the relationship of the victim to the offender.
The majority of the victims of this sex offender population were of a young age. Almost half were under 13 years old, with another 22% being between the ages of 13 and 17. Adult victims were the targets of 26% of the sex offenders. While the number of young victims may seem unusually high, these findings are quite similar to other studies (Greenfeld, 1997). Another DRC study of sex offenders admitted to prison in 1992 reported that 26% of the victims of that group of sex offenders were adult; the remaining 74% were of children under age 18 (Pribe, 1995).
The vast majority of the victims of sex offenses are female. A national study found that 94% of rape victims were female, and the rate for other sexual assault victims was 84% female (Greenfeld, 1997). In this study, females were the victims in 86% of the cases, while males were the sole targets in 9%. Another 3% of the offenders victimized both males and females. The offender / victim relationship was also examined, resulting in 3 different categories: Stranger, Acquaintance, and Relative. The stranger category was comprised of victims who had no previous contact with the offender (for instance, a woman abducted off the street by an unknown assailant). Acquaintances were defined as victims who had at least some level
of contact with the offender. This could be a neighbor, or even someone the victim met at a bar. The Relative category was defined as victims who were blood relatives. (For the purposes of this study, victims that were not directly related to the offender, such as stepchildren, were placed in the acquaintance category). Strangers were the victims in 17% of the cases. Relatives made up another 16%. With the exception of 3.5% of the offenders whose victims fell within more than one relationship category, the remainder of the victims (60%) were acquaintances of the offender.
TABLE 3: VICTIM CHARACTERISTICS
AGE OF VICTIM FREQUENCY PERCENT
Under 13 yrs 401 45.6% Age 13 – 17 201 22.9% Over 18 228 25.9% Multiple ages 31 3.5% Missing data 18 2.0% TOTAL 879 100.0% SEX OF VICTIM Male 83 9.4% Female 760 86.5% Both 28 3.2% Missing data 8 .9% TOTAL 879 100.0% VICTIM/OFFENDER RELATIONSHIP Stranger 152 17.3% Acquaintance 528 60.1% Relative 144 16.4% Multiple relationships 31 3.5% Missing data 24 2.7% TOTAL 879 100.0% TYPOLOGY
Sex offenders are often categorized by characteristics of their victims in an effort to develop typologies. These typologies help social scientists understand the differences among sex offenders as a whole. The two general categories in which sex offenders are typically classified are Rapists and Child molesters. Rapists are those offenders who have adult victims. (Note that they need not have been convicted of the crime of rape). Child molesters are sex offenders who victimized someone who was under the age of 18. This category is divided further into extrafamilial child molesters who had a victim that was unrelated to the
offender (either acquaintance, or stranger), and incest child molesters who victimized a blood relative.2
TABLE 4: SEX OFFENDER TYPOLOGY
TYPE FREQUENCY PERCENT
Rapist (adult victim) 228 25.9%
Child molester – extrafamilial 473 53.8%
Child molester – incest 136 15.5%
Missing data 42 4.8%
TOTAL 879 100.0%
It was previously noted that sex offenders tend to be older than other types of offenders. However, by looking at the variable offender’s age at commitment, by type of sex offender
(Table 5) it can be seen that there are differences within the overall category of sex offenders. Rapists tended to be younger; at about 28 years old they were close to the average age of all other types of non-sex offenders. Child molesters (of both varieties) on average tended to be older. Incest offenders, on average, were almost five years older than rapists.
TABLE 5: AGE AT COMMITMENT BY SEX OFFENDER TYPOLOGY
TYPE AVERAGE AGE NUMBER
Rapist (adult victim) 27.93 228
Child molester – extrafamilial 31.44 473 Child molester – incest 34.73 136 Missing n=42
The race of sex offenders is markedly different depending upon the type of sex offender. A majority of those in the category of Rapist were Black (60%), while the other two child molester categories are predominantly made up of Whites (75% and 80%).
TABLE 6: RACE BY SEX OFFENDER TYPOLOGY RACE TYPE
Black White
Rapists 137 60.1% 91 39.9%
Child molester – extrafamilial 116 24.5% 357 75.5% Child Molester – incest 26 19.1% 110 80.9% Missing n=42
By looking at commitment county (Table 7) one can gain an understanding of the general type of environment from which individuals set to prison for a sex offense came. Rapists were the most likely to have come from a large urban area while child molesters were more
2
For the purposes of this study those who victimized their step children were not considered incest child molesters, but were categorized as extrafamilial child molesters. However, an alternative typology placing step child abusers with incest perpetrators (not shown here) was developed, and the corresponding cross tabulations were similar to those reported.
likely to have been sent from a more rural area. (This effect generally remained true even after controlling for race).
TABLE 7: COMMITMENT COUNTY BY SEX OFFENDER TYPOLOGY COMMITMENT COUNTY TYPE
Large Urban County All other counties
Rapists (Adult victims) 168 73.7% 60 26.3%
Child Molesters – extrafamilial 216 45.7% 257 54.3%
Child Molesters – incest 53 39.0% 83 61.0%
Missing n=42
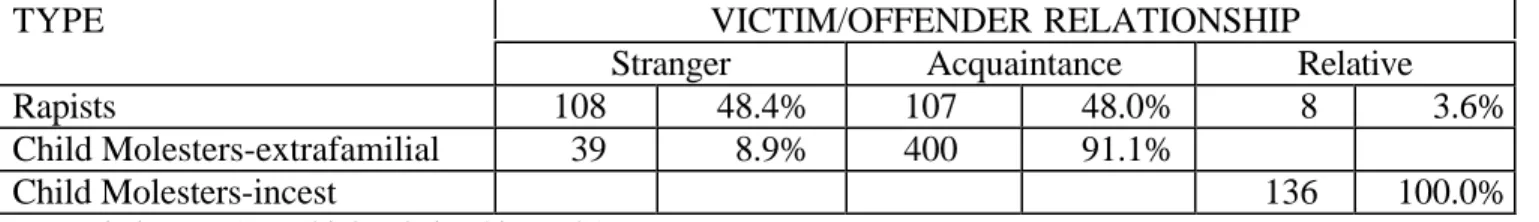
TABLE 8: VICTIM/OFFENDER RELATIONSHIP BY SEX OFFENDER TYPOLOGY VICTIM/OFFENDER RELATIONSHIP TYPE
Stranger Acquaintance Relative
Rapists 108 48.4% 107 48.0% 8 3.6%
Child Molesters-extrafamilial 39 8.9% 400 91.1%
Child Molesters-incest 136 100.0%
Missing n=56, multiple relationships n=25
One of the common misconceptions about sex offenders is that most victims are strangers to the offender. Table 8 shows that there are significant differences between the type of sex offenders, in the relationship of the offender to the victim. While many of the adult victims were strangers to the offender, few of the child victims were strangers.
TABLE 9: AVERAGE TIME SERVED (IN MONTHS) BY SEX OFFENDER TYPOLOGY
TYPE AVERAGE TIME
SERVED (IN MONTHS) Rapist (adult victim) 60.42
Child Molester-extrafamilial 29.79 Child molester-incest 22.06
The Rapists spent an average of sixty months in prison for their offense (Table 9). Extrafamilial child molesters were incarcerated for an average of about thirty months. Offenders who victimized underage family members spent the least amount of time in prison. RECIDIVISM
It is common for recidivism studies dealing with sex offenders to look at recidivism on two different levels. The first is general recidivism, which concerns any type of new offenses, and the second is sex offense recidivism, which focuses on crimes that are of a sexual nature.
General recidivism
Some researchers believe that limiting a sex offender recidivism study to the outcome measure of new sex offenses means that valuable information is lost (Schwartz, 1995). Due to the common practice of plea bargaining, sometimes the sex offense portion of a charge is dropped. For this reason, looking at all new crimes and technical violations of supervision can be useful.
TABLE 10: SEX OFFENDER RECIDIVISM (GENERAL) FREQUENCY PERCENT
No Recidivism 580 66.0%
Recidivism 299 34.0%
Total 879 100.0%
The rate at which this group of sex offenders returned to prison, for any reason, was 34% within ten years (Table 10). This number includes return to prison for a technical violation of their release conditions, or for another crime.
TABLE 11: TYPE OF RETURN TO PRISON BY TYPE OF RELEASE FROM PRISON RETURN TYPE
RELEASE TYPE
None TPV / SSV* only New Crime
EDS 307 78.1% 86 21.9%
Parole 164 48.4% 84 24.8% 91 26.8%
Shock Probation 109 74.1% 19 12.9% 19 12.9%
Total 580 66.0% 103 11.7% 196 22.3%
*SSV = suspended sentence violator – (violated terms of shock probation)
Table 11 considers all the sex offender returns to prison during the ten-year follow-up period. If an offender was returned for a technical violation and then released, but was subsequently returned again for a new crime, he or she is in the category of New Crime. Only offenders that returned to prison for no other reason than a technical violation are in the TPV / SSV only category. Parolees were incarcerated for new crimes at a rate of 26.8%. Flat sentence releases were returned for a new crime at a 21.9% percent rate. Those sex offenders given shock probation in 1989 were the least likely to recidivate with a new crime (only 12.9%).
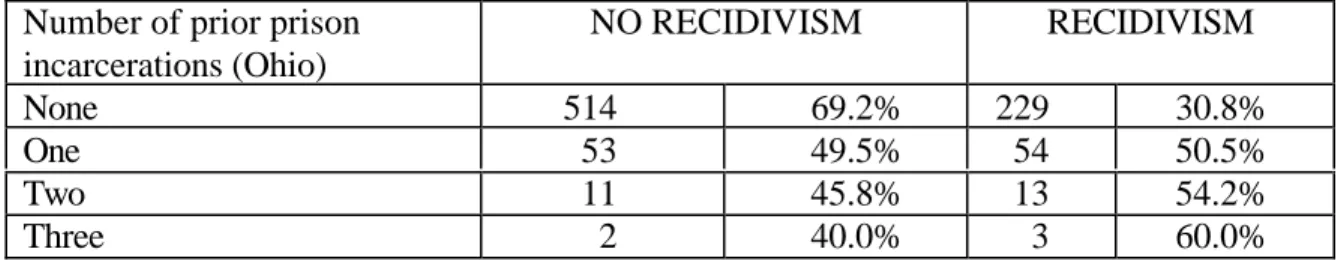
TABLE 12: GENERAL RECIDIVISM BY NUMBER OF PRIOR PRISON INCARCERATIONS
Number of prior prison incarcerations (Ohio) NO RECIDIVISM RECIDIVISM None 514 69.2% 229 30.8% One 53 49.5% 54 50.5% Two 11 45.8% 13 54.2% Three 2 40.0% 3 60.0%
Fifteen percent (n=136) of the sex offenders had been previously incarcerated in the Ohio prison system (Table 12). The more prior incarcerations an inmate had the higher the likelihood that he recidivated in the ten-year follow-up period.
TABLE 13: GENERAL RECIDIVISM BY SEX OFFENSE CONVICTION SEX OFFENSE CONVICTION NO RECIDIVISM RECIDIVISM
Rape 127 51.4% 120 48.6%
Sexual Battery 143 70.8% 59 29.2%
Gross Sexual Imposition 260 73.9% 92 26.1%
Corruption of a minor 43 60.6% 28 39.4%
Other sex offenses 7 100.0%
Offenders convicted of rape were the most likely to return to prison in the ten-year follow-up period. Almost half recidivated (48.6%). The second highest offense was corruption of a minor, with a recidivism rate of 39%. Those who were convicted of sexual battery recidivated at a rate of 29%, and Gross Sexual Imposition had a rate of 26%.
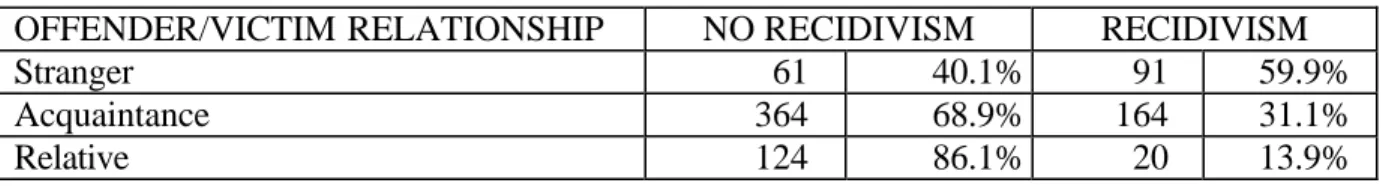
TABLE 14: GENERAL RECIDIVISM BY OFFENDER / VICTIM RELATIONSHIP OFFENDER/VICTIM RELATIONSHIP NO RECIDIVISM RECIDIVISM
Stranger 61 40.1% 91 59.9%
Acquaintance 364 68.9% 164 31.1%
Relative 124 86.1% 20 13.9%
Missing N=55
Table 14 demonstrates that offenders who were related to victims were the least likely to re-offend. Offenders who victimized acquaintances returned at a rate of 31% and those offenders whose victims were strangers had the highest return rate (59.9%).
TABLE 15: GENERAL RECIDIVISM BY VICTIM AGE
VICTIM AGE NO RECIDIVISM RECIDIVISM
Child (under age 18) 447 74.3% 155 25.7%
Adult 99 43.4% 129 56.6%
Both child and adult victims 11 61.1% 7 38.9%
Missing N=18
Offenders who victimized children were less likely to return to prison for any reason. More than half (56%) of the offenders who victimized adults were reincarcerated within ten years of release. Some of the literature focuses not only on age, but also on gender of victims. Some research reports have found that offenders who target boys are more likely to recidivate (Marshall & Barbaree, 1990, Song & Lieb, 1994). In this cohort, offenders who victimized adult males had the highest general recidivism rate, at 71.4% (but with only 7 total cases in this category, it is unwise to make strong conclusions regarding recidivism). Offenders who victimized young males had a low rate of return for any crime, at 22.2%
(Table 16). Offenders who victimized adult females returned at a 57.1% rate. Those who assaulted young females had a 30.8% return rate. Incest offenders had the lowest chance of returning to prison for any offense, with those who assaulted related female children returning at a rate of 13.4%. Incest offenders who assaulted males did not return to prison in 10 years.
TABLE 16: GENERAL RECIDIVISM BY VICTIM GENDER / AGE VICTIM GENDER / AGE NO RECIDIVISM RECIDIVISM
Adult female 91 42.9% 121 57.1%
Adult male 2 28.6% 5 71.4%
Female child – extrafamilial 272 69.2% 121 30.8%
Male child – extrafamilial 49 77.8% 14 22.2%
Female child – incest 116 86.6% 18 13.4%
Male child - Incest 4 100.0% Missing N=66
Using the established typology, it is apparent that Rapists are most likely to return to prison for any reason (Table 17). They recidivated at a rate of 56.6%. Extrafamilial child molesters returned at the rate of 29.2%. Incest child molesters were the least likely to return (13.2%) in the ten-year period.
TABLE 17: GENERAL RECIDIVISM BY SEX OFFENDER TYPOLOGY
SEX OFFENDER TYPE NO RECIDIVISM RECIDIVISM
Rapists – (adult victims) 99 43.4% 129 56.6%
Child Molester – extrafamilial 335 70.8% 138 29.2%
Child Molester – incest 118 86.8% 18 13.2%
Missing N=42
Sex recidivism
While it is important to understand the nature of sex offender recidivism with respect to all types of crime, there is considerable interest in the extent to which sex offenders recidivate for new sex offenses. Along with the emergence of sex offender notification and commitment laws in many states, there is now the widespread assumption that sex offenders will repeat sexual crimes. However, there is no simple way to measure precisely how much sexual re-offending occurs. Due to the very nature of these crimes, sex offenses are often unreported. The measure used in this report is return to prison for a sex offense. While this is not as inclusive as, say, re-arrest, in some ways it is more extensive than other measures, like re-conviction, in that it includes returns to prison for a technical violation of parole/shock probation for sexual behavior. The technical violations of this cohort were examined in order to determine whether the reasons for revocation included sexual behavior, or indicated a relapse type of behavior (i.e. a child molester making frequent visits to a school playground, or possessing child pornography, etc.).
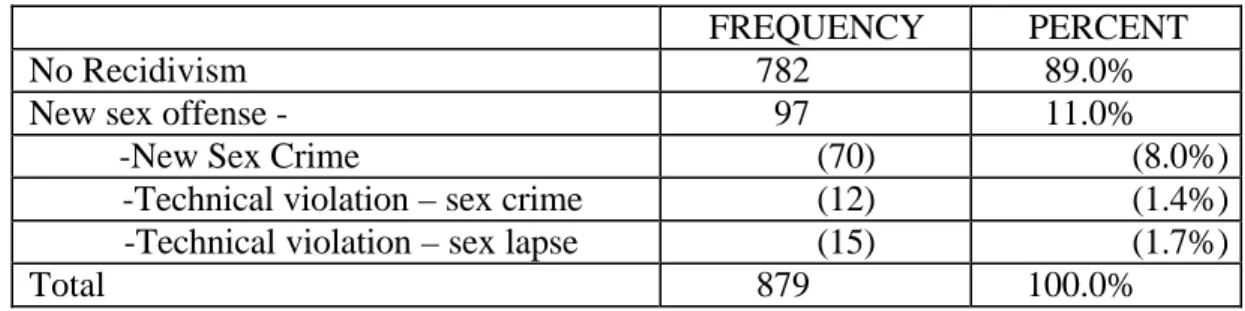
The ten-year sexual recidivism rate for the group of sex offenders in this study was 11%. Eight percent of the offenders returned for a new sex crime. Another 3% were revoked for a parole violation that was sexual in nature (sex crime), or a relapse behavior (sex lapse).
TABLE 18: SEX OFFENSE RECIDIVISM
FREQUENCY PERCENT
No Recidivism 782 89.0%
New sex offense - 97 11.0%
-New Sex Crime (70) (8.0%)
-Technical violation – sex crime (12) (1.4%) -Technical violation – sex lapse (15) (1.7%)
Total 879 100.0%
This low rate of sexual re-offense is similar to other research findings:
• A study that used sex offense conviction as the outcome found a recidivism rate of 4%, with the follow-up time of twelve years after conviction (Gibbons, Soothill, and Way, found in Furby, Weinrott & Blackshaw, 1989).
• Another study done by the same group, in 1980, found that after thirteen years, 12% of their population of rapists were subsequently convicted of a new sex offense. (Gibbons, Soothill, and Way 1980, found in Furby, Weinrott & Blackshaw, 1989).
• Perhaps the largest study of sex offenders was a meta-analysis conducted by Hanson and Bussiere. This study examined the results of 61 recidivism studies, with a total of 28,972 sex offenders. The average follow-up time for all of these studies was four to five years. The average sex offense recidivism rate was 13.4% (Hanson, & Bussiere, 1996).
• A study of sex offender recidivism done by the New York Department of Corrections followed a group of sex offender releases for nine years. This study found that the rate of return to prison for committing a new sex crime was 6%, compared to the 8% new sex crime rate of this ten-year follow-up study.
When comparing individual studies, population differences should be considered before making inferences from the recidivism rates (Maltz, 1984). For example, when comparing recidivism rates from different states and countries, it is important to consider the variations in statutes and policies in sentencing, treatment, probation, and community supervision. Also, the definitions of sex crimes may vary widely between different jurisdictions. Even within the same jurisdiction, definitions of sex crimes can change over time. Furthermore, sample selection may also affect recidivism rates. Samples drawn from released prisoners usually include more serious criminals than samples drawn from official records of arrest or conviction, and thus may have higher recidivism rates. Finally, variations in research methodology (sample size, follow-up time, recidivism measures, etc.) will also influence the estimated recidivism rates (Song & Lieb, 1994).
For these reasons, few studies can be directly compared. But while direct comparisons are unwise, general trends can be determined, and an overall picture of the extent of sex offender recidivism can be developed. What is notable, then, is that in many studies the sexual recidivism rate of sex offenders was fairly low. Certainly, any instance of sexual recidivism is cause for concern, and we should not lose sight that even a 1% sexual recidivism rate represents a certain number of victims of sexual assault. However, there is a rather widespread misconception that sex offenders, as a whole, are repeat sex offenders. While this study is obviously unable to determine the actual rate of reoffense, it is clear that a sex offender returning to an Ohio prison for a new sex offense is a fairly unusual occurrence. Table 19 displays a breakdown of the time to return to prison for a new sex crime. This table only includes those sex offenders that returned to prison for a new sex related offense. It shows that over two thirds of this group were back in prison within three years of release.
TABLE 19: TIME TO SEX RECIDIVISM PERCENT CUMULATIVE PERCENT Up to 1 year 25.8% 25.8% 1-2 years 27.8% 53.6% 2-3 years 13.4% 67.0% 3-4 years 6.2% 73.2% 4-5 years 5.2% 78.4% 5-6 years 5.2% 83.5% 6-7 years 7.2% 90.7% 7-8 years 6.2% 96.9% 8-9 years 2.1% 99.0% 9-10 years 1.0% 100.0%
This table includes only those releases with a return for a sex related offense
Table 20 shows the time from prison release to re-incarceration for a new sex related offense. This includes a sexually related technical violation of supervision. Note that this is an approximation of the time of the sex offense and does not take into account the amount of time it takes to process a case through the court system. This table only includes those releases with a return for a sex-related offense. Within two years, over half of the rapists who sexually recidivated had been returned to prison. After the two years, there are a small but steady number of rapists reincarcerated for a sex-related offense every year up to the cutoff point of 10 years. Extrafamilial child molesters that sexually recidivated were not as quick to be reincarcerated. Not until three years after release were over 60% returned to prison. Incest child molesters who sexually recidivated were most likely to be returned to prison within the first two years (70%).
TABLE 20: TIME TO NEW SEX OFFENSE BY SEX OFFENDER TYPOLOGY RAPISTS CHILD MOLESTERS
EXTRAFAMILIAL CHILD MOLESTERS INCEST Number Cumulative percent Number Cumulative percent Number Cumulative percent Up to 1 year 12 30.0% 10 24.4% 3 30.0% 1-2 years 12 60.0% 8 43.9% 4 70.0% 2-3 years 6 75.0% 7 61.0% 3-4 years 1 77.5% 4 70.7% 4-5 years 2 82.5% 2 75.6% 5-6 years 1 85.0% 3 82.9% 1 80.0% 6-7 years 2 90.0% 3 90.2% 1 90.0% 7-8 years 2 95.0% 4 100.0% 8-9 years 1 97.5% 1 100.0% 9-10 years 1 100.0%
This table includes only those releases with a return for a sex related offense
Missing N=6
While the number of prior incarcerations demonstrated a relationship with general recidivism, with sex recidivism a relationship is not as noticeable (Table 21). Offenders with no prior incarcerations in Ohio returned to prison for a new sex related offense at the rate of 11%. Only slightly higher, at 12.1% were those offenders with one prior incarceration. Offenders with two prior incarcerations sexually recidivated at the lower rate of 8.3%, and the 5 sex offenders who had three previous Ohio incarcerations did not return to prison for a sex related offense.
TABLE 21: SEX RECIDIVISM BY NUMBER OF PRIOR PRISON INCARCERATIONS NUMBER OF PRIOR PRISON
INCARCERATIONS (OHIO) NO SEX RECIDIVISM SEX RECIDIVISM None 661 89.0% 82 11.0% One 94 87.9% 13 12.1% Two 22 91.7% 2 8.3% Three 5 100.0%
Table 22 illustrates that sex offenders convicted of the crime of Rape were the most likely to return to prison within ten years of release for a new sex related offense. They returned at a rate of 15.8%. Those convicted of Corruption of a Minor had the second highest rate, with 9.9%. Offenders convicted of Gross Sexual Imposition closely followed with a reincarceration rate for a sex-related offense being 9.4%. The crime of Sexual Battery had the lowest sexual recidivism rate (8.9%).
TABLE 22: SEX RECIDIVISM BY SEX OFFENSE CONVICTION SEX OFFENSE CONVICTION NO RECIDIVISM SEX RECIDIVISM
Rape 208 84.2% 39 15.8%
Sexual Battery 184 91.1% 18 8.9%
Gross Sexual Imposition 319 90.6% 33 9.4%
Corruption of a minor 64 90.1% 7 9.9%
Other sex offenses 7 100.0%
Sex offenders who were complete strangers to their victims were more likely to return to prison for a sex related offense within ten years of release (see Table 23). They returned at a rate of 19.7%. Offenders who knew their victims as an acquaintance were less likely to return for a sex related offense, and offenders who victimized their own blood relatives were the least likely to return for a sex offense. This trend remained consistent even when controlling for conviction offense and victim age.
TABLE 23: SEX RECIDIVISM BY OFFENDER / VICTIM RELATIONSHIP OFFENDER/VICTIM RELATIONSHIP NO SEX RECIDIVISM SEX RECIDIVISM
Stranger 122 80.3% 30 19.7%
Acquaintance 477 90.3% 51 9.7%
Relative 134 93.1% 10 6.9%
Missing N=55
Offenders with adult victims had the highest sexual recidivism rate, at 17.5% (Table 24). The second highest sexual recidivism rate was found in the category of sex offenders who had both an adult and a child victim. These offenders returned at a rate of 16.1%. Those who victimized only children were the least likely to return for a sex offense.
TABLE 24: SEX RECIDIVISM BY VICTIM AGE
VICTIM AGE NO RECIDIVISM SEX RECIDIVISM
Child (under age 18) 551 91.5% 51 8.5%
Adult 188 82.5% 40 17.5%
Both child and adult victims 26 83.9% 5 16.1% Missing N=18
An aspect of sex offending that some research studies have identified as significantly related to sexual recidivism is the victim’s sex. Specifically, some reports have found that sex offenders who molest young boys who are unrelated to the offender have a higher sexual recidivism rate than other types of offenders (Song & Lieb, 1994, Hanson, Steffy & Gauthier, 1992). In this study offenders who victimized adult females were the most likely to sexually recidivate, with offenders of non-related males having the next highest rate of 11.1% (see Table 25). Offenders who assaulted adult males and offenders who assaulted related male children had no sexual recidivism.
TABLE 25: SEX RECIDIV ISM BY VICTIM GENDER / AGE
VICTIM GENDER / AGE NO SEX RECIDIVISM SEX RECIDIVISM
Adult female 172 81.1% 40 18.9%
Adult male 7 100.0%
Female child – extrafamilial 360 91.6% 33 8.4%
Male child – extrafamilial 56 88.9% 7 11.1%
Female child – incest 126 94.0% 8 6.0%
Male child - incest 4 100.0%
Missing N=66
In Table 26, the typology used often in this report shows that Rapists, or those who had adult victims, had the greatest chance of sexually recidivating, at 17.5%. Child molesters, both extrafamilial and incest, had a lesser chance of reincarceration for a sex related offense.
TABLE 26: SEX RECIDIVISM BY SEX OFFENDER TYPOLOGY OFFENDER TYPE NO SEX RECIDIVISM SEX RECIDIVISM
Rapists (adult victims) 188 82.5% 40 17.5%
Child Molester – extrafamilial 432 91.3% 41 8.7%
Child Molester – incest 126 92.6% 10 7.4%
Missing N=42
What can we conclude about sex offender recidivism? Sex offenders released from Ohio prisons in 1989 returned to the prison system within ten years at a rate of 34%. The percentage of offenders who returned to prison for a new crime was 22.3%. Only 8% of the offenders returned to prison for a new sex crime. And although there are reasons to believe that this is probably a conservative estimate of actual sexual reoffenses, these fairly low numbers match reasonably well with other studies of sex offender recidivism. Contrary to the popular idea that sex offenders are repeatedly returning to prison for further sex crimes, in this population a sex offender recidivating for a new sex offense within 10 years of release was a relatively rare occurrence.
SEX OFFENDER PROGRAMMING
In an effort to help prevent further sexual victimization, the Department of Rehabilitation and Correction has provided sex offender programming for a number of years. Program records were searched, as were inmate files, in an effort to determine how many of the 879 sex offenders had received some sex offender programming. The time frame relevant to this study was programming administered prior to 1989; however, this created logistical difficulties in determining program participation. Program records were often incomplete, and inmate files are routinely destroyed ten years after the offenders are released from department supervision. Because of this, some of the data were lost.
From information available, it was determined that 74 inmates had received the equivalent of level 1 sex offender programming. Level 1 programming was the first stage in the program and included basic educational material on sexual offending. While several of these 74
inmates did complete the entire programming offered, due to the data collection difficulties it was not possible to determine all levels of program completion beyond the first level. What can be said is that these 74 sex offenders participated in and completed at least the first stage of the sex offender programming that was offered in the Department prior to their release in 1989.
TABLE 27: SEX OFFENDER PROGRAM PARTICIPATION (LEVEL 1)
No sex offender programming 781 88.9% Sex offender program – level 1 74 8.4% Missing – records destroyed 24 2.7%
Total 879 100.0%
The following table (28) looks at both the general and sexual recidivism rates for those who had sex offender programming compared with those who did not have any sex offender programming. It seems as though there is a very small difference in general recidivism, (from 34.3% to 31.1%) and an even smaller difference in the sexual recidivism rate (from 11.0% without programming, to 10.8% with programming).
TABLE 28: RECIDIVISM BY SEX OFFENDER PROGRAMMING GENERAL
RECIDIVISM
SEX RECIDIVISM No sex offender programming 268 34.3% 86 11.0% Sex offender programming 23 31.1% 8 10.8% This table includes recidivists only
Table 29 shows that the overwhelming majority of the 74 offenders who received sex offender programming were those released on regular parole (75.5%). The helps explain the small numbers in the shock probation and expiration of sentence release categories in Table 30.
TABLE 29: SEX OFFENDER PROGRAMMING BY TYPE OF PRISON RELEASE RELEASE TYPE INMATES WHO RECEIVED
PROGRAMMING Shock Probation 3 4.1% Parole 56 75.5% Expiration of Sentence 15 20.3% Total 74 100.0%
Table 30 looks at recidivism rates (both for general recidivism and sex related recidivism) by whether the inmate received sex offender programming, controlling for release type. As this table shows, parolees without programming had a general recidivism rate of 55.2%, while
those with programming had a 33.9% recidivism rate. Parolees without programming returned for a sex related offense at a rate of 16.5%, compared to the sexual recidivism rate of 7.1% for those with programming. While it is interesting to note that recividism rates were higher for those with programming that were given shock probation, or released with no supervision than for those without programming, caution should be taken in interpreting these differences due to the small numbers for those with programming.
TABLE 30: RECIDIVISM BY SEX OFFENDER PROGRAMMING CONTROLLING FOR TYPE OF PRISON RELEASE
GENERAL RECIDIVISM
SEX RECIDIVISM Shock Probation
No sex offender program Level 1 sex offender program
37 1 26.4% 33.3% 13 1 9.3% 33.3% Parole
No sex offender program Level 1 sex offender program
152 19 55.2% 33.9% 46 4 16.5% 7.1% Expiration of sentence
No sex offender program Level 1 sex offender program
77 3 21.3% 20.0% 27 3 7.5% 20.0% This table includes recidivists only
Sex offender programming in the Department has traditionally been offered in two different settings, residential and outpatient. Residential programs consist of a separate environment in the prison where sex offenders are housed and treated. Outpatient treatment programs consist of a psychology services unit that does not segregate sex offenders from the general prison population but treats offenders on a weekly basis. The difference is of the degree of interaction with other sex offenders. Residential program participants live the entire time with similar offenders, while outpatient program participants are only in contact with other sex offenders during their classes or sessions. Of the 74 sex offenders in this study who had received at least level 1 of programming, 29 (or nearly 40%) were outpatient program participants, and 45 (or 60%) attended residential programs (Table 31).
TABLE 31: TYPE OF SEX OFFENDER PROGRAMMING PROGRAM TYPE
Out patient program 29 39.2% Residential program 45 60.8%
Looking at type of programming by recidivism, we can see that concerning general recidivism, residential program participants had a lower rate, at 22.2%, and outpatient program participants had a higher rate, at 44.8% (Table 32). However, when examining sex related recidivism, residential program participants had the same rate as those who had no programming (11.1%). Outpatient program participants had a slightly lower rate of 10.3%.
TABLE 32: RECIDIVISM BY TYPE OF SEX OFFENDER PROGRAM GENERAL
RECIDIVISM
SEX RECIDIVISM No sex offender program (N=781) 276 34.3% 89 11.0% Out-Patient program (N=29) 13 44.8% 3 10.3% Residential program (N=45) 10 22.2% 5 11.1% This table includes recidivists only
Missing N=24
Table 33 views the different types of programming by recidivism when controlling for release type. Those released on parole are what stand out in this chart. Parolees who had no participation in sex offender programming had a 55.1% general recidivism rate. Those who participated in an outpatient program had a general recidivism rate of 42.3%. And those who participated in a residential program had the lowest general recidivism rate, at 26.7%. Looking at Sex related recidivism, those with no treatment recidivated at a rate of 17.0%. Outpatient sex offender program participants had a 3.8% sex related recidivism rate, and residential program participants had a 10% recidivism rate. The other two release types had so few who participated in sex offender programming, that comparing recidivism rates across program type is unwise.
TABLE 33: RECIDIVISM BY TYPE OF PROGRAM CONTROLLING FOR RELEASE GENERAL
RECIDIVISM
SEX RECIDIVISM Shock Probation
No sex offender program (n=140) Outpatient program (n=2) Residential program (n=1) 37 1 0 26.4% 50.0% 0.0% 13 1 0 9.3% 50.0% 0.0% Parole
No sex offender program (n=279) Outpatient program (n=26) Residential program (n=30) 154 11 8 55.2% 42.3% 26.7% 46 1 3 16.5% 3.8% 10.0% Expiration of sentence
No sex offender program (n=362) Outpatient program (n=1) Residential program (n=14) 77 1 2 21.3% 100.0% 14.3% 28 1 2 7.5% 100.0% 14.3% This table includes recidivists only
Missing N=24
What can we conclude about sex offender programming? Any conclusions must be limited for a number of reasons. First, the limitations in the data do not allow determining the extent of the programming received. Some of the 75 offenders that received level 1 programming may have received much more extensive treatment, including therapy and group counseling. These people would be expected to have a better success rate, however, this level of program completion could not be determined. Second, the number of offenders that received the programming is quite small. Drawing broad conclusions about programming effectiveness
based on a few cases is hazardous. Third, the programming these offenders received occurred over ten years ago. Undoubtedly these programs have changed in the past decade, some dramatically. Also, the longer that an offender has been released, and thus the longer he has been away from the treatment setting, it may be unreasonable to assume that the programming will continue to affect the sex offender (Steele, 1995). The idea that a program the offender received while imprisoned a decade ago is still having an impact on the offender’s behavior may be a bit optimistic.
Also, in comparing recidivism rates between those who had programming and those without, it must be noted that the two groups are unmatched. The result of this is that any number of factors other than programming may explain the differences in recidivism rates.
With these caveats in mind, the following conclusions emerged from this data. In general, sex offenders who completed level 1 programming had a slightly lower recidivism rate than those who did not receive programming. Program participants were primarily parolees, and they had a general recidivism rate 21 percentage points lower than those parolees with no programming.
Overall, sex offenders who completed level 1 programming had about the same sex offense recidivism rate as those without programming. However, paroled sex offenders who participated in level 1 programming had less than half the sex offense recidivism rate as parolees without programming.
While outpatient programs demonstrated a slight reduction in the total recidivism rate for parolees, residential program participants showed a substantial reduction in the recidivism rate, from 55.1% (no programming) to 26.7% (with programming). Regarding sex offense recidivism, those parolees with no programming had a new sex related offense rate of 17%. Residential program participants had a 10% return rate, and outpatient program participants had a sex offense recidivism rate of 3.8%.
In actuality, there can be a number of reasons any offender does not return to an Ohio prison; the offender gets older, or he marries, he moves out of state, he dies, he simply gets better at avoiding detection, et cetera. For sex offenders the reasons are often the same. A rapist may simply ‘grow up.’ If the offense is incest, the victim grows up. There will always be a group of fixated sex offenders, some of whom will keep returning to prison for new sex offenses. Some will not return, for reasons listed above, as well as others unlisted. A prison sex offender program that an offender received ten years ago may be one of these reasons, but to suggest this is the only reason, or even the primary reason would be tenuous, and beyond the scope of this report.
RISK SCORES
Karl Hansen conducted a meta-analysis of several sex offender recidivism studies in order to develop a risk scale (RRASOR – the Rapid Risk Assessment for Sexual Offense Recidivism) that would identify sex offenders most likely to re-offend sexually (Hanson, 1997). The instrument that was developed contained four variables – number of prior sex offenses (both
arrests and convictions), offender’s age at release from prison, victim gender, and victim relationship. Sex offenders are scored on these items, and the sum of these comprises a risk score. These variables were duplicated in this study (see Table 34), in an effort to test out the level of relationship this score holds with new sexual recidivism. Since the instrument was designed using only male sex offenders, the ten female sex offenders in this study were removed.
TABLE 34: RRASOR VARIABLES
PRIOR SEX OFFENSES3 FREQUENCY PERCENT No prior sex offenses 793 90.2%
One prior sex offense 67 7.6%
Two or Three prior sex offenses 19 2.2% OFFENDER AGE AT RELEASE
Under 25 yrs old 731 83.2%
Over 25 yrs old 148 16.8%
VICTIM GENDER
Only Female victims 768 87.4%
Any Male victims 111 12.6%
OFFENDER/VICTIM RELATIONSHIP
Only related victims 372 42.3%
Any non-related victims 507 57.7%
Table 35 shows the relationship each RRASOR variable has with sex recidivism. The variable prior sex offenses, and offender/victim relationship both show a significant positive correlation. The other two variables, offender age at release, and victim gender do not seem to be related to sex recidivism, and do not have a statistically significant correlation.
3
The variable prior sex offenses in the Hanson study used both conviction and arrest data. In this study we used only prior conviction data.
TABLE 35: SEX RECIDIVISM BY RRASOR ITEMS PRIOR SEX OFFENSES3 SEX RECIDIVISM No prior sex offenses 9.9% One prior sex offense 21.2% Two or Three prior sex offenses 26.3% Pearson Correlation .117**
OFFENDER AGE AT RELEASE
Over 25 yrs old 11.1%
Under 25 yrs old 10.8%
Pearson Correlation -.003 VICTIM GENDER
Only Female victims 11.3%
Any Male victims 10.3%
Pearson Correlation -.014
OFFENDER/VICTIM RELATIONSHIP
Only related victims 6.5% Any non-related victims 14.6% Pearson Correlation .125**
RRASOR – (Hanson’s study) r = .27 RRASOR – (this study) r = .11
**Correlation is significant at the 0.01 level
In the Hanson article, the author used two measures to describe the predictive accuracy of the RRASOR. These two measures were the correlation coefficient, or r, and the area under the receiver operating characteristic (ROC) curve. In order to test the instrument on this Ohio population, both measures were examined. When the four items were combined, to be used as a risk instrument, the total score was significantly correlated to sexual recidivism (r= .115), however two individual items scored higher than the total score. The distribution, as seen in Table 36, shows that the higher the score, the higher the sexual recidivism rate, with the exception of those in this cohort who scored the highest, or 4 points. None of these sex offenders returned for a new sex related offense. In the Hanson meta-analysis the correlation coefficient was r=.27.
TABLE 36: SEX RECIDIVISM BY TOTAL RRASOR SCORE
TOTAL RISK SCORE SEX
RECIDIVISM 0 points (n=284) 4.9% 1 point (n=371) 12.9% 2 points (n=181) 16.0% 3 points (n=34) 17.6% 4 points (n=9) 0%
Hanson reports that ROC statistics have been used to assess predictive validity because they are easily interpreted and are not influenced by base rates (Hanson, 1997). The article goes on to say “ROC curves are the plot of the number of accurately identified recidivists, against the falsely classified nonrecidivists, for each value of the prediction scale” (Hanson, 1997). This area under the curve statistic can range from .50, (chance prediction) to 1.0 (perfect prediction). In this group of sex offenders, the ROC area under the curve statistic was .614. The Hanson study reported a ROC statistic of .71, calling this “moderate predictive accuracy.”
What can be said about the use of the RRASOR as a sex recidivism prediction instrument for this population? The low correlation coefficient as well as the low area under the curve ROC statistic lead to the conclusion that the predictive accuracy of this instrument on this particular group of sex offenders is slightly better than chance.
POLICY IMPLICATIONS
While the findings of this report tend to support the findings of much of the literature regarding sex offender recidivism, duplicating these findings in Ohio is important, in that it helps to validate the typologies used in the treatment of Ohio sex offenders.
Further research
While this paper provides some limited findings concerning sex offender programming further studies are necessary to help understand the current state of the department’s programs. Sex offender programming has changed in the past 10 years. The department has established the Sex Offender Risk Reduction Center (SORRC) at Madison Correctional Institution. All sex offenders identified through a screening process at the department’s reception centers are sent to SORRC to be assessed, and to receive a mandatory 20 hour educational program for sex offenders. The goal is to determine the level of risk of sexual reoffense for sex offenders, and place the higher risk offenders in comprehensive programming in other institutions.
Further research projects suggested by the current state of sex offender programming; 1. Study of the mandatory educational program for sex offenders at SORRC.
A thorough analysis of this program would give the department an idea as to the benefits, if any, of the mandatory program. In order to do this study correctly a look at recidivism would be required. This requires that a sufficient amount of time must have passed, so that program participants would have been released for a certain amount of years. As the creation of SORRC is relatively recent, and more importantly, the most recent iteration of the educational component is also fairly new, the follow-up period which we could use now is likely to be too short. Another difficulty with this study would be in finding an appropriate
control group. Since this is a mandatory program, it would be difficult to find a matched group of sex offenders that did not receive the program.
2. Study of the Static 99 risk instrument used at SORRC, as well as the risk instrument designed by DRC.
The department currently uses two different sex offender risk instruments. These risk instruments combined with the clinical assessment (theoretically) help to determine whether or not a sex offender gets treatment. The obvious research question would be whether these instruments have validity on an Ohio sex offender population. Can we say with certainty that offenders who score high on these risk instruments actually have a greater chance of sexual recidivism? And do those that have a low risk score have a lower rate of sexual re-offense? The difficulty with this study once again lies in the follow-up period. The Static 99, and the ODRC risk instrument, have been completed on sex offenders since March 2000. In order to validate these risk instruments on current sex offenders, a sufficient amount of time must have elapsed, in order for the assessed inmates to have completed their sentence, and spent some years in the community. Once again the current follow-up period is likely insufficient. 3. Evaluation of comprehensive sex offender programs.
The department currently has six sex offender programs. Do these programs make a difference? Have they helped to reduce sex offender re-offending? A thorough evaluation of these programs has not been conducted. However, a department wide evaluation of programming faces the difficulty of accounting for differences in the programs. While the department struggles to standardize all programs, (and has been doing so for several years), it has yet to achieve this goal. This places the evaluator in the proverbial situation of ‘comparing apples to oranges.’ One possible solution would be to reduce the scope of the evaluation. A study of one or two of the “model” programs has been suggested. Some of the programs have maintained databases on program participants. If the data are sufficient, and the follow-up period adequate, an individual program evaluation may be possible. Some issues would still be problematic; e.g. recidivism data would likely be limited to reincarceration, as arrest data are not viable. Matched control groups would also be a challenge.
SUMMARY
• Sex offenders released from Ohio prisons in 1989 differed from other types of offenders released that same year. Sex offenders were more likely to be older and more likely to be white males than other offenders released. A larger proportion of sex offenders had been committed from rural areas.
• Sex offender victims tended to be young. Almost half were under the age of 13, with another 22% being between the ages of 13 and 17. The vast majority were female, and most were at least acquainted with the offender in some way. Only 17% were total strangers.
• The rate at which this group of sex offenders returned to prison, for any reason, was 34% within ten years. Rapists were most likely to return to prison for any reason. They recidivated at a rate of 56.6%. Extrafamilial child molesters returned at the rate of 29.2%. Incest child molesters were the least likely to return for any reason (13.2%) in the ten-year period.
• The ten-year sexual recidivism rate for the group of sex offenders in this study was 11%. Eight percent of the offenders returned for a new sex crime. Another 3% were revoked for a parole violation that was sexual in nature (sex crime), or a relapse behavior (sex lapse). Rapists, or those who had adult victims, had the greatest chance of sexually recidivating, at 17.5%. Child molesters, both extrafamilial and incest, had a lesser chance of reincarceration for a sex related offense.
• Sex offenders who returned for a new sex offense did so within a few years of release. Of all the sex offenders who came back to an Ohio prison for a new sex offense, one half did so within two years, and two-thirds within three years.
• In general, sex offenders who completed level 1 programming had a slightly lower general recidivism rate than those who did not receive programming. Program participants were primarily parolees, and they had a general recidivism rate 21 percentage points lower than those parolees with no programming.
• Sex offenders who completed level 1 programming had about the same sex offense recidivism rate as those without programming. However, paroled sex offenders who participated in level 1 programming had less than half the sex offense recidivism rate as parolees without programming.
• An attempt was made to use the RRASOR as a sex recidivism prediction instrument for this population. The low correlation coefficient as well as the low area under the curve ROC statistic lead to the conclusion that the predictive accuracy of this instrument on this particular group of sex offenders is slightly better than chance.
REFERENCES
Furby, L., Weinrott, M. R., & Blackshaw, L. (1989). Sex offender recidivism: A review. Psychological Bulletin, 105, 3-30.
Gibbens, T.C.N., Soothill, K. L., & Way, C. K. (1981). Sex offences against young girls: A long-term record study. Pyschological Medicine, 11, 351-357.
Greenfeld, L. A.,(1997). Sex offenses and offenders: An analysis of data on tape and sexual assault, U.S. Department of Justice, Bureau of Justice Statistics.
Hanson, R. K., (1997). The development of a brief actuarial risk scale for sexual offense recidivism (User report: 97-04). Ottawa: Solicitor General Canada.
Hanson, R. K. & Bussiere, M.T. (1996). Predictors of sexual offender recidivism: A meta-analysis. (User report: Catalogue No. JS4-1/1996-4E). Ottawa: Solicitor General Canada. Hanson, R. K., Steffy, R. & Gauther, R. (1992). Long term follow-up of child molesters: Risk predictors and treatment outcome. (User report: 1992-02). Ottawa: Solicitor General Canada.
Maltz, M. D. (1984) Recidivism. Academic Press Inc., Orlando.
Marshall, W. L. & Barbaree, H.E. (1990). Handbook of sexual assault: Issues, theories, and treatment of the offenders. Plenum Press, New York and London.
Ohio Department of Rehabilitation and Correction, Bureau of Research, 1999 commitment report.
Ohio Department of Rehabilitation and Correction, Bureau of Research, 1998 census report. Prentky, R.A., Lee, A.F.S., Knight, R.A., & Cerce, D. (1997). Recidivism rates among child molesters and rapists: A methodological analysis. Law and Human Behavior. 21, (6), 635-659.
Pribe, J. (1995). Sex offender report: Intake 1992. Ohio Department of Rehabilitation and Correction, Bureau of Research.
Schwartz, B. K. & Cellini, H. R. editors (1995). The Sex offender volume 1: Corrections, treatment and legal practice. Civic Research Institute, Incorporated.
Song, L. & Lieb, R.(1994) Adult sex offender recidivism: A review of studies. Unpublished paper.
State of New York, Department of Correctional Services (n.d.). Profile and follow-up of sex offenders released in 1986. (Prepared by Canestrini, K).
Steele, N. (1995) “The recidivism of sex offenders: Is treatment cost effective?” in The sex offender volume 1: Corrections, treatment and legal practice, Schwartz, B. K. & Cellini, H.R. (eds.).
U.S. Department of Justice, Bureau of Justice Statistics. (1999). Sourcebook of criminal justice statistics 1998.
U.S. Department of Justice, National Institute of Corrections (1988). Questions and answers on issues related to the incarcerated male sex offender.