A Gene Expression Panel is Accurate for Diagnosis and
Monitoring Treatment of Eosinophilic Esophagitis
in Adults
Evan S. Dellon, MD, MPH1, Ranjitha Veerappan, MD2, Sara R. Selitsky, PhD3, Joel S. Parker, PhD3, Leana L. Higgins, MS1, RoseMary Beitia, MA1, Robert M. Genta, MD2,4and Richard H. Lash, MD2
OBJECTIVE: Eosinophilic esophagitis (EoE) can be difficult to diagnose. We aimed to evaluate whether a gene expression score could differentiate adult EoE cases from non-EoE controls and to determine whether scores normalized after treatment for EoE. METHODS: We analyzed prospectively collected esophageal biopsies from EoE patients (diagnosed as per consensus guidelines and after a proton pump inhibitor trial) and non-EoE controls. Gene expression for a previously constructed 94 gene panel was quantified for a single RNA-later preserved biopsy. For diagnosis, a summary expression score and the area under the receiver operating characteristic curve (AUC) were calculated. For treatment response (defined aso15 eosinophils per high-power field), pretreatment and posttreatment EoE samples were compared.
RESULTS: For 91 EoE cases and 174 controls, gene scores for EoE cases were lower than non-EoE controls (mean 198 vs. 420;
Po0.001), with an AUC of 0.927. A score ≤263 yielded a positive predictive value=91%; a score ≥349 yielded a negative
predictive value=90%; only 12% of subjects had an indeterminate score (264–348) by this classification scheme. For the 89 EoE cases with paired pretreatment and posttreatment samples, overall gene scores improved after treatment from 199 to 343 (Po0.001). This normalization was seen only in cases with histological response (202 vs. 425;Po0.001); scores were unchanged in non-responders (189 vs. 226;P=0.25).
CONCLUSIONS: A gene expression score has high diagnostic utility for distinguishing EoE patients from non-EoE controls in adults and can be used in clinical algorithms. Because it is highly responsive to treatment, the test could be used to monitor disease status.
Clinical and Translational Gastroenterology(2017)8,e74; doi:10.1038/ctg.2017.2; published online 9 February 2017 Subject Category:Esophagus
INTRODUCTION
The current paradigm for diagnosing eosinophilic esophagitis (EoE) requires the presence of symptoms of esophageal dysfunction, an esophageal biopsy with at least 15 eosinophils per high-power field (eos/hpf) after a course of a proton pump inhibitor (PPI), and exclusion of other potential causes of esophageal eosinophilia.1,2Although this definition has helped to provide more consistency in the field,3,4diagnosis of EoE remains challenging. Symptoms of esophageal dysfunction can be seen in multiple conditions, including gastroesophageal reflux disease and esophageal motility disorders, and esopha-geal eosinophilia, even at very high levels, is not specific for EoE.5,6 Moreover, histological assessment of eosinophilia in clinical practice is fraught with problems related to tissue sampling, section thickness, field selection, degranulation, and even microscope used.3,7Finally, although endoscopic signs and biopsy findings can be highly suggestive, there are no pathognomonic signs of EoE and there is significant clinical overlap between EoE, gastroesophageal reflux disease, and other causes of dysphagia.8
Because of these issues, there has been significant research interest in optimizing the diagnosis of EoE, including clinical symptom scores,9–12immunohistochemical staining of esophageal biopsies,13–17 endoscopic severity scores,18–20 biomarkers,21–24 and gene expression.25–27 Recently, analysis of the EoE transcriptome identified a panel of 94 differentially expressed genes that held promise for diagnosis of EoE.28Genes were selected based on the degree to which they were upregulated or downregulated, their relation to EoE pathogenesis, and their involvement in pathways related to EoE inflammation, and the panel contains pro-inflammatory genes, epithelial/barrier function genes, and mast cell–related genes, among others.28,29The study by Wenet al.28showed that a gene expression summary score was highly sensitive and specific for distinguishing EoE cases from non-EoE controls, but the score was primarily derived and validated in a pediatric population, with relatively few adults included in the study. In addition, although the score appeared to normalize in EoE cases after successful treatment, assessment of treat-ment response was not a major focus of that study, and the
1
Center for Esophageal Diseases and Swallowing, Division of Gastroenterology and Hepatology, Department of Medicine, University of North Carolina, Chapel Hill, North Carolina, USA;2Miraca Life Sciences Research Institute, Irving, Texas, USA;3Department of Genetics, University of Chapel Hill, Chapel Hill, North Carolina, USA and 4Dallas Veterans Affairs Medical Center, University of Texas Southwestern Medical Center, Dallas, Texas, USA
Correspondence: Evan S. Dellon, MD, MPH, Center for Esophageal Diseases and Swallowing, Division of Gastroenterology and Hepatology, Department of Medicine, University of North Carolina, CB#7080, Bioinformatics Building, 130 Mason Farm Road, UNC-CH, Chapel Hill, North Carolina 27599-7080, USA.
E-mail: [email protected]
utility of this test has not been validated in an independent external population.
The aim of this study was to evaluate whether a gene expression score could accurately differentiate adult EoE cases from non-EoE controls and to determine whether scores were affected by treatment for EoE.
METHODS
Study design and patients. This was an analysis of
esophageal biopsies collected during a prospective cohort study conducted at the University of North Carolina from 2009 through 2015, and details of this study design have been previously described.12,20,21,30,31 We consecutively enrolled patients aged 18–80 years who were undergoing outpatient upper endoscopy for evaluation of symptoms of esophageal dysfunction such as dysphagia, food impaction, heartburn, reflux, or chest pain. Patients were enrolled prior to the endoscopy and before their final diagnosis was clinically determined. Exclusion criteria were: a known diagnosis of EoE or a different eosinophilic gastrointestinal disorder, gastrointestinal bleeding, active anticoagulation, esophageal cancer, prior esophageal surgery, esophageal varices, medical instability or multiple comorbidities preclud-ing enrollment in the clinical opinion of the endoscopist, or inability to read or understand the consent form. In that parent study, of the 586 subjects screened, 280 were ineligible owing to these exclusion criteria.12 Informed consent, including consent for future use of stored biopsy specimens, was obtained prior to the endoscopy. This study was approved by the UNC Institutional Review Board and registered on clinicaltrials.gov (NCT 01988285).
We used consensus guidelines as the gold standard to clinically diagnose EoE cases.1,2Cases were required to have at least one symptom of esophageal dysfunction,≥15 eos/hpf on esophageal biopsy after an 8-week proton pump inhibitor trial (20–40 mg twice daily of any of the available agents, prescribed at the discretion of the clinician), and exclusion of other causes of esophageal eosinophilia. Controls were subjects who did not meet clinical or histological criteria for EoE after endoscopy and biopsy. Subjects with proton pump inhibitor–responsive esophageal eosinophilia were not included in this study based on prior data that gene expression profiling could not distinguish them from EoE cases.32 In addition, we included a set of patients who were“clinically challenging”from a diagnostic standpoint: they had≥15 eos/ hpf on esophageal biopsy but could not be readily classified as a case or control based on initial clinical presentation alone.
Data, bio-sample collection, and follow-up. Patient demo-graphics, symptoms, and endoscopic findings were recorded prospectively on standardized case report forms. During the endoscopy, esophageal biopsies were obtained per research protocol (two from the proximal, one from the middle, and two from the distal esophagus) for determination of tissue eosinophil counts and to maximize EoE diagnostic sensitivity.33,34 We also collected research-protocol gastric and duodenal biopsies to exclude concomitant eosinophilic gastroenteritis. Esophageal eosinophil counts were
determined based on our previously validated methodology.35The maximum eosinophil density (eos/mm2) was quantified in five hpfs and then converted to an eosinophil count (eos/hpf) based on a microscopic field size of 0.24 mm2, the most commonly reported size in the literature.3Slides were masked as to case/control status.
In addition to biopsies obtained for histological assessment, we also collected additional biopsy samples that were labeled with a de-identified study number, masked as to case/control status, and stored at −80 °C RNA-later (Life Technologies/ Thermo-Fisher Scientific, Grand Island, NY) for future use.
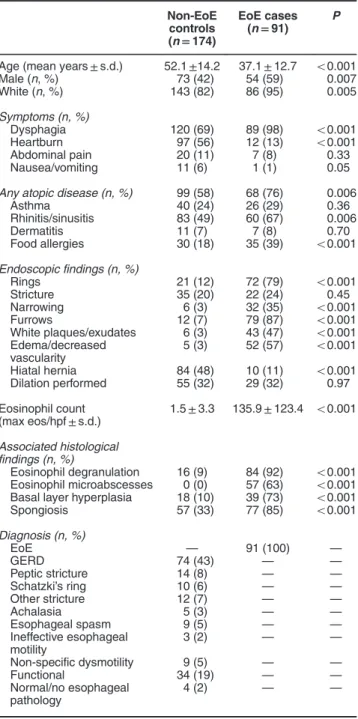
Table 1 Baseline characteristics of cases and controls
Non-EoE controls (n=174)
EoE cases (n=91) P
Age (mean years±s.d.) 52.1±14.2 37.1±12.7 o0.001 Male (n, %) 73 (42) 54 (59) 0.007 White (n, %) 143 (82) 86 (95) 0.005
Symptoms (n, %)
Dysphagia 120 (69) 89 (98) o0.001 Heartburn 97 (56) 12 (13) o0.001 Abdominal pain 20 (11) 7 (8) 0.33 Nausea/vomiting 11 (6) 1 (1) 0.05
Any atopic disease (n, %) 99 (58) 68 (76) 0.006
Asthma 40 (24) 26 (29) 0.36 Rhinitis/sinusitis 83 (49) 60 (67) 0.006 Dermatitis 11 (7) 7 (8) 0.70 Food allergies 30 (18) 35 (39) o0.001
Endoscopic findings (n, %)
Rings 21 (12) 72 (79) o0.001 Stricture 35 (20) 22 (24) 0.45 Narrowing 6 (3) 32 (35) o0.001 Furrows 12 (7) 79 (87) o0.001 White plaques/exudates 6 (3) 43 (47) o0.001 Edema/decreased
vascularity
5 (3) 52 (57) o0.001
Hiatal hernia 84 (48) 10 (11) o0.001 Dilation performed 55 (32) 29 (32) 0.97
Eosinophil count (max eos/hpf±s.d.)
1.5±3.3 135.9±123.4 o0.001
Associated histological findings (n, %)
Eosinophil degranulation 16 (9) 84 (92) o0.001 Eosinophil microabscesses 0 (0) 57 (63) o0.001 Basal layer hyperplasia 18 (10) 39 (73) o0.001 Spongiosis 57 (33) 77 (85) o0.001
Diagnosis (n, %)
EoE — 91 (100) —
GERD 74 (43) — —
Peptic stricture 14 (8) — — Schatzki’s ring 10 (6) — — Other stricture 12 (7) — —
Achalasia 5 (3) — —
Esophageal spasm 9 (5) — — Ineffective esophageal
motility
3 (2) — —
Non-specific dysmotility 9 (5) — —
Functional 34 (19) — —
Normal/no esophageal pathology
4 (2) — —
This study utilized a single RNA-later-preserved biopsy from the mid-esophagus (10 cm above the gastroesophageal junction) for gene expression determination. The decision to use a single mid-esophageal biopsy was based on our prior work showing that gene expression in EoE and controls was similar throughout the esophagus.31
Patients diagnosed with EoE were treated as clinically indicated by their gastroenterologist. They could receive treatment with topical corticosteroids (either oval viscous budesonide 1 mg twice daily or fluticasone from a multi-dose inhaler, 880 mcg twice daily) for 8 weeks36–38 or dietary therapy with the six-food elimination diet for 6 weeks39,40 based on personal preference. When the initial course of therapy was completed, patients had a repeat upper endo-scopy with biopsy during which time a repeat set of esophageal biopsies was obtained using identical protocols as the baseline endoscopy.
Gene expression determination. After patient enrollment was complete, the mid-esophageal biopsies in RNA-later were removed from−80 °C storage and sent on dry ice for processing at Miraca Life Sciences (Phoenix, AZ) for gene expression testing. The supernatant was removed after thawing and the tissue was homogenized. RNA extraction was performed on the homogenized specimens using the RNeasy Mini Extraction Kit (Qiagen, Valencia, CA) per the manufacturer’s instructions, and the concentration was measured using spectrophotometry (NanoDrop, Wilmington, DE). A concentration of 16.5 ng/μl of RNA for a total of 500 ng was considered acceptable. cDNA synthesis was carried out using the iScript cDNA Synthesis Kit (Bio-Rad, Hercules, CA) with PCR performed on ABI 9700 (Applied Biosystems, Foster City, CA). The cDNA and TaqMan Universal Master Mix II, no UNG (Life Technologies) were loaded onto custom Taqman TLDA cards containing preloaded Taqman gene expression assays in a 384-well format. This consisted of the 94 gene panel that was previously developed for EoE28and 2 housekeeping genes (GAPDH and 18S) (EoGenius, Miraca Life Sciences, Irving, TX). PCR was performed on Quant Studio 7 (Life Technologies) to determine the gene expres-sion levels measured as threshold cycles (Ct). Samples with
a GAPDH value ofo30 Ct were considered acceptable for analysis.
Using this expression data, a summary score was calcu-lated using a previously established algorithm.28Specifically, the Ct value of the housekeeping gene was subtracted from the Ct value of each gene of interest to acquire theΔCT, and then the absolute values of the normalized gene Ct values were summed for each gene in the gene expression panel.
Statistical analysis. We summarized clinical features of the study populations with descriptive statistics. Baseline data for cases and controls, including the mean gene scores, were compared using two-sample t-tests for continuous variables and chi-square for categorical variables. We assessed the gene score cut point (o333 vs.≥333) that was previously found to maximize diagnostic accuracy (a score o333 was shown to be characteristic of EoE)28evaluated the correlation between the maximum eosinophil counts and the gene scores and performed additional receiver operator character-istic curve analyses to calculate the area under the curve (AUC) and operating characteristics for our data set. With these data, we explored gene score ranges, rather than a single cut point, that would optimize both positive and negative predictive values (PPV and NPV, respectively) while minimizing indeterminate results. Next we analyzed the baseline and posttreatment gene scores for EoE cases using paired t-tests. The posttreatment gene scores were also stratified by histological response status, defined as 15 eos/hpf.41Finally, we examined the gene scores for clinically challenging patients (≥15 eos/hpf on esophageal biopsy but with an indeterminate initial clinical presentation). For these cases, the gold standard was the final clinical diagnosis based on all available testing, treatment, and follow-up data in the medical record. Analyses were performed with Stata 9.2 (StataCorp, College Station, TX).
RESULTS
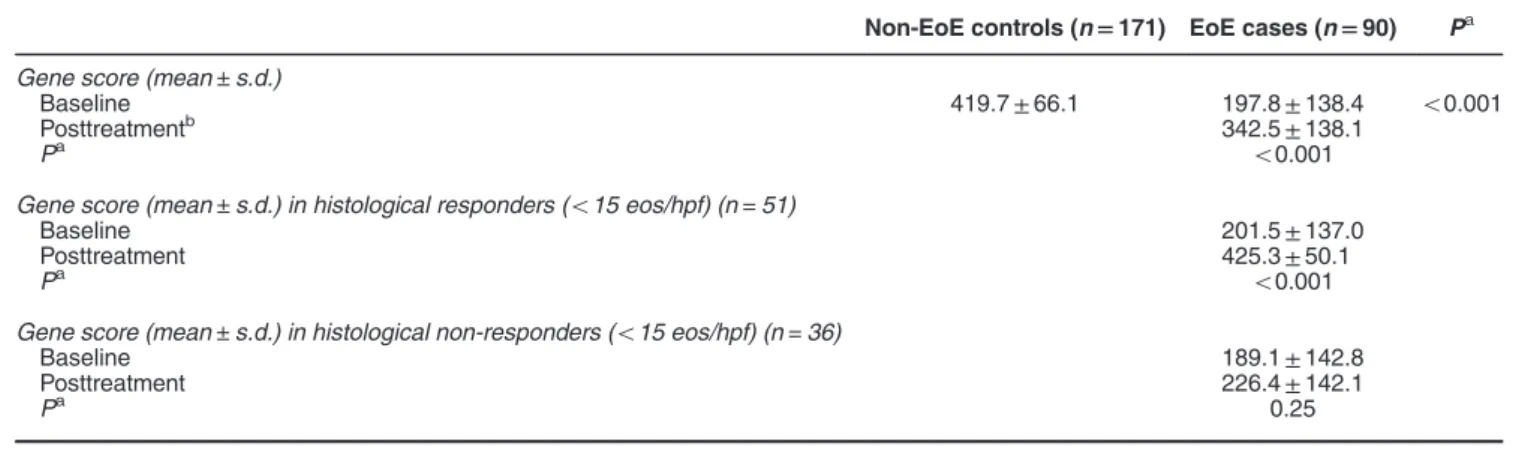
Patient characteristics. A total of 174 non-EoE controls and 91 incident EoE cases had samples analyzed in this study. Compared with controls, EoE cases were younger (37 vs. 52 Table 2Baseline and follow-up gene scores
Non-EoE controls (n=171) EoE cases (n=90) Pa
Gene score (mean±s.d.)
Baseline 419.7±66.1 197.8±138.4 o0.001
Posttreatmentb 342.5±138.1
Pa o0.001
Gene score (mean±s.d.) in histological responders (o15 eos/hpf) (n=51)
Baseline 201.5±137.0
Posttreatment 425.3±50.1
Pa o0.001
Gene score (mean±s.d.) in histological non-responders (o15 eos/hpf) (n=36)
Baseline 189.1±142.8
Posttreatment 226.4±142.1
Pa 0.25
EoE, eosinophilic esophagitis; eos/hpf, eosinophils per high-power field.
years; Po0.001), more frequently male (59% vs. 42%; P=0.007) and white (95% vs. 82%; P=0.005), and had more atopic diseases (76% vs. 58%; P=0.006) (Table 1). Cases also more commonly had endoscopic findings of esophageal rings, narrowing, linear furrows, white plaques/ exudates, and edema/decreased vascularity. The baseline maximum eosinophil counts were 135.9±123.4 in the EoE cases and 1.5±3.3 in the controls (Po0.001) (Table 1).
Baseline gene expression scores. Sufficient RNA was
available for 171 controls and 90 cases. At baseline, the mean gene expression score was significantly lower in EoE cases compared with controls (197.8±138.4 vs. 419.7±66.1; Po0.001) (Table 2). The heat map showing gene expression for the gene panel used for all subjects is presented in Figure 1. The maximum eosinophil count
inversely correlated with the gene score (Pearson’s R=−0.65; Po0.001). On receiver operator characteristic analysis, the AUC was 0.927 for diagnosis of EoE (Figure 2). The gene score cut point of 333 correctly classified 72 of the cases (79%) and 158 of the controls (91%), corresponding to aκof 0.71. After optimizing potential gene score ranges, we found that a score≤263 yielded a PPV=91%, a score≥349 yielded an NPV=90%, and only 12% of subjects had an indeterminate score (range: 264–348) by this classification scheme (Table 3).
Posttreatment gene expression scores. There were 89
EoE cases with paired pretreatment and posttreatment samples. A total of 81 (91%) were treated with topical steroids, 75 of whom (93%) were prescribed a budesonide slurry at 2 mg/day, and 6 of whom were prescribed
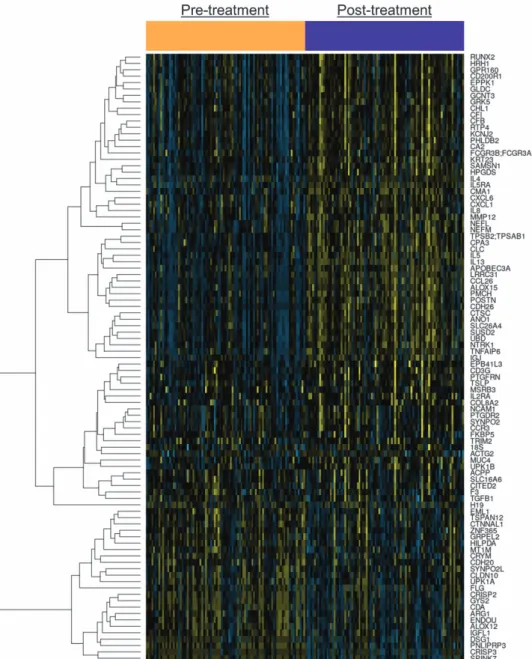
fluticasone in a multi-dose inhaler at 1760 mcg/day; the remaining patients were treated with dietary elimination. The overall gene scores after treatment increased to 342.5±138.1 (Po0.001) (Table 2). The heat map showing pretreatment and posttreatment gene expression for EoE cases is presented in Figure 3. Of note, this increase was seen only in those cases with histological response (201.5±137.0 vs. 425.3±50.1; Po0.001); scores were unchanged in histological non-responders (189.1±142.8 vs. 226.4±142.1;P=0.25; Figure 4).
Utility of gene expression scores in clinically challenging patients. There were 15 patients (mean age 53 years; 80% male) who had elevated eosinophil counts and clinically indeterminate features on their baseline endoscopy and biopsy (Supplementary Table S1). The mean peak eosinophil count in this group was 55 eos/hpf, and the mean baseline gene score was 313, in the indeterminate range by the classification scheme above. After all clinical features and subsequent testing were considered, only one patient was felt clinically to have overlapping EoE and gastroesophageal reflux disease; the gene score for this patient was 231, in the range suggestive of EoE. Ten patients (67%) had gene scores≥264, putting them in either the indeterminate or non-EoE range, despite their elevated esophageal eosinophil count. None of these patients were clinically diagnosed with EoE.
DISCUSSION
Because the clinical, endoscopic, and histological features of EoE are non-specific, the diagnosis of EoE remains challen-ging. The description of a characteristic gene expression pattern in EoE patients, the EoE transcriptome,25,26was the foundation for the eventual development of a molecular strategy for diagnosis of EoE. A summary score based on a panel of 94 genes with differential expression in EoE compared with non-EoE controls showed great promise for diagnosis of EoE.28Our study focused on the clinical utility of
this gene expression summary score in adults and several results were notable. First, the score discriminated EoE cases from non-EoE controls with a high degree of accuracy, though not perfectly. Second, we were able to adapt a scoring system to provide clinically relevant probabilistic score ranges, rather than a single dichotomous threshold for diagnosis. Third, we showed that a positive gene score reliably normalizes after histological treatment response, suggesting that it may be used to assess treatment response in place of a set of biopsies obtained for histological analysis. Finally, there appeared to be some utility in applying the gene score to cases that were clinically indeterminate.
There have been several studies that have examined gene expression in EoE, showing differences in individual genes or microRNAs between EoE cases and controls and that these individual markers could normalize with treatment.25–28,42–45 However, the landmark paper by Wenet al.28was the first to develop an overall gene score and then to go further by validating its use for EoE diagnosis. Although the score was primarily evaluated in a pediatric population with relatively few adults included, and while treatment response was not the main focus, the performance of this summary score was impressive. A cutoff of 333 perfectly distinguished EoE cases from non-EoE controls in the initial study phase (AUC=1.00) and was nearly perfect in the follow-up validation phase (AUC=0.97). Our results also showed an outstanding AUC (0.93). The main difference was that the threshold of 333, though good, was not perfect (κ=0.71) and some patients were misclassified. This discrepancy may be explained by methodology. Because this is the first large-scale external validation of the gene expression panel, it is not surprising that a cut point developed in a different population does not have identical performance characteristics. In addition, the prior study processed samples individually in a research laboratory, while the present study utilized a more automated process that could be used in the clinical setting. To address this, we defined ranges, based on the clinical probability of EoE, that maximized PPV and NPV and minimized indeterminate results. In addition, the test had promise in cases that had high levels of eosinophilia on biopsy but had a clinically indeterminate presentation, something that no study to date has examined.
In addition to the test’s diagnostic utility, we were able to show that it might have an even stronger role in monitoring of therapy. Currently, there are few studies that systematically assess or define the“best”histologicalal threshold in EoE,41 clinical trials have substantial heterogeneity in the end points that have been used,5,46and guidelines do not recommend a specific cut point to monitor response.2In practice, multiple biopsies are obtained from multiple locations throughout the esophagus, and the posttreatment peak eosinophil count is determined from review of these samples. Because eosino-philia is patchy,34,47there could be sampling error during this evaluation. In contrast, it appears that gene expression may be more consistent throughout the esophagus,31and our results demonstrate that a single biopsy from a patient who had histological response also had normalization of a gene expression. It is therefore intriguing to speculate whether gene expression normalization might provide a more efficient and accurate way to define tissue response to treatment in
EoE. However, future studies will need to assess other mea-sures of response (symptoms, endoscopic findings, histological findings besides eosinophil count alone) to fully explore the use of this gene panel as a treatment outcome measure. Additionally, even with the data presented here, the role and
availability of this test in clinical diagnostic and treatment monitoring algorithms must still be defined. As of now, there may not be a need for use in clear-cut cases, but because diagnostic features of EoE are not specific, the test may have the most value in settings of clinical uncertainty or when a baseline value is needed for subsequent treatment monitoring. This paper has some limitations to acknowledge. This study was conducted in adults at a single tertiary care referral center, so it is possible that results are not generalizable. However, the study design enrolled all patients undergoing endoscopy for symptoms of esophageal dysfunction, a population that is likely to be similar to that in many other endoscopic suites. In addition, the biopsy samples that we used were preserved in RNA-later. Were a gene panel to be employed in clinical practice, formalin-fixed paraffin-embedded (FFPE) samples would most likely be used. The same gene expression
Figure 3 Gene expression heat map for cases before (orange bar) and after (purple bar) treatment. Yellow indicates more highly expressed genes and blue indicates less highly expressed genes.
Table 3Optimization of the gene score for clinical applicability
Predicted probability of EoE
Clinical test interpretation
Gene score range
Notes
0.70–1.0 Likely ≤263 PPV 91% 0.30–0.69 Indeterminate 264–348 12% of samples
in this range 0–0.29 Unlikely ≥349 NPV 90%
panel has been shown to have good discriminative ability in FFPE samples, but we did not perform external validation, and this additional validation as well as confirmation of the proposed score ranges from this paper must still be explored for RNA derived from FFPE. Moreover, external validation of the cut points proposed in this study would also be required at different centers and in different populations. Although we included a patient population with high eosinophil counts and clinically indeterminate presentations, the clinical care and follow-up testing of these patients were not standardized, so those results should be interpreted with caution. The indeterminate patients also represented a relatively small sample, and in a number of cases a careful clinical evaluation could yield a correct diagnosis without using a gene expression test. In addition, our study cannot address the issue of whether gene expression can replace standard histological analysis in EoE diagnostic algo-rithms, and future research will need to elucidate the best way to utilize a test that could“rule in EoE”, in contrast to an eosinophil count that is non-specific. The strengths of the study include the rigorous prospective design, meticulous sample handling that was identical for all subjects, and obtaining samples before case/ control status was assigned. Moreover, this large case/control population was independent from the population used to develop and initially validate the test, the laboratory was masked to case/ control status when gene scores were determined, and samples were processed and run with the same set of equipment that would be used in a clinical setting.
In conclusion, this prospective cohort study showed that a gene expression profile run on a single esophageal biopsy had an excellent ability to discriminate EoE cases from non-EoE controls, and we were able to generate probabilistic score ranges with high PPV and NPVs while minimizing samples with intermediate scores. In addition, patients with marked esophageal eosinophilia but with an indeterminate initial clinical presentation were able to be categorized as unlikely to have EoE based on higher gene scores. Although this test could be used in clinical algorithms, its exact place in these algorithms and utility above standard histological
analysis for diagnosis is still exploratory and yet to be determined. Finally, because the gene scores were respon-sive to treatment and normalized in patients who also had histological response, it is possible that in the future a single esophageal biopsy posttreatment could be used to define tissue response in EoE.
CONFLICT OF INTEREST
Guarantor of the article: Evan S. Dellon, MD, MPH. Specific author contributions:Evan S. Dellon: project conception/design, obtained funding, data analysis/
interpretation, drafting of the article, critical revision, approved final draft; Ranjitha Veerappan: processed and analyzed specimens, data analysis/interpretation, critical revision, approved final draft; Sara R. Selitsky and Joel S. Parker: data analysis/interpretation, critical revision, approved final draft; RoseMary Beitia and Leana L. Higgins: patient recruitment, data collection, critical revision, approved final draft; Robert M. Genta: project conception, data interpretation, critical revision, approved final draft; Richard H. Lash: project conception, data interpretation, critical revision, approved final draft.
Financial support:This work was supported, in part, by NIH Awards K23DK090073 (E.S.D) and an investigator-initiated research grant from Miraca Life Sciences (E.S.D.) and uses resources from the UNC Center for GI Biology and Disease (P30DK34987) and the UNC Translational Pathology laboratory (P30CA016086).
Potential competing interests:Dr Veerappan, Dr Genta, and Dr Lash are employees of Miraca Life Sciences. The other authors declare no conflict of interest.
Study Highlights
WHAT IS CURRENT KNOWLEDGE
✓ Diagnosis of eosinophilic esophagitis (EoE) remains challenging as the clinical signs and biopsy findings are not specific.
✓ A gene expression panel for diagnosis of EoE has recently been developed, but its utility in adults and role for monitoring treatment response have not been extensively evaluated.
WHAT IS NEW HERE
✓ This large cohort study of adults with EoE and non-EoE controls analyzed a gene expression panel in prospectively collected esophageal biopsies and summary scores were calculated.
✓ Gene scores were markedly lower in newly diagnosed EoE cases compared with controls, with a very high diagnostic utility (area under the receiver operating characteristic curve was 0.927).
✓ A probabilistic range of gene scores was generated to divide patients suspected of EoE into being highly likely to have it, unlikely to have it, and indeterminate.
✓ Gene scores were highly responsive to treatment, with normalization of gene expression in EoE patients who were histological responders but not in non-responders. This suggests that the test could be used to monitor disease status.
1. Liacouras CA, Furuta GT, Hirano Iet al.Eosinophilic esophagitis: updated consensus recommendations for children and adults.J Allergy Clin Immunol2011;128: 3–20.e6. 2. Dellon ES, Gonsalves N, Hirano Iet al.ACG Clinical Guideline: evidence based approach to
the diagnosis and management of esophageal eosinophilia and eosinophilic esophagitis.Am J Gastroenterol2013;108: 679–692.
3. Dellon ES, Aderoju A, Woosley JTet al.Variability in diagnostic criteria for eosinophilic esophagitis: a systematic review.Am J Gastroenterol2007;102: 2300–2313. 4. Sperry SL, Shaheen NJ, Dellon ES. Toward uniformity in the diagnosis of eosinophilic
esophagitis (EoE): the effect of guidelines on variability of diagnostic criteria for EoE.
Am J Gastroenterol2011;106: 824–832; quiz 833.
5. Dellon ES, Liacouras CA. Advances in clinical management of eosinophilic esophagitis.
Gastroenterology2014;147: 1238–1254.
6. Rodrigo S, Abboud G, Oh Det al.High intraepithelial eosinophil counts in esophageal squamous epithelium are not specific for eosinophilic esophagitis in adults. Am J Gastroenterol2008;103: 435–442.
7. Genta RM, Spechler SJ, Souza RF. The twentieth eosinophil.Adv Anat Pathol2007;14: 340–343.
8. Kim HP, Vance RB, Shaheen NJet al.The prevalence and diagnostic utility of endoscopic features of eosinophilic esophagitis: a meta-analysis.Clin Gastroenterol Hepatol2012;10: 988–996.e5.
9. Aceves SS, Newbury RO, Dohil MAet al.A symptom scoring tool for identifying pediatric patients with eosinophilic esophagitis and correlating symptoms with inflammation.Ann Allergy Asthma Immunol2009;103: 401–406.
10. Mulder DJ, Hurlbut DJ, Noble AJet al.Clinical features distinguish eosinophilic and reflux-induced esophagitis.J Pediatr Gastroenterol Nutr2013;56: 263–270.
11. von Arnim U, Wex T, Rohl FWet al.Identification of clinical and laboratory markers for predicting eosinophilic esophagitis in adults.Digestion2011;84: 323–327.
12. Dellon ES, Rusin S, Gebhart JHet al.A clinical prediction tool identifies cases of eosinophilic esophagitis without endoscopic biopsy: a prospective study.Am J Gastroenterol2015;110: 1347–1354.
13. Kirsch R, Bokhary R, Marcon MA et al. Activated mucosal mast cells differentiate eosinophilic (allergic) esophagitis from gastroesophageal reflux disease. J Pediatr Gastroenterol Nutr2007;44: 20–26.
14. Mueller S, Neureiter D, Aigner Tet al.Comparison of histological parameters for the diagnosis of eosinophilic oesophagitis versus gastro-oesophageal reflux disease on oesophageal biopsy material.Histopathology2008;53: 676–684.
15. Dellon ES, Chen X, Miller CRet al.Tryptase staining of mast cells may differentiate eosinophilic esophagitis from gastroesophageal reflux disease.Am J Gastroenterol2011;
106: 264–271.
16. Dellon ES, Chen X, Miller CRet al.Diagnostic utility of major basic protein, eotaxin-3, and leukotriene enzyme staining in eosinophilic esophagitis.Am J Gastroenterol2012;107: 1503–1511.
17. Protheroe C, Woodruff SA, de Petris Get al.A novel histologic scoring system to evaluate mucosal biopsies from patients with eosinophilic esophagitis.Clin Gastroenterol Hepatol
2009;7: 749–755.e11.
18. Hirano I, Moy N, Heckman MGet al.Endoscopic assessment of the oesophageal features of eosinophilic oesophagitis: validation of a novel classification and grading system.Gut2013;
62: 489–495.
19. van Rhijn BD, Warners MJ, Curvers WLet al.Evaluating the endoscopic reference score for eosinophilic esophagitis: moderate to substantial intra- and interobserver reliability.
Endoscopy2014;46: 1049–1055.
20. Dellon ES, Cotton CC, Gebhart JHet al.Accuracy of the eosinophilic esophagitis endoscopic reference score in diagnosis and determining response to treatment.Clin Gastroenterol Hepatol2016;14: 31–39.
21. Dellon ES, Rusin S, Gebhart JHet al.Utility of a non-invasive serum biomarker panel for diagnosis and monitoring of EoE: a prospective study.Am J Gastroenterol2015;110: 821–827.
22. Gupta SK, Fitzgerald JF, Kondratyuk Tet al.Cytokine expression in normal and inflamed esophageal mucosa: a study into the pathogenesis of allergic eosinophilic esophagitis.
J Pediatr Gastroenterol Nutr2006;42: 22–26.
23. Konikoff MR, Blanchard C, Kirby Cet al.Potential of blood eosinophils, eosinophil-derived neurotoxin, and eotaxin-3 as biomarkers of eosinophilic esophagitis.Clin Gastroenterol Hepatol2006;4: 1328–1336.
24. Subbarao G, Rosenman MB, Ohnuki Let al.Exploring potential noninvasive biomarkers in eosinophilic esophagitis in children.J Pediatr Gastroenterol Nutr2011;53: 651–658. 25. Blanchard C, Wang N, Stringer KFet al.Eotaxin-3 and a uniquely conserved
gene-expression profile in eosinophilic esophagitis.J Clin Invest2006;116: 536–547. 26. Sherrill JD, Kiran KC, Blanchard Cet al.Analysis and expansion of the eosinophilic
esophagitis transcriptome by RNA sequencing.Genes Immun2014;15: 361–369.
27. Lexmond WS, Hu L, Pardo Met al.Accuracy of digital mRNA profiling of oesophageal biopsies as a novel diagnostic approach to eosinophilic oesophagitis.Clin Exp Allergy2015;
45: 1317–1327.
28. Wen T, Stucke EM, Grotjan TMet al.Molecular diagnosis of eosinophilic esophagitis by gene expression profiling.Gastroenterology2013;145: 1289–1299.
29. Rothenberg ME. Molecular, genetic, and cellular bases for treating eosinophilic esophagitis.
Gastroenterology2015;148: 1143–1157.
30. Dellon ES, Gebhart JH, Higgins LLet al.The esophageal biopsy "pull" sign: a highly specific and treatment-responsive endoscopic finding in eosinophilic esophagitis (with video).
Gastrointest Endosc2016;83: 92–100.
31. Dellon ES, Yellore V, Andreatta Met al.A single biopsy is valid for genetic diagnosis of eosinophilic esophagitis regardless of tissue preservation or location in the esophagus.
J Gastrointestin Liver Dis2015;24: 151–157.
32. Wen T, Dellon ES, Moawad FJet al.Transcriptome analysis of proton pump inhibitor-responsive esophageal eosinophilia reveals proton pump inhibitor-reversible allergic inflammation.J Allergy Clin Immunol2015;135: 187–197.
33. Gonsalves N, Policarpio-Nicolas M, Zhang Qet al.Histopathologic variability and endoscopic correlates in adults with eosinophilic esophagitis.Gastrointest Endosc2006;64: 313–319. 34. Dellon ES, Speck O, Woodward K et al. Distribution and variability of esophageal
eosinophilia in patients undergoing upper endoscopy.Mod Pathol2015;28: 383–390. 35. Dellon ES, Fritchie KJ, Rubinas TCet al.Inter- and intraobserver reliability and validation of a
new method for determination of eosinophil counts in patients with esophageal eosinophilia.
Dig Dis Sci2010;55: 1940–1949.
36. Dellon ES, Sheikh A, Speck Oet al.Viscous topical is more effective than nebulized steroid therapy for patients with eosinophilic esophagitis.Gastroenterology2012;143: 321–324.e1. 37. Alexander JA, Jung KW, Arora ASet al.Swallowed fluticasone improves histologic but not symptomatic responses of adults with eosinophilic esophagitis.Clin Gastroenterol Hepatol
2012;10: 742–749.e1.
38. Butz BK, Wen T, Gleich GJet al.Efficacy, dose reduction, and resistance to high-dose fluticasone in patients with eosinophilic esophagitis.Gastroenterology2014;147: e5. 39. Gonsalves N, Yang GY, Doerfler Bet al.Elimination diet effectively treats eosinophilic
esophagitis in adults; food reintroduction identifies causative factors.Gastroenterology2012;
142: 1451–1459.e1.
40. Wolf WA, Jerath MR, Sperry SLet al.Dietary elimination therapy is an effective option for adults with eosinophilic esophagitis.Clin Gastroenterol Hepatol2014;12: 1272–1279. 41. Wolf WA, Cotton CC, Green DJet al.Evaluation of histologic cutpoints for treatment
response in eosinophilic esophagitis.J Gastroenterol Hepatol Res2015;4: 1780–1787. 42. Hsu Blatman KS, Gonsalves N, Hirano Iet al.Expression of mast cell-associated genes is
upregulated in adult eosinophilic esophagitis and responds to steroid or dietary therapy.
J Allergy Clin Immunol2011;127: 1307–1308.e3.
43. Lu TX, Sherrill JD, Wen Tet al.MicroRNA signature in patients with eosinophilic esophagitis, reversibility with glucocorticoids, and assessment as disease biomarkers.J Allergy Clin Immunol2012;129: 1064–1075.e9.
44. Lucendo AJ, Arias A, De Rezende LCet al.Subepithelial collagen deposition, profibrogenic cytokine gene expression, and changes after prolonged fluticasone propionate treatment in adult eosinophilic esophagitis: a prospective study.J Allergy Clin Immunol2011;128: 1037–1046.
45. Matoso A, Mukkada VA, Lu Set al.Expression microarray analysis identifies novel epithelial-derived protein markers in eosinophilic esophagitis.Mod Pathol2013;26: 665–676. 46. Hirano I. Therapeutic end points in eosinophilic esophagitis: is elimination of esophageal
eosinophils enough?Clin Gastroenterol Hepatol2012;10: 750–752.
47. Saffari H, Peterson KA, Fang JCet al.Patchy eosinophil distributions in an esophagectomy specimen from a patient with eosinophilic esophagitis: implications for endoscopic biopsy.
J Allergy Clin Immunol2012;130: 798–800.
Clinical and Translational Gastroenterologyis an open-access journal published byNature Publishing Group. This work is licensed under a Creative Commons Attribution-NonCommercial-NoDerivs 4.0 International License. The images or other third party material in this article are included in the article’s Creative Commons license, unless indicated otherwise in the credit line; if the material is not included under the Creative Commons license, users will need to obtain permission from the license holder to reproduce the material. To view a copy of this license, visit http:// creativecommons.org/licenses/by-nc-nd/4.0/