DEVELOPMENT OF DYNAMIC SUBSTRATES FOR STUDIES OF CELL ADHESION AND MIGRATION
Eun-ju Lee
A dissertation submitted to the faculty of the University of North Carolina at Chapel Hill in partial fulfillment of the requirements for the degree of Doctor of Philosophy in the
Department of Chemistry.
Chapel Hill 2009
ABSTRACT
Eun-ju Lee
Development of Dynamic Substrates for Studies of Cell Adhesion and Migration (Under the direction of Muhammad Yousaf)
iii
ACKNOWLEDGEMENT
I would like to thank my advisor Muhammad Yousaf for guiding me through the Ph.D. course. His support and encouragement let me explore diverse areas of science. I also would like to thank my committee members.
I am grateful to my group members both past and present. I will never forget the earliest time in our group with Dr. Eugene Chan and Wei Luo. I can find their devotion and efforts in initiating the actual research in every corner in the lab and I appreciate the challenging but rewarding time with them. All members have greatly contributed to the shape of our group and I am very thankful.
I have been very lucky to share many moments with my friends in Chapel Hill. I cherish the sharing of our science and thoughts with Ralph and all other members of the literature study groups. Junghoon and Jiwhan always showed me what true friendship is. Mizumi and Sungjin always took good care of me as if they are my “sempai”. I was very fortunate to meet Candida and she has inspired me in so many ways and let me mature as a person. I always feel loved by such good people and they made my life in Chapel Hill even more memorable.
v
TABLE OF CONTENTS
List of Tables……….. viii
List of Figures………. ix
CHAPTER: 1. Chemical Design and Development of a Model Substrate Introduction………. 1
Results and Discussion……… 9
Conclusion………... 25
Materials and Methods……… 25
REFERENCES………... 33
2. Application of Model Substrate in Cell Biology Introduction………. 39
Results and Discussion……… 54
Conclusion………... 99
Materials and Methods……… 103
vii 3. Development of Gradient Surfaces for Biology
Introduction………. 121
Results and Discussion……… 127
Materials and Methods……… 157
REFERENCES……….... 164
4. The Use of a Model Substrate for Cell Adhesion in Dip-pen Nanolithography and Total Internal Reflection Fluorescence Microscopy Introduction………. 170
Results and Discussion……… 174
Materials and Methods……… 189
List of Tables
ix
List of Figures
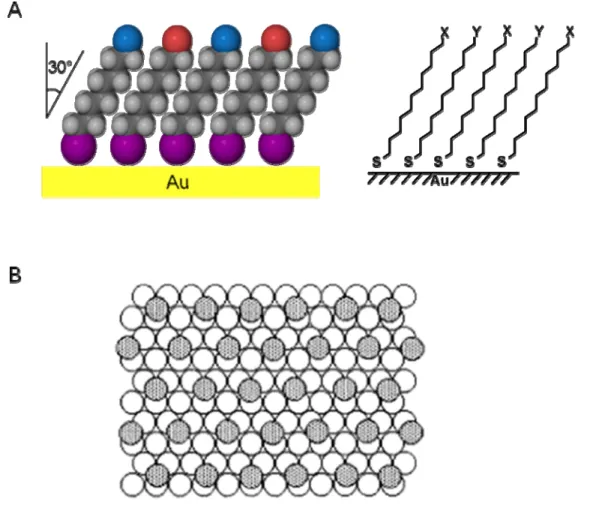
Figure 1-1. Representation of self-assembled monolayer (SAM) of alkanethiolates
on the surface of gold……… 3
Figure 1-2. Synthetic route to hydroquinone alkanethiol (1d)………. 10 Figure 1-3. Characterization of redox active monolayers………. 11 Figure 1-4. The relationship between electrochemical signals and the densities of
redox active molecules on the SAMs………. 14 Figure 1-5. Ligand immobilization onto the SAM surface by oxime formation…….. 16 Figure 1-6. Characterization of ligand immobilization reaction on the SAM surface. 17 Figure 1-7. Synthetic route of tetra(ethylene glycol) alkanethiol (1g)………. 19 Figure 1-8. Structure of inert SAMs………. 20 Figure 1-9. Synthetic route to hydroquinone-tetra(ethylene glycol) alkanethiol (1l)... 22 Figure 1-10. Cyclic voltammogram characterization of the electroactive monolayers... 24 Figure 2-1. Global and local integrin conformational changes associated with
affinity regulation………... 41
Figure 2-2. Schematic diagram showing the complexity of the cell-ECM adhesion
interaction………... 42
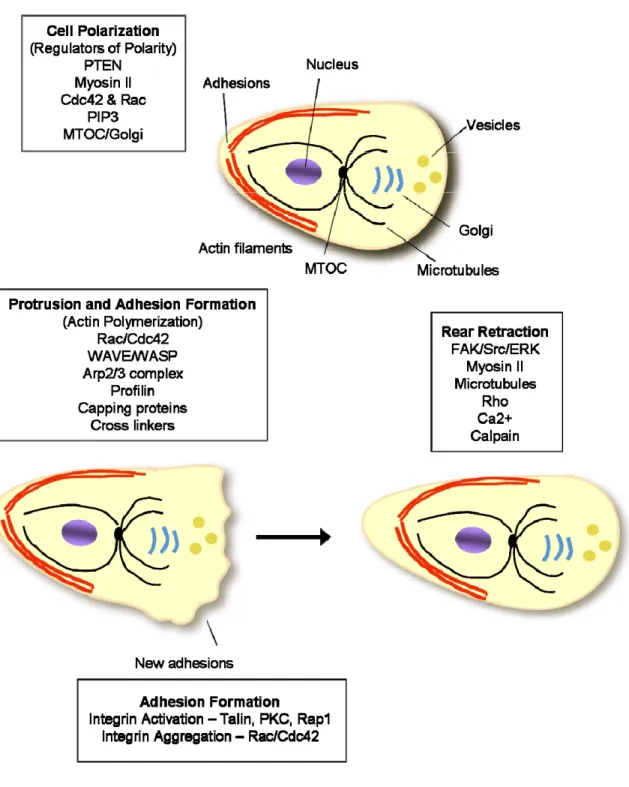
Figure 2-3. Steps in cell migration and the components for regulation of polarity….. 46 Figure 2-4. A chemical strategy for immobilization of ligand (RGD) for cell
adhesion……….. 53
Figure 2-5. Microcontact printing………. 56 Figure 2-6. Example of a dynamic substrate for spatial and temporal control of cell
migration and growth………. 58
Figure 2-7. Example of cell migration and growth dependence on geometry and
population of cells……….. 62
Figure 2-9. Non-dynamic SAM surface presenting linear and cyclic RGD…………. 67
Figure 2-10. The images of cells from the non-dynamic surfaces……….. 70
Figure 2-11. Plot of cell migration velocity versus surface density of linear, cyclic and mixture RGD peptide on non-dynamic surfaces………. 72
Figure 2-12. The images of cells from dynamic surfaces………... 74
Figure 2-13. Comparison and evaluation of cell migration memory on dynamic and non-dynamic surfaces………. 76
Figure 2-14. Comparison of fluorescent micrographs of fibroblasts with focal adhesion staining on dynamic and non-dynamic surfaces………. 80
Figure 2-15. Comparison of gene expression by whole mouse genome microarray….. 82
Figure 2-16. Hierarchical cluster analysis of microarray data……… 86
Figure 2-17. Immobilization of RGD and PHSRN onto hydroquinone/quinone monolayer………... 88
Figure 2-18. Cytoplasmic protrusions on the surface presenting RGD (A) and PHSRN (B)……….. 89
Figure 2-19. The effect of soluble PHSRN onto migration rate………. 91
Figure 2-20. Fluorescence images of cells on the surface presenting PHSRN (A) and RGD (B)………. 93
Figure 2-21. The regulation of GTPase activity………. 95
Figure 2-22. Factors in cell motility………... 96
Figure 2-23. GTPase activity assay……… 97
Figure 2-24. The activity of Rac and Rho was compared from the cells cultured on RGD and PHSRN surfaces by pull-down assay……… 98
xi
Figure 3-3. A strategy for generating gradients of immobilized peptide ligands for
attached cell culture……… 129
Figure 3-4. Representative images for the photo-patterning of fluorescent molecules and peptide ligand mediated cell attachment and migration on molecularly defined gradients……… 131
Figure 3-5. Analysis of the slopes and ligand densities along various linear-RGD ligand gradients to determine their influence on cell adhesion and migration………. 134
Figure 3-6. Relationship between ligand density, ligand affinity and gradient slope for two different cell-types………. 137
Figure 3-7. An illustration describing the dependence of ligand density (linear RGD) on the slopes of gradients for FAK+/+ cells and FAK-/- cells…………... 138
Figure 3-8. Single cell fluorescent images of polarized cells on small pattern linear-RGD immobilized gradients………... 140
Figure 3-9. A strategy for the spatial and temporal control of cell migration on dynamic gradients………... 142
Figure 3-10. Fluorescence micrographs showing morphing in which patterned cells migrated toward photo-patterned ligand area………. 145
Figure 3-11. Time-lapse micrographs showing the migration of patterned cells toward photo-generated RGD peptide gradients………. 147
Figure 3-12. A plot showing migration over time in each zone A-G from Figure 3-11. 148 Figure 3-13. Schematic overview of substrate preparation for co-culture……….. 151
Figure 3-14. Application of reductive potential to the oxime at the physiological pH releases surface-bound ligand and regenerates hydroquinone alkanethiolates………. 153
Figure 3-15. Characterization of the ligand gradient………... 155
Figure 3-16. The co-culture of two different cell lines……… 156
Figure 4-2. A schematic diagram for the preparation of electroactive nanoarrays by
DPN………. 176
Figure 4-3. Lateral force microscopy (LFM) image of an electroactive nanoarray….. 177
Figure 4-4. Cyclic voltammograms of the redox active reactant and product………... 178
Figure 4-5. Representative fluorescent micrographs of cells on linear and cyclic RGD nanoarrays……….. 181
Figure 4-6. Schematic depiction of TIRFM experiment………... 184
Figure 4-7. Patterning by microcontact printing……… 185
Figure 4-8. Preparation of electroactive nanoarray………... 186
CHAPTER 1
Chemical Design and Development of a Model Substrate
Introduction
Self-assembled Monolayers (SAMs)
SAMs have been used for controlling physical properties of interfaces, such as wetting, adhesion, lubrication and corrosion, as well as understanding fundamental aspects of interfacial phenomena [1, 2, 8, 9]. SAMs are also widely utilized to generate two-dimensional micro- and nano-structures by immobilizing biomolecules (e.g. nucleic acids, peptides and carbohydrates) and cells in a spatially controlled manner [2, 10-19].
SAMs - Alkanethiolates on Gold
The wide use of gold as a substrate for studying SAMs is due to several advantageous characteristics: 1. gold is exceptionally easy to pattern by a combination of lithographic tools and chemical etchants; 2. gold is a reasonably inert metal thus it does not react with atmospheric oxygen or most chemicals; 3. gold binds thiols with a high affinity and does not undergo any unusual reactions with them; 4. thin films of gold are common substrates used for a number of existing spectroscopies and analytical techniques, and; 5. gold is compatible with cells that can adhere and function on gold surfaces without evidence of toxicity [1-3, 16]. SAMs formed from thiols on gold are stable for periods of days to weeks when in contact with the complex liquid media required for cell studies. The ordering of alkanethiols is driven by the strong affinity between sulfur and gold, the lateral van der Waals interactions between the tethered alkyl chains, and the dipole interactions between polar end groups.
3
lattice is shown in Figure 1-1B. The arrangement shown is a (√3 x √3) R 30° structure where the sulfur atoms (dark gray circles) are positioned in the three-fold hollows of the gold lattice (white circles). The geometric arrangement of the sulfur moieties on the surface and the nearest-neighbor distances between the metal atoms at the surface are factors that determine the upper limit on the density of molecules on the surface. For the organic layer, the molecules adopt conformations that allow high degrees of van der Waals interactions with the neighboring molecules to minimize the free energy. These arrangements yield a secondary level of organization in the monolayer that is important in determining macroscopic materials properties, such as wetting, of the SAMs. The electron diffraction studies indicated that the symmetry of sulfur atoms in a monolayer is hexagonal with a spacing between sulfur atoms of 4.97 Å, and calculated area per molecule of 21.4 Å2 [21].
From the kinetic studies, the adsorption of alkanethiol onto gold (111) surfaces was found to strongly depend on alkanethiol concentration [1, 2]. At 1 mM solution of alkanethiol, the monolayer is formed within a few minutes while it takes over 100 minutes at 1 µM concentration [22]. Chemisorption of alkanethiols as well as of di-n-alkyl disulfides on clean gold gives indistinguishable monolayers [20, 23].
The strong chemical bonding that is exhibited is best described by Au+ and RS–. A simple oxidative addition of the S-S bond to the gold surface is possibly the mechanism in the formation of SAMs from disulfides:
5
There is evidence supporting this disulfide bond cleavage mechanism and the subsequent formation of a gold thiolate species. The rates of formation of SAMs from dialkyl disulfides or alkanethiols are indistinguishable, but the rate of replacement of molecules from SAMs by thiols was much faster than by disulfides.
In the alkanethiol case, the reaction may be considered formally as an oxidative addition of the S-H bond to the gold surface, followed by a reductive elimination of the hydrogen:
RSH + Au(0)n → RS–Au+·Au(0)n-1 + ½ H2
The combination of hydrogen atoms at the metal surface to yield H2 molecules may be an important exothermic step in the overall chemisorption energetics. It has been shown that the adsorbing species is the thiolate (RS–) by XPS [6, 24, 25], Fourier transform infrared spectroscopy (FTIR) [25, 26], Fourier transform mass spectrometry [27], electrochemistry [28], and Raman spectroscopy [29]. On the basis of the bond energies of H, H2 and RS-Au (87, 104 and 40 kcal/mol, respectively), the net energy for adsorption of alkanethiolates on gold would be ca. -5 kcal/mol (exothermic) [1]. Nuzzo and co-workers used grazing-angle FTIR to show that the alkyl chains are trans-extended, close-packed and tilted approximately 30° from the normal to the surface [20].
monolayer, thus enhancing control over surface composition and properties [4, 30]. The densities of mixed SAMs can also be controlled by adjusting the ratio of alkanethiols. For SAMs formed from alkanethiols on gold, the typical surface density of molecules when maximum coverage is obtained is ~4.5 × 10¹⁴ molecules/cm2 [2]. Most spectroscopic and experimental evidence suggests that the average properties of SAMs formed from n-alkanethiols (e.g. wettability, mass coverage) do not change significantly when exposed to ~1 mM solutions of alkanethiols for more than 12-18 hours.
Stimuli-responsive SAM Surfaces for Bio-application
Simple small functional groups (-OH, -COOH) are often adequate for studies of properties relevant to materials science such as wettability, friction, adhesion and corrosion resistance. If we consider that these applications are based on the “static” property of SAMs, the introduction of a dynamic property onto the surface is challenging but of great interest. By a method which induces surface reactions only when needed we can generate stimuli-responsive surfaces in which the physical, chemical and biological properties of surfaces are tuned [12, 31-35]. The surfaces that can be changed or tuned in an accurate and predictable manner by using an external stimulus have numerous applications in science and technology ranging from environmental cleanup to data storage.
7
incorporation of ligands into SAMs that are not compatible with synthetic methods can be achieved. Good candidate methods to create a switchable surfaces via simple modifications of SAMs are photochemically induced and electrochemically induced reactions [8]. Photochemical reactions can be combined with photolithography in which photolabile protecting groups are site-selectively removed upon exposure to light for microfabrication [36]. This kind of surface reaction will be discussed further in the Chapter 3.
Electrochemically induced surface reactions involve an electron transfer between a surface (e.g. gold and silicon) and a reaction site. Dynamic control of surface properties could be achieved by application of electrical potentials and reversible oxidation-reduction reactions. Langer and co-workers reported SAM surfaces which undergo dynamic changes in interfacial properties in response to an electrical potential [34]. The wettability was altered by the conformational transitions of the single-layered molecules between a hydrophilic and hydrophobic state. The stimuli-responsive changes in wettability are of interest for the development of micro- and nanofluidic devices, self-cleaning and anti-fog surfaces and sensor devices [12, 33, 37]. Biosensors, which transduce a bio-recognition event into measurable electronic or opto-electronic signals, have a crucial role in a wide range of applications, including clinical diagnosis, environmental monitoring, forensic analysis and anti-terrorism [14, 38]. Kwak and co-workers invented an enzyme-amplified immunosensor using redox mediation of a ferrocene-dendrimer which was immobilized to the electrode surface of carboxylic acids SAMs [39].
migration at the liquid-solid interface can be useful in diverse biological and medical applications [15, 17, 40-42]. Mrksich and Yousaf generated hydroquinone-presenting SAMs and the electrochemically oxidized quinone was used for immobilizing various functional molecules onto the surface through Diels-Alder reactions [43-45]. Although this strategy provides a rapid and selective immobilization of biomolecules, the syntheses of cyclopentadiene tethered molecules for Diels-Alder reactions are challenging. In particular, the use of cyclopentadiene for common solid-phase peptide synthesis is not feasible because the cyclopentadiene readily decomposes under cleavage conditions. Alternatively, the Michael addition provides a straightforward route by using sulfhydryl groups to conjugate biomolecules onto quinone surfaces. However the resulting quinone-thiol conjugate has a redox-active signal similar to that of the quinone starting material thus the product cannot be distinguished from the quinone by electrochemistry and the surface density of immobilized ligands cannot be determined [46, 47].
9 Results and Discussion
Synthesis of Hydroquinone Alkanethiol (1d)
The hydroquinone-terminated alkanethiol (1d) was synthesized as shown in Figure 1-2. The p-dimethoxybenzene is deprotonated by the strong base t-butyllithium which reacts with undecenylbromide to provide 11-(2, 5-Dimethoxyphenyl)-1-undecene (1a). Subsequent photoaddition of 1a in the presence of thiolacetic acid converted the alkene to a terminal thioacetate (1b). Addition of BBr3 converted the methoxy groups on the aromatic ring to hydroxyl groups (1c). Acid hydrolysis of 1c resulted in the removal of the acyl group to provide the hydroquinone alkanethiol (1d).
Electrochemical Characterization of SAM
11
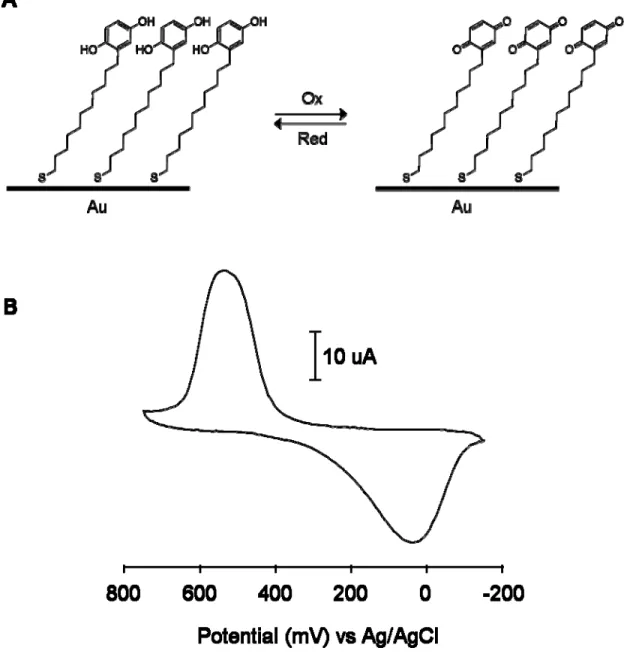
electrode (Figure 1-3B). This redox process is reversible and the repetitive scan gives an overlapping cyclic voltammogram over 6 hours.
The Density of Redox-active Molecules in the Mixed Monolayers
The electric current in cyclic voltammetry is directly related to the number of redox-active molecules on the gold surface. The total charge (Q) that was consumed in the redox process is related to the density of redox-active molecules (Γ) by equation 1-1, where n is the number of electrons involved in the redox couple (n = 2 for hydroquinone/quinone), F is Faraday’s constant, and A is the surface area of the electrode that is in contact with the electrolyte. Electric current is the flow of electric charge and it is expressed as in equation 1-2, where t is the time. Therefore the density of redox-active molecules on the gold surface is directly reflected in the peak current in cyclic voltammetry.
Q = nFAΓ (equation 1-1) I = Q/t (for a steady flow) or I = dQ/dt (equation 1-2)
Γ∝ I
13
densities of a specific alkanethiol by mixing two or more kinds of alkanethiols in a different ratio. Ideally, it should be determined whether the density of chemisorbed alkanethiol on gold surface accurately reflects the density in solution which is used for SAM formation.
Since the peak current in cyclic voltammetry is directly related to the density of hydroquinone alkanethiol on a gold surface, an experiment was designed to compare the current values from different densities of hydroquinone alkanethiol. Mixed SAMs of hydroquinone (HQ)-terminated alkanethiol and hydroxyl group (OH)-terminated alkanethiol were prepared at various ratios with total concentration of 1 mM in an ethanol solution (the ratio of HQ/OH = 100/0, 75/25, 50/50, and 25/75). Using the SAM substrates as the working electrode, cyclic voltammetry was performed. Figure 1-4A shows the cyclic voltammogram of various mixed SAM surfaces. The substrate with higher ratio of HQ over OH in the SAM solution presents a stronger signal because more electroactive molecules are chemisorbed on the gold surface.
15
surface. In other words the mole fraction of HQ in solution (χHQ solution) is equal to the mole fraction of HQ on surface (χHQ surface). From this result we assume that the molecular density of HQ in the SAM solution is considered as the density of HQ on the gold surface.
Immobilization of Ligand onto the SAM Surface
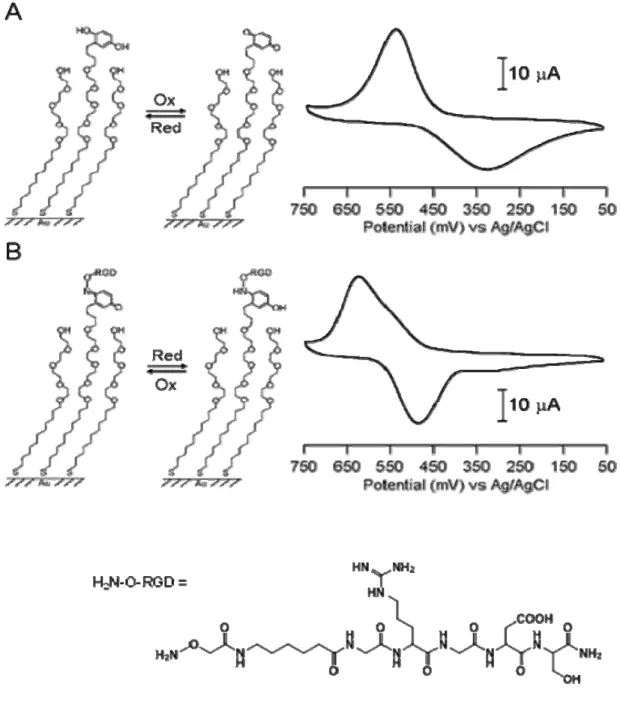
Figure 1-5. Ligand immobilization onto the SAM surface by oxime formation. A. Redox-active hydroquinone monolayer undergoes electrochemical oxidation to the quinone. The resulting quinone then reacts chemoselectively with aminooxy acetic acid to give the corresponding oxime. B. Cyclic voltammograms recorded in 10-min intervals at a scan rate of 50 mV/s showed the extent of the interfacial reaction between soluble aminooxy acetic acid (150 mM) and quinone monolayer. The peaks at 580 mV and 44 mV correspond to the redox coupling of the quinone, whereas the peaks at 480 mV and 350 mV correspond to the redox peaks of the product oxime.
A
17
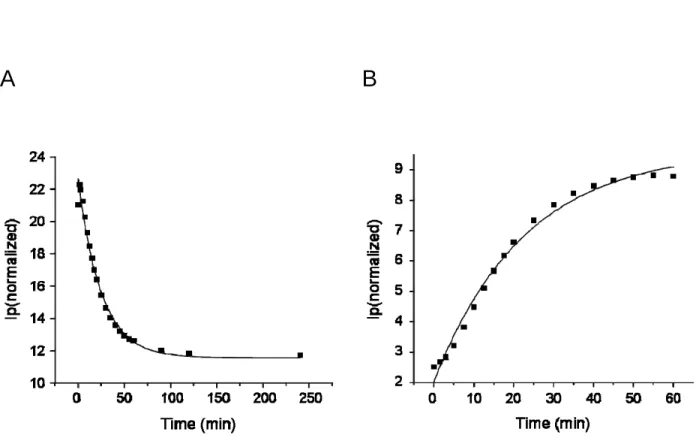
Figure 1-6. Characterization of ligand immobilization reaction on the SAM surface. The change of peak current at 30 mV and 330 mV from the cyclic voltamograms of Figure1-5B were plotted against time. They give the rates of the decrease of quinone monolayer (A) and the formation of oxime on the surface (B).
As the potentials for oxidation and reduction of oxime are distinguished from those of hydroquinone/quinone, the extent of the interfacial reaction can be monitored in situ by cyclic voltammetry.
Since the peak current changes in the cyclic voltammetry are the consequences of quinone consumption and oxime formation, they provide kinetic information of the interfacial reaction. The plot in Figure 1-6 shows the peak current changes versus time for the cyclic voltammograms shown in Figure 1-5B. The decrease is at 30 mV and the increase is at 330 mV in the peak currents. The rate for the loss in peak currents of the quinone monolayer (30 mV) would follow pseudo first-order kinetics because the aminooxy acetic acid was in large excess relative to the immobilized quinone. The data was fitted to an exponential decay (equation 1-3) to obtain a pseudo first-order rate constant (k’) of 0.040 min-1, where It is the peak current at time t, I0 is the initial peak current and If is the residual nonfaradaic current.
It = If + (I0 – If) e-k’t (equation 1-3)
The increase of the peak current at 330 mV for the formation of oxime gave the pseudo first-order rate constant of 0.044 min-1. The excellent fit of the experimental data to this equation (R2 > 0.98) indicates that quinone groups are sufficiently isolated on the monolayer that the reactivity is independent of the extent of the reaction.
19
21
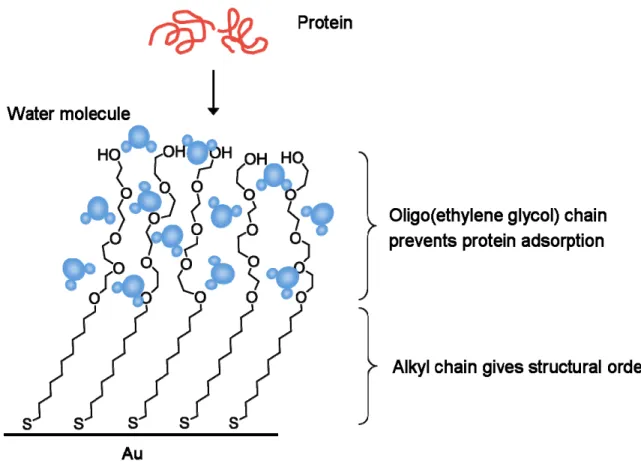
cells in order to study biospecific interactions on the surface. Oligo(ethylene glycol) groups are well known to reduce non-specific protein adsorption and have desired degrees of hydrophilicity and adsorptivity toward biological molecules [16, 51-53]. As depicted in Figure 1-7, an alkanethiol functionalized with tetra(ethylene glycol) group was synthesized (1g). The C11 alkyl chain contributes to the structural order of the SAM on the gold surface and the tetra(ethylene glycol) chain prevents protein adsorption onto the monolayer (Figure 1-8). The resistance of oligo(ethylene glycol) groups (EG) to the adsorption of proteins is generally considered a steric repulsion effect, where the EG prevents the protein from reaching the substrate surface to adsorb [53]. Protein resistance is only observed for the RT stable hydrated phase of EG. When the protein reaches the interphase by diffusion and compresses the EG layer, removal of water molecules from solvated EG chains and lessening conformational freedom of EG chains bring loss in both enthalpy and entropy. Thus the protein cannot be adsorbed onto the monolayer. The SAM substrate produced with 100 % tetra(ethylene glycol)-alkanethiol is completely inert and it was observed that no cells or protein attached to the substrate even after a week of incubation under cell culture conditions.
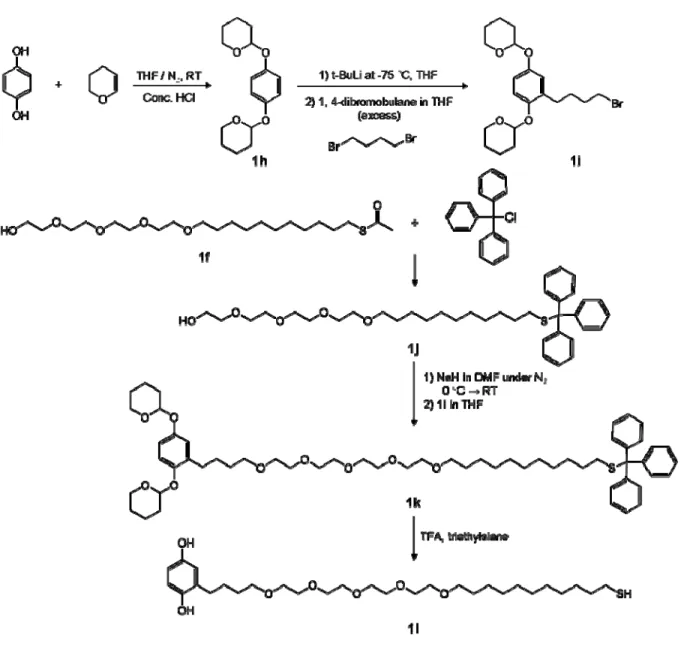
Synthesis of Hydroquinone-tetra(ethylene glycol) alkanethiol
23
tetrahydropyran-hydroquinone-butylbromide (1i). Addition of sodium hydride to deprotonate tetra(ethylene glycol)alkanethiol-trityl (1j) followed by addition of the bromide (1i) afforded the conjugate (1k). The conjugate was deprotected with trifluoroacetic acid (TFA) to provide the hydroquinone-tetra(ethylene glycol)alkanethiol (1l).
Immobilization of Biological Ligand on the SAM Surface
The tripeptide RGD sequence is found within the central binding domain of several adhesive proteins present in extracellular matrix [54-57]. To mimic the adhesive proteins a short peptide that included the RGD sequence was synthesized with the N-terminal modified to have an oxyamine functional group.
25
distinguish the oxime product from the initial hydroquinone-quinone redox couple enables the quantification of the amount of ligand molecules installed on the surface.
Conclusion
The SAMs of hydroquinone alkanethiols were used for the immobilization of oxyamine group-functionalized ligands. The electrochemistry based on the differing signal between hydroquinone/quinone and the oxime product enabled characterization of the density of the immobilized ligand on the substrate surface. To apply this electroactive substrate in cell biology, a SAM with resistance to the non-specific protein adsorption was prepared and a biological ligand (RGD peptide) was successfully immobilized onto the substrate surface.
Materials and Methods
All the solvents for the synthetic procedures were HPLC grade. THF was distilled from sodium benzophenone under nitrogen before use. Absolute ethanol was purchased from Aaper Alcohol & Chemical Company. Flash chromatography was carried out using silica gel (230 – 400 mesh). All amino acids and resin were purchased from Anaspec, Inc. (La Jolla, CA). All other chemical reagents were purchased from Sigma Aldrich and Acros and used as received.
11-(2, 5-Dimethoxyphenyl)-1-undecene (1a)
period of 30 minutes. The resulting yellow solution was stirred at RT for 1 hour and a solution of undecenylbromide (1.88 mL, 8.66 mmol) in THF (10 mL) was added. The colorless reaction mixture was stirred for 12 hours at RT under atmosphere of nitrogen. The reaction mixture was concentrated by rotary evaporation and diluted with ethyl acetate. The solution was washed with saturated NH4Cl solution, water, and brine and dried over Na2SO4. The organic layer was concentrated to a pale yellow oil and purified by column chromatography with hexane/ethyl acetate (96/4) to give 2.3 g of product as colorless oil (91.5 % yield). 1H NMR (400 MHz, CDCl3) δ 1.26 (br s, 12 H), 1.52 (br s, 2 H), 2.01 (q, 2 H), 2.55 (t, 2 H, J = 7.7 Hz), 3.75 (s, 3 H), 3.76 (s, 3 H), 4.89-5.0 (m, 2 H), 5.79 (m, 1 H), 6.64-6.75 (m, 3 H).
11-(2, 5-Dimethoxyphenyl)-1-(thioacetyl)undecane (1b)
Solution of 1a (2.3 g, 7.92 mmol) in dry THF (50 mL) was refluxed under an atmosphere of nitrogen followed by the addition of AIBN (2, 2’-azobisisobutyronitrile, 40-50 mg). Into the reaction flask thiolacetic acid (1.132 mL, 15.838 mmol) was added dropwise and the reaction was stirred for 12 hours with refluxing. The reaction mixture was concentrated and purified by column chromatography with hexane/ethyl acetate (8/2) to afford 2.4 g of product (82.7 % yield). 1H NMR (400 MHz, CDCl3) δ 1.24 (br s, 14 H), 1.54 (m, 4 H), 2.30 (s, 3 H), 2.54 (t, 2 H, J = 7.7 Hz), 2.84 (t, 2 H, J = 7.3 Hz), 3.74 (s, 3 H), 3.75 (s, 3 H), 6.64-6.87 (m, 3 H).
11-(2, 5-Dihydroxylphenyl)-1-(thioacetyl)undecane (1c)
27
tribromide (6.19 mL, 65.5 mmol) was added and the mixture was allowed to warm to RT and stirred for 2 hours. The reaction was cooled to -78 °C and quenched by addition of diethyl ether and water. The organic layer was washed with water and brine and dried over Na2SO4. The removal of the solvent gave yellow solid and was used for the next reaction without further purification. 1H NMR (400 MHz, CDCl3) δ 1.24 (br s, 14 H), 1.54 (m, 4 H), 2.31 (s, 3 H), 2.52 (t, 2 H, J = 7.7 Hz), 2.84 (t, 2 H, J = 7.4 Hz), 6.43-6.70 (m, 3 H).
11-(2, 5-Dihydroxylphenyl)-1-mercaptoundecane (1d, Hydroquinone alkanethiol )
The crude product 1c (assuming 6.55 mmol) was dissolved in MeOH (50 mL) and concentrated HCl (12 M, 5 mL) was added. The mixture was heated to reflux for 12 hours. The removal of the solvent resulted in a white solid and was dissolved in a small volume of ethyl acetate. The reaction product residue was precipitated by adding into hexane. The hexane was removed after centrifuge at 5000 rpm for 15 min. The residue was further purified by column chromatography with hexane/ethyl acetate (75/25) to give 0.7 g of product as white powder (36 % yield). 1H NMR (400 MHz, CDCl3) δ 1.26 (br s, 14 H), 1.56 (m, 4 H), 2.47-2.54 (m, 4 H), 6.51-6.63 (m, 3 H).
Undec-1-en-11-yltetra(ethylene glycol) (1e)
H), 1.55 (qui, 2 H), 2.02 (q, 2 H), 3.42 (t, 2 H), 3.56-3.70 (m, 16 H), 4.89-4.99 (m, 2 H), 5.73-5.84 (m, 1 H).
1-(Thiolacetyl)undec-11-yltetra(ethylene glycol) (1f)
Solution of 1e (1.10 g, 3.18 mmol) in dry THF (15 mL) was refluxed under an atmosphere of nitrogen followed by the addition of AIBN (2, 2’-azobisisobutyronitrile, 5-7 mg). Two equivalents of thiolacetic acid (0.45 mL, 6.36 mmol) were added dropwise and the reaction mixture was stirred for 12 hours under reflux conditions. Concentration of the reaction mixture by rotary evaporation at reduced pressure followed by purification by column chromatography with ethyl acetate gave the thioacetate (1.0 g) in 74.5 % yield. 1H NMR (400 MHz, CDCl3) δ 1.24 (br s, 14 H), 1.53 (m, 4 H), 2.30 (s, 3 H), 2.84 (t, 2 H, J = 7.4 Hz), 3.42 (t, 2 H, J = 6.8 Hz), 3.56-3.72 (m, 16 H).
1-Mercaptoundec-11-yltetra(ethylene glycol) (1g)
A solution of 1f (1.0 g, 2.37 mmol) in 0.1 M HCl in EtOH (20 mL) was refluxed for 12 hours. The solvent was removed by rotary evaporation and the resulting yellow oil was dissolved in ethyl acetate. To neutralize 1 M NaHCO3 was added and the organic layer was separated by using a separatory funnel. After washing with water and brine solution the reaction mixture was concentrated and purified by column chromatography with ethyl acetate to give the thiol (0.8 g) in 88.8 % yield. 1H NMR (400 MHz, CDCl3) δ 1.24 (br s, 14 H), 1.55 (m, 4 H), 2.50 (q, 2 H, J = 7.4 Hz), 3.42 (t, 2 H, J = 6.8 Hz), 3.56-3.71 (m, 16 H).
29
mixture was stirred for 10 hours at RT. The clear solution was concentrated by rotary evaporation and the resulted white solid was dissolved in methylene chloride. The mixture was washed with 1 M NaHCO3 and brine, and dried over Na2SO4. Concentration of the solution by rotary evaporation resulted in white solid and was purified by recrystallization in methylene chloride (7.2 g, 86.2 % yield). 1H NMR (400 MHz, CDCl3) δ 1.59-1.66 (m, 6 H), 1.80-1.84 (m, 4 H), 1.94-1.97 (m, 2 H), 3.47-3.55 (m, 2 H), 3.88-3.94 (m, 2 H), 5.28 (t, 2 H, J = 3.2 Hz), 6.95 (s, 4 H).
Di-tetrahydropyran-hydroquinone-butylbromide (1i)
Tetra(ethylene glycol)undecanethiol-trityl (1j)
To a solution of 1-(thiolacetyl)undec-11-yltetra(ethylene glycol)) (1f) (2.0 g, 4.73 mmol) in absolute EtOH (40 mL) was added concentrated HCl (1.5 mL). The reaction mixture was refluxed for 16 hours and cooled to RT. The pH of the solution was adjusted to 7 with 5 % methanolic NH4OH. The solution was extracted with methylene chloride and the resulted crude oil was added with dry THF (40 mL) and triphenylmethyl chloride (2.0 g, 7.17 mmol). The reaction mixture was stirred under nitrogen at RT for 18 hours and then concentrated. The purification by column chromatography with hexane/ethyl acetate (1/1) gave the product (1.4 g, 47.5 % yield). 1H NMR (400 MHz, CDCl3) δ 1.14-1.26 (m, 16 H), 1.55 (m, 2 H), 2.10 (t, 2 H, J = 7.3 Hz), 2.74 (s, 1 H), 3.42 (t, 2 H, J = 6.8 Hz), 3.56-3.71 (m, 16 H), 7.16-7.19 (m, 3 H), 7.23-7.27 (m, 6 H), 7.37-7.40 (m, 6 H).
Di-tetrahydropyran-hydroquinone-tetra(ethylene glycol)alkane-trityl (1k)
31
2 H), 6.84-6.88 (m, 2 H), 7.02-7.04 (m, 1 H), 7.18-7.22 (m, 3 H), 7.26-7.30 (m, 6 H), 7.42-7.45 (m, 6 H).
Hydroquinone-tetra(ethylene glycol) alkanethiol (1l)
To a solution of trityl (1k) (971 mg, 1.25 mmol) in 10 mL of methylene chloride was added triethylsilane (0.2 mL, 2.5 mmol) and trifluoroacetic acid (0.1 mL, 5% solution in CH2Cl2). This reaction mixture was stirred at RT for 8 hours and then concentrated to a yellow oil. Silica gel chromatography with hexane/ethyl acetate (1/1) afforded the product as a clear oil (0.52 g, 76.3 %). 1H NMR (400 MHz, CDCl3) δ 1.26-1.35 (m, 18 H), 1.58-1.63 (m, 4 H), 2.53-2.55 (m, 2 H), 2.63 (t, 2 H, J = 6.8 Hz), 3.48 (t, 2 H, J = 7.5 Hz), 3.57 (t, 2 H, J = 6.7 Hz), 3.60-3.68 (m, 16 H), 6.55-6.58 (m, 1 H), 6.64-6.69 (m, 2 H).
Preparation of Monolayers
All gold substrates were prepared by electron-beam deposition of titanium (3 nm) and then gold (12 nm) on glass cover slips (7.5 cm × 2.5 cm). All gold coated glass substrates were cut into 1 cm2 pieces and washed with absolute ethanol. The substrates were immersed in an ethanolic solution containing the alkanethiols (1 mM) for 12 hours, and then cleaned with ethanol prior to each experiment.
Electrochemical Measurements
Solid-Phase Peptide Synthesis - Linear RGD
All peptides were synthesized by automated solid phase peptide synthesis using a CS136XT Peptide Synthesizer (CS Bio Co., Menlo Park, CA).
33
REFERENCES
1. Ulman, A., Formation and structure of self-assembled monolayers. Chem. Rev., 1996. 96: p. 1533-1554.
2. Love, J.C., et al., Self-assembled monolayers of thiolates on metals as a form of nanotechnology. Chem. Rev., 2005. 105: p. 1103-1169.
3. Badia, A., R.B. Lennox, and L. Reven, A dynamic view of self-assembled monolayers.
Acc. Chem. Res., 2000. 33: p. 475-481.
4. Chechik, V., R.M. Crooks, and C.J.M. Stirling, Reactions and reactivity in self-assembled monolayers. Adv. Mater., 2000. 12: p. 1161-1171.
5. Allara, D.L. and R.G. Nuzzo, Spontaneously organized molecular assemblies. 1. Formation, dynamics, and physical properties of n-alkanoic acids adsorbed from solution on an oxidized aluminum surface. Langmuir, 1985. 1: p. 45-52.
6. Porter, M.D., et al., Spontaneously organized molecular assemblies. 4. structural characterization of n-alkyl thiol monolayers on gold by optical ellipsometry, infrared spectroscopy, and electrochemistry. J. Am. Chem. Soc., 1987. 109: p. 3559-3568.
7. Tao, Y.T., Structural comparison of self-assembled monolayers of n-alkanoic acids on the surfaces of silver, copper, and aluminum. J. Am. Chem. Soc., 1993. 115: p. 4350-4358.
8. Choi, I.S. and Y.S. Chi, Surface reactions on demand: electrochemical control of SAM-based reactions. Angew. Chem. Int. Ed., 2006. 45: p. 4894-4897.
9. Dubois, L.H. and R.G. Nuzzo, Synthesis, structure, and properties of model organic surfaces. Annu. Rev. Phys. Chem., 1992. 43: p. 437-463.
11. Mrksich, M., A surface chemistry approach to studying cell adhesion. Chem. Soc. Rev., 2000. 29: p. 267-273.
12. Gras, S.L., et al., Intelligent control of surface hydrophobicity. ChemPhysChem, 2007. 8: p. 2036-2050.
13. Mrksich, M., What can surface chemistry do for cell biology? Curr. Opin. Chem. Biol., 2002. 6: p. 794-797.
14. Shin, S.K., et al., Nanoscale controlled self-assembled monolayers and quantum dots.
Curr. Opin. Chem. Biol., 2006. 10: p. 423-429.
15. Yousaf, M.N. and M. Mrksich, Dynamic substrates: modulating the behaviors of attached cells. In new technologies for life sciences: a trends guide, 2002: p. 28-35.
16. Prime, K.L. and G.M. Whitesides, Self-assembled organic monolayers: model systems for studying adsorption of proteins at surfaces. Science, 1991. 252(5009): p. 1164-1167.
17. Yeo, W.-S., M.N. Yousaf, and M. Mrksich, Dynamic interfaces between cells and surfaces: electroactive substrates that sequentially release and attach cells. J. Am. Chem. Soc., 2003. 125: p. 14994-14995.
18. Fan, C., K.W. Plaxco, and A.J. Heeger, Electrochemical interrogation of conformational changes as a reagentless method for the sequence-specific detection of DNA. Proc. Natl. Acad. Sci. U.S.A., 2003. 100: p. 9134-9137.
19. Houseman, B.T., E.S. Gawalt, and M. Mrksich, Maleimide-functionalized self-assembled monolayers for the preparation of peptide and carbohydrate biochips.
Langmuir, 2003. 19: p. 1522-1531.
20. Nuzzo, R.G., F.A. Fusco, and D.L. Allara, Spontaneously organized molecular assemblies. 3. Preparation and properties of solution adsorbed monolayers of organic disulfides on gold surfaces. J. Am. Chem. Soc., 1987. 109: p. 2358-2368.
35
22. Bain, C.D., et al., Formation of monolayer films by the spontaneous assembly of organic thiols from solution onto gold. J. Am. Chem. Soc., 1989. 111: p. 321-335.
23. Biebuyck, H.A., C.D. Bain, and G.M. Whitesides, Comparison of organic monolayers on polycrystalline gold spontaneously assembled from solutions containing dialkyl disulfides or aklanethiols. Langmuir, 1994. 10: p. 1825-1831.
24. Walczak, M.M., et al., Structure and interfacial properties of spontaneously adsorbed n-alkanethiolate monolayers on evaporated silver surfaces. J. Am. Chem. Soc., 1991. 113: p. 2370-2378.
25. Nuzzo, R.G., L.H. Dubois, and D.L. Allara, Fundamental studies of microscopic wetting on organic surfaces. 1. Formation and structural characterization of a self-consistent series of polyfunctional organic monolayers. J. Am. Chem. Soc., 1990. 112: p. 558-569.
26. Nuzzo, R.G., B.R. Zegarski, and L.H. Dubois, Fundamental studies of the chemisorption of organosulfur compounds on gold (111). Implications for molecular self-assembly on gold surfaces. J. Am. Chem. Soc., 1987. 109: p. 733-740.
27. Li, Y., et al., Characterization of thiol self-assembled films by laser desorption Fourier transform mass spectrometry. J. Am. Chem. Soc., 1992. 114: p. 2428-2432.
28. Widrig, C.A., C. Chung, and M.D. Porter, The electrochemical desorption of n-alkanethiol monolayers from polycrystalline Au and Ag electrodes. J. Electroanal. Chem., 1991. 310(335-359).
29. Bryant, M.A. and J.E. Pemberton, Surface Raman scattering of self-assembled monolayers formed from 1-alkanethiols: behavior of films at gold and comparison to films at silver. J. Am. Chem. Soc., 1991. 113: p. 8284-8293.
30. Bain, C.D. and G.M. Whitesides, Formation of two-component surfaces by the spontaneous assembly of monolayers on gold from solutions containing mixtures of organic thiols. J. Am. Chem. Soc., 1988. 110: p. 6560-6561.
32. Zhou, F. and W.T.S. Huck, Surface grafted polymer brushes as ideal building blocks for "smart" surfaces. Phys. Chem. Chem. Phys., 2006. 8: p. 3815-3823.
33. Alexander, C. and K.M. Shakesheff, Responsive polymers at the biology/materials science interface. Adv. Mater., 2006. 18: p. 3321-3328.
34. Lahann, J., et al., A reversibly switching surface. Science, 2003. 299: p. 371-374.
35. Liu, Y., et al., Controlled switchable surface. Chem. Eur. J., 2005. 11: p. 2622-2631.
36. Chan, E.W.L. and M. Yousaf, A photo-electroactive surface strategy for immobilizing ligands in patterns and gradients for studies of cell polarization. Mol. BioSyst., 2008. 4: p. 746-753.
37. Howarter, J.A. and J.P. Youngblood, Self-cleaning and anti-fog surfaces via stimuli-responsive polymer brushes. Adv. Mater., 2007. 19: p. 3838-3843.
38. Xiao, Y., et al., A reagentless signal-on architecture for electronic, aptamer-based sensors via target-induced strand displacement. J. Am. Chem. Soc., 2005. 127: p. 17990-17991.
39. Kwon, S.J., et al., An electrochemical immunosensor using ferrocenyl-tethered dendrimer. Analyst, 2006. 131: p. 402-406.
40. Yousaf, M.N., B.T. Houseman, and M. Mrksich, Turning on cell migration with electroactive substrates. Angew. Chem. Int. Ed., 2001. 40: p. 1093-1096.
41. Hayashi, G., et al., Photoregulation of a peptide-RNA interaction on a gold surface. J. Am. Chem. Soc., 2007. 129: p. 8678-8679.
42. Liu, Y., et al., Controlled protein assembly on a switchable surface. Chem. Commun., 2004: p. 1194-1195.
37
44. Yousaf, M.N. and M. Mrksich, Diels-Alder reaction for the selective immobilization of protein to electroactive self-assembled monolayers. J. Am. Chem. Soc., 1999. 121: p. 4286-4287.
45. Kwon, Y. and M. Mrksich, Dependence of the rate of an interfacial Diels-Alder reaction on the steric environment of the immobilized dienophile: an example of enthalpy-entropy compensation. J. Am. Chem. Soc., 2002. 124: p. 806-812.
46. Curreli, M., et al., Selective functionalization of In2O3 nanowire mat devices for biosensing applications. J. Am. Chem. Soc., 2005. 127: p. 6922-6923.
47. Brown, E.R., K.T. Finley, and R.L. Reeves, Steric effects of vicinal substituents on redox equilibriums in quinoid compounds. J. Org. Chem., 1971. 36: p. 2849-2853.
48. Chan, E.W.L. and M.N. Yousaf, Immobilization of ligands with precise control of density to electroactive surfaces. J. Am. Chem. Soc., 2006. 128: p. 15542-15546.
49. Chan, E.W.L. and M.N. Yousaf, Site-selective immobilization of ligands with control of density on electroactive microelectrode arrays. ChemPhysChem, 2007. 8: p. 1469-1472.
50. Chan, E.W.L. and M.N. Yousaf, Surface chemistry control to silence gene expression in Drosophila Schneider 2 cells through RNA interference. Angew. Chem. Int. Ed., 2007. 46: p. 3881-3884.
51. Prime, K.L. and G.M. Whitesides, Adsorption of proteins onto surfaces containing end-attached oligo(ethylene oxide): a model system using self-assembled monolayers.
J. Am. Chem. Soc., 1993. 115: p. 10714-10721.
52. Pale-Grosdemange, C., et al., Formation of self-assembled monolayers by chemisorption of derivatives of oligo(ethylene glycol) of structure HS(CH2)11(OCH2CH2)mOH on gold. J. Am. Chem. Soc., 1991. 113: p. 12-20.
53. Harder, P., et al., Molecular conformation in oligo(ethylene glycol)-terminated self-assembled monolayers on gold and silver surfaces determines their ability to resist protein adsorption. J. Phys. Chem. B, 1998. 102: p. 426-436.
55. Huttenlocher, A., R.R. Sandborg, and A.F. Horwitz, Adhesion in cell migration. Curr. Opin. Cell Biol., 1995. 7: p. 697-706.
56. Maheshwari, G., et al., Cell adhesion and motility depend on nanoscale RGD clustering. J. Cell Sci., 2000. 113(10): p. 1677-1686.
CHAPTER 2
Application of Model Substrate in Cell Biology
Introduction
Cell Adhesion, Extracellular Matrix, and Integrins
Cells do not live in static surroundings, they exist in highly evolving dynamic environments [1]. Cells adapt and communicate to their environment by numerous methods ranging from differentiation, gene expression, growth and apoptosis [2-8]. Numerous cellular responses that have essential roles in the regulation of cellular behavior and fate are triggered by cell interactions with the extracellular matrix (ECM) and with neighboring cells [9, 10]. As the ECM provides the physical microenvironment in which cells live, it provides a substrate for cell anchorage, serves as a tissue scaffold, and guides cell migration. The ECM is also responsible for transmitting environmental signals to cells, which influence essentially all aspects of a cell’s life, including its proliferation, differentiation and death.
Adhesions with the ECM are formed by essentially all types of adherent cell, but their morphology, size and subcellular distribution can be quite different. Nonetheless many of these adhesions are commonly mediated by integrins which are heterodimeric receptors composed of at least one β and one α subunit. From among the cellular repertoire of 18 α
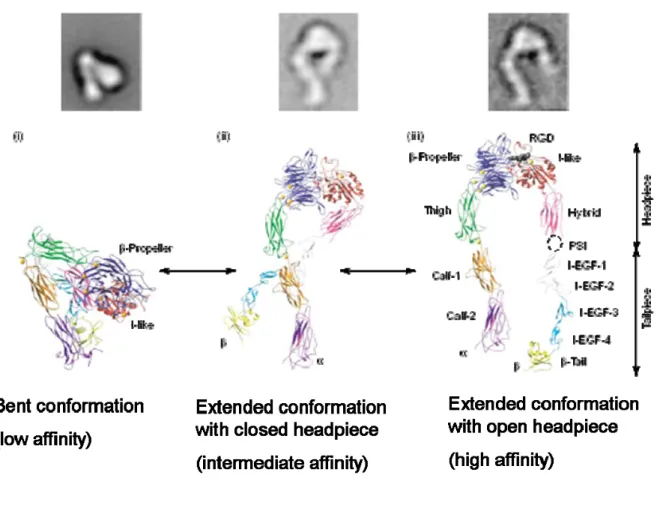
fibronectin, vitronectin and various collagens. Integrin-mediated adhesion activates signals that regulate a number of cellular processes including cell migration, proliferation, and differentiation [14]. Based on information provided by electron microscopy and X-ray crystallography, integrins are thought to possess affinity regulation mechanisms via structural change (Figure 2-1) [15, 16].
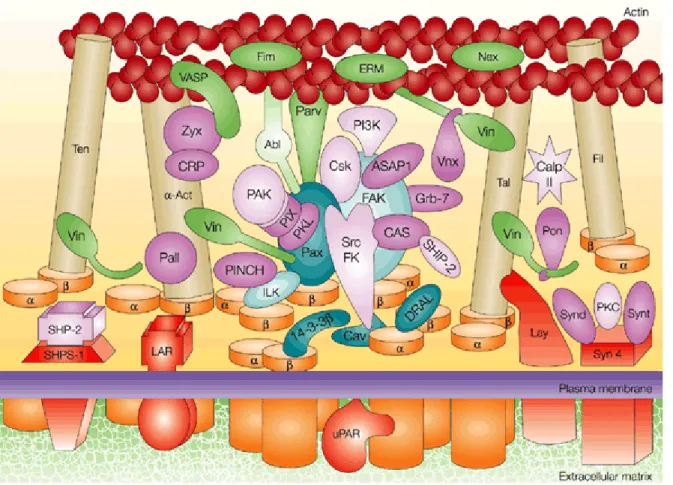
The adhesions can be characterized into subgroups such as focal adhesion (also termed focal contact), fibrillar adhesion, focal complex and podosome (Table 2-1) [4]. Focal adhesions are flat, elongated structures that are several square microns in area, and are often located near the periphery of cells [17]. They mediate strong adhesion to the substrate, and they anchor bundles of actin microfilaments through a plaque that consists of many different proteins which include vinculin, talin, paxilliln and tyrosine-phosphorylated proteins (Figure 2-2). Development of focal adhesions is stimulated by the small GTPase RhoA. In more central locations of many cell types are the fibrillar adhesions, which are elongated or dot-like structures that are associated with ECM fibrils [18]. Focal complexes are small dot-dot-like adhesions which are present mainly at the edges of the lamellipodium [19, 20]. These adhesions are often associated with cell migration or serve as precursors of focal adhesions. Their formation is induced by the Rho-family GTPase Rac. Podosomes are small (~0.5 µm diameter) cylindrical structures containing typical focal contact proteins that are found in various malignant cells and in some normal cells [21].
41
43
adhesions are α5β1 (the classical fibronectin receptor) and αvβ3 (vitronectin receptor) [4]. Unlike classical growth factor receptors, integrins bind ligands in a mechanosensory fashion that requires the assembly of a focal adhesion complex associated with the actin cytoskeleton. Assembly of a mature signaling complex requires integrin ligands to provide mechanical resistance, which opposes the contractile force of the associated actin cytoskeleton and promotes continued ligation events as new integrins are recruited into the growing focal complex. The actual mechanism by which integrins are internalized by the cell and returned to the front for making new attachments is mostly unknown, although it is widely assumed that some are taken up by clathrin-coated pits and returned to the cell surface
via the endocytic cycle [22, 23]. However, it is clear that different integrins on the surfaces of cells in suspension do circulate into and out of cells at quite different rates.
adhesions to fibrillar adhesions drives the formation of the fibronectin matrix [25]. This and many other examples show the importance of cell-surface interactions, particularly integrin-mediated adhesion, in organizing the ECM [26-29].
Cell Migration
Cell migration is essential to many biological processes such as embryogenesis, cell differentiation, wound healing, and immune response [6, 7, 30]. For example, during gastrulation, large groups of cells migrate collectively as sheets to form the resulting embryo. Subsequently cells migrate from various epithelial layers to target locations, where they then differentiate to form the specialized cells that form different tissues and organs. Migration of fibroblasts and vascular endothelial cells repair tissues from a wound. With the inflammatory response, leukocytes from the circulation migrate into the surrounding tissue to destroy invading microorganisms and infected cells and to clear debris. Cell migration also plays important roles in pathological events like tumor cell invasion, metastasis and tumor-induced angiogenesis [31]. In metastasis, tumor cells migrate from the initial tumor site into the circulatory system and onto a new site. The understanding of the fundamental mechanisms and key regulatory molecules underlying cell migration could lead to effective therapeutics for treating disease, cellular transplantation and the preparation of artificial tissues.
45
regulation of the dynamic processes of actin and microtubule polymerization, and the regulation of spatial and temporal signal transduction [4-7].
Cells migrate directionally in response to a variety of cues, including gradients of chemokines, growth factors or ECM molecules. Cell migration is an integrated process that requires the continuous, coordinated formation and disassembly of adhesions in spatially distinct locations in the cell [6, 7, 31-33] . In general, cell migration can be considered as a cyclic process. When there is a cue for migration, cells polarize and extend protrusions in the direction of migration. These protrusions can be large and broad lamellipodia or spike-like filopodia. Those are usually driven by actin polymerization and stabilized by adhering to the ECM or adjacent cells via transmembrane receptors linked to the actin cytoskeleton. These adhesions serve as traction sites for migration as the cell moves forward over them, and they are disassembled at the rear of the cell allowing it to detach. The details of a cell’s migratory behavior can differ greatly depending on its environment and cell type.
Rho family small guanosine triphosphate (GTP)-binding proteins (GTPases) are central regulators of actin organization and they control the formation of lamellipodia and filopodia. The proteins Rac, Cdc42 and RhoG are especially required for protrusion [19, 20, 24, 34, 35]. For migration, a cell must be polarized, which means that the molecular processes at the front and the back of a moving cell are different. Establishing and maintaining cell polarity in response to extracellular stimuli appear to be mediated by a set of interlinked positive feedback loops involving Rho family GTPases, phosphoinositide 3-kinases (PI3Ks), integrins, microtubules, and vesicular transport (Figure 2-3).
47
activate migration-related signaling molecules and also mediate inside-out signaling, that is, activation to a high-affinity state by cytoplasmic signals [4]. The binding of ligands to the extracellular portion of integrins leads to conformational changes in the receptors by changing interactions between the α- and β-chain cytoplasmic domains and to integrin clustering [36]. This combination of occupancy and clustering initiates intracellular signals such as protein tyrosine phosphorylation, activation of small GTPases, and changes in phospholipid biosynthesis that regulate the formation and strengthening of adhesion sites, the organization and dynamics of the cytoskeleton, and cell polarity during migration. Although integrins themselves do not have any catalytic activity, signals are transmitted through direct and indirect interactions with many partners of integrins.
integrins and the formation of adhesions. New adhesions at the leading edge in turn reinforce high Rac, Cdc42 and PI3K activity. The activity of Rho is low at the leading edge and higher at the rear and sides. Adhesions transmit propulsive forces and serve as traction points over which the cell moves. The migration cycle is completed as adhesions disassemble and the rear retracts. The disassembly of adhesions is controlled by pathways that include FAK, ERK, Src, and the protease calpain, as well as microtubule dynamics [40]. Retraction at the rear requires Rho kinase and is a myosin-dependent process.
Although our understanding of cell migration in the molecular basis has progressed there are still many unresolved issues regarding how cells establish and maintain their polarity, how cells migrate in vivo, how cells recognize their targets, and how the spatially distant component processes are integrated temporally and spatially across the cell [41]. To answer those questions, developing novel models that can present, quantify and perturb localized signals will be necessary.
Fibronectin Mimics - RGD and PHSRN
Fibronectin (FN) is a dimeric glycoprotein composed of disulfide-linked subunits with a molecular weight of 220–250 kDa each [42]. Being present at high concentrations (~300 µg/mL) in plasma, FN interacts with collagen, heparin, fibrin as well as integrin family and has been shown to be involved in cell adhesion, cell morphology, thrombosis, cell migration and embryonic differentiation [11, 43].
49
Numerous materials have been RGD-functionalized to promote cell adhesion [47-50] and soluble, small RGD-based peptides which block integrin signaling are studied for therapeutic purposes as inhibitors of tumor growth, angiogenesis and metastasis and as platelet-inhibitory drugs [51-54]. The RGD sequence is also commonly shared by many adhesive proteins in the ECM and in the blood including vitronectin, osteopontin, collagens, thrombospondin, fibrinogen, and the von Willebrand factor [45].
The RGD motif is located in the 10th type Ш repeating unit of FN (FNШ10) and many cell types binds to the specific central cell binding domain of FN spanning from the 8th to the 10th type Ш domain. However, other data indicate that an additional synergistic subregion, the FNШ9 domain, is required for full adhesive activity for the α5β1 and αП bβ3 mediated cell adhesion [55, 56]. The peptide sequence Pro-His-Ser-Arg-Asn (PHSRN) was identified as a minimum synergistic sequence enhancing cell adhesion and spreading. However PHSRN alone cannot support cell adhesion [57, 58]. RGD and PHSRN are separated by 30 - 40 Å and placed on the same surface of FN by a small rotation of a flexible linkage connecting the 9th and 10th type Ш domain [59].
domain of the FN central cell binding domain might be an important factor to determine such integrin specificities against FN on different surfaces [66]. Some recent studies have noticed the structural basis of FN domains and created model molecules with RGD and PHSRN sequences to clarify their roles in cell adhesion [67-71].
Design Rationale for Model Substrate
51
ligands in a well-defined environment and must be amenable to chemoselective reactions that immobilize ligands or transformations that reveal ligands to adherent cells during the course of cell migration or cell adhesion. This important feature requires an orthogonal chemical reaction to immobilize ligands to a surface in the presence of cells and complex protein mixtures with no side reactions. The immobilization reaction should be fast, kinetically well-behaved, and unreactive toward other biopolymers (DNA, RNA, proteins, lipids etc.) at physiological conditions; 2. the yield of immobilization reaction and therefore density of immobilized ligands on the surface must be precisely determined. This requires that the model substrates are compatible with sensitive and quantitative in situ surface analytical techniques; 3. the surface should have the ability to pattern different population of cells in defined geometries ranging from a single cell to hundreds of cells; 4. a non-invasive method that can activate the surface by immobilizing or unveiling ligands in the presence of attached cells is required; 5. the surface must be inert to non-specific protein adsorption, i.e. the only interaction between cell and material is a ligand-receptor mediated interaction; 6. the model substrate should be compatible with high throughput microarray technologies and several surface and microscopy techniques that are routinely used to characterize cell behavior, and ;7. The surface should possess the ability to perform massively parallel experiments simultaneously.
coupling between the hydroquinone and the quinone is stable and can be characterized by cyclic voltammetry [74, 75]. We have previously demonstrated that the resulting quinone monolayer can react rapidly and selectively with soluble oxyamine groups to form a chemically stable oxime conjugate on the surface [76]. By synthetically tethering ligands to the oxyamine, this methodology can potentially immobilize a variety of ligands such as peptides, carbohydrates, and other biomolecules to the surface. Furthermore, because the oxime conjugate undergoes redox coupling at different potentials from the quinone, the product possesses diagnostic waves that can be characterized electrochemically by cyclic voltammetry [76-78]. This feature permits the quantitative determination of yield and therefore density of ligand immobilized on the surface in situ. Most importantly, the highly selective coupling between the quinone and oxyamine prevents cross reaction with other biomolecules including DNA, proteins, carbohydrates, and lipids. This coupling strategy therefore is ideal for bioconjugation in the presence of complex protein mixtures and in the presence of adhered cells in serum-containing media.
Table 2-1. Characteristic features of different types of cell-matrix adhesions (adapted from reference 4)
Property/structure Focal complexes Focal adhesions Fibrillar adhesions
Location Edge of
lamellipodium
Cell periphery Central region of cells
Morphology Dot-like Elongated, oval Fibrillar or beaded
Size (long axis) 1 µm 2 – 5 µm Variable (1 – 10 µm)
Typical constituents Paxillin Vinculin Tyrosine-phosphorylated proteins
αv integrin Paxillin Vinculin
α-actinin Talin
Focal adhesion kinase
53
Results and Discussion
Ligand Immobilization for Cell Attachment
To determine whether the electroactive surface can support biospecific cell attachment
55
Dynamic Surfaces for Biospecific Cell Migration
57
Figure 2-6B shows representative fluorescent images for ligand-mediated migration of patterned cells over time on three different sizes of circular pattern (160 µm, 110 µm, and 60 µm in diameter). After 2-3 hours of linear RGD immobilization, cells begin to protrude and move beyond the edge of the pattern, and after 10 hours the cells have moved a significant distance away from the initial circular patterns. Despite the different sizes of the initial patterns, all the cells continued to migrate and after 30 hours of RGD immobilization it was difficult to define the original pattern. As a control, the exact same substrates without the RGD immobilizing reaction were prepared. There was no migration and the cells stayed confined within the circular patterns even after 48 hours in the incubator (Figure 2-6C). As a further control to show the migration was due to the biospecific interaction between integrin receptors on the cell and the newly immobilized RGD ligands, soluble RGD was added into the cell medium (final concentration of 0.7 mM for 1 hour) and the cells detached from the RGD presenting regions but not from the hydrophobic fibronectin islands (data not shown). When a scrambled peptide (GRD-oxyamine) was immobilized under the same conditions (this peptide is not a ligand for integrin receptors) the cells were observed over 48 hours not to migrate from the patterns (Figure 2-6D). Therefore the dynamic presentation of ligands on the surface in the presence of the cells functioned as a molecular switch to turn on cell migration.
59
tailored biospecific ligand-receptor mediated surfaces. Furthermore, because these substrates modulate the surface property in the presence of attached cell culture, it is possible to monitor cell behavior in response to various changes in the surface microenvironment in real-time.
The Role of Cell Population and Pattern Shape on Cell Migration and Growth
Using the dynamic substrates it was determined how the number of cells and initial pattern shape affect motility and growth. We used a nuclear labeling index (NLI) assay, which measures the amount of DNA synthesis occurring within adhered cells undergoing growth, to compare the role of pattern size and geometry on cell migration and cell growth. Dynamic substrates were prepared as described above and upon activation of the surface by immobilizing linear RGD, cells were allowed to migrate from the patterns for 20 hours and then 5-bromo-2’-deoxyuridine (BrdU, a thymidine analog that incorporates into newly synthesized DNA) was added in the cell culture medium (10 µM) for one hour to allow pulse-labeling of DNA. The cells were then fixed and the BrdU-labeled nuclei were detected
61
according to the migration distance. For the analysis, it was assumed that cells initiated migration from the boundary edge of the pattern and the cells found within the interior of the patterned area had no migration upon surface activation. In the bar graphs of Figure 2-7A-C, the first sets of data (distance 0 µm) represent the NLI of the cells within the initial pattern. These cells are considered as having no migration, and therefore their NLI is set as the basal level of new DNA synthesis in non-migratory, contact inhibited quiescent cells. The bar colors of the data set for each distance traversed corresponds to the regional zones of the same color in the pattern diagram above. Figure 2-7A and 2-7B compare the role of cell population in cell migration and growth by analyzing the NLI for small and large size of circular patterns that restrict the initial population of the cells. We also compare the effect of pattern geometry (circle versus straight line) on cell migration and growth (Figure 2-7C).
The comparison of NLI in relation to migration distance is a measurement to visualize the relative balance between migration and growth activity. We found that regardless of pattern size or shape the cells that migrated farther from the initial pattern had higher rate of new DNA synthesis (higher NLI). The cells that migrated the farthest were found to be the cells initially located at the edge of the pattern. Upon surface activation, these cells have greater access to free space that supports adhesion and migration and therefore are able to
63
activity (27.5 % and 31.2 %, respectively) (Figure 2-7A and 2-7B). After surface activation, the cells which migrated approximately 165 µm (off small) and 80 µm (off large) circular patterns at the time point of 20 hours had similar levels of NLI (see the *-noted bar graphs with NLI of approximately 65 %). These results show that for the same time period and growth rate (i.e. same NLI) cells from the small pattern (less cell population) migrated farther than cells from the larger population pattern. This result implies that there may be less cell-cell interactions in the smaller population patterns after surface activation and therefore the cells may migrate with less constraint where the dominating factor for migration is the number of cell-ligand interactions rather than the number of cell-cell interactions.
the pattern and upon surface activation the cells at the edge must move out perpendicular to their alignment. This may require a massive rearrangement of the cell cytoskeleton and therefore it takes much longer to initiate migration compared to the cells on small circular patterns that are not restricted by geometry. However, after moving beyond the line patterns the cells are able to migrate with limited cell-cell interactions compared to the circular patterns where several cells are joined during migration. Therefore the comparable migration distance with the similar level of NLI in Figure 2-7A and 7C (*-noted bar graphs) appears to be influenced more significantly by the initial geometry. Overall the NLI measurements show that the actively migrating cells generally have a higher growth rate and there is a delicate interplay of cell-cell interactions, cell-substrate interactions and initial geometry in dictating subsequent migration and proliferation.
The Role of Integrin Composition on Cell Migration
65
and B2a10 displayed similar adhesion, motility and actin organization to wild type CHO cells while the untransfected B2 cells showed no migration and no actin reorganization.
To test whether these mutant cells behave in a similar manner on our molecularly defined surface, the same experimental procedure as in Figure 2-7B was performed with the three CHO cell lines. We found that both B2a27 and B2a10 cells patterned on 160 µm diameter circles migrated and proliferated to a similar extent as the 3T3-Swiss albino fibroblasts did upon activation on 1 % linear RGD-immobilized surface (Figure 2-8). In contrast, although untransfected B2 cells adhered to the initial pattern, they did not migrate when the surface was activated with linear RGD ligands. Thus, the truncated α5 cytoplasmic domain is not essential for cell motility but the extracellular domain and the cytoplasmic domain adjacent to the membrane may have important functions in cell migration. This cell motility and growth data is consistent with the results obtained from the fibronectin-coated surfaces [87]. Taken together, these results demonstrate dynamic surfaces are well-suited for evaluating the dependence of cell growth and migration on integrin composition and expression levels.
On Non-Dynamic Surfaces Cell Migration Rate Depends on Ligand Affinity and Density
67
presenting hydroquinone (from 1 % to 10 %) and tetra(ethylene glycol) (99 % to 90 %) groups on gold.
Upon electrochemical oxidation to quinone, linear RGD or cyclic RGD was immobilized. The Figure 2-9 shows the scheme of this experiment and the structures of linear and cyclic RGD. The completion of the coupling reaction was determined by cyclic voltammetry. Each substrate was rinsed with water and 3T3-Swiss albino cells were then seeded to determine migration velocity as a function of peptide density. This type of substrates is termed as a “non-dynamic surface” since there is no patterned region of cells and the entire surface is composed of peptide ligands prior to cell seeding. Time-lapse images were recorded and the movement of the cells was tracked.
69
( > 5 %) the adhesiveness of the surface overcomes the ability for the integrin receptors to detach and therefore the migration is not effective.
Additionally, a mixture of linear and cyclic RGD peptides (1:1 ratio) was immobilized on the surface and cell movements were recorded. Interestingly, for the mixture RGD surface the migration rates were faster at lower density and exhibited an earlier biphasic behavior than for the linear RGD surfaces. From this study a mixture RGD surface allows the greatest cell motility at 1 - 2 % ligand density and at higher densities the effect of the cyclic RGD predominates and causes motility to significantly decrease.
71
73
Determining Cell Migration Memory on Dynamic Surfaces - The Dynamic Presentation of
Ligands Alters Cell Migration Rates
For metastatic cells the ability to migrate with different behavior and rates when originating from a tumor is of major interest in cancer biology. Although metastasis from a primary tumor is generally considered as a result of the complex interplay of random mutations, pre-existing genetic background and the local microenvironment, some types of tumors are metastasized by nonrandom processes [91, 92]. In this case, the microenvironment within and outside the primary tumors provide a selective path for metastasis. To explore the role of the dynamic microenvironment on cell motility, we wanted to test a novel hypothesis - whether the initial cell adhesion site and surroundings would influence subsequent migratory behavior of the cells or do cells have a migration memory that modulates their migration behavior after leaving the initial adhesion location. For this study, we employed the dynamic substrates to compare the rate of migration of cells from patterns onto regions presenting the same RGD ligand density and affinity as non-dynamic surfaces. If the initial location and environment affects cellular behavior, the dynamic and non-dynamic surfaces may induce different migratory behavior responses although the surface chemistry composition (ligand type and density) are identical. The cell migration on the dynamic surfaces was recorded by time-lapse microscopy in the same manner as Figure 2-10. In this set of experiment, the cells were first patterned on the fibronectin-adsorbed circular area and then linear or cyclic RGD was installed at 1 % and 2 % surface density. Upon exposure to the RGD ligand, the movement of the cells was recorded (Figure 2-12).