Abstract
Since the Citizens United Supreme Court decision changed campaign finance laws in the United States, scholars have sought to determine the impact of different types of campaign financing on the political system. This paper serves to add to this research by answering the questions: given the freedom of outside spending now allowed by Supreme Court decisions such as Citizens United, how does ideology affect the relative amount of outside spending congressional candidates receive from sources other than their party committees? In turn, how does this affect polarization in Congress? Through examining the relationship between ideological extremism and relative levels of non-traditional outside funding (i.e. excluding party committee spending) I found that, in certain cases, ideology may play a role in determining the amount of non-traditional outside spending candidates receive. My findings suggest that there is a negative relationship between the percentage of non-traditional outside funding and ideological extremism for incumbents in the House and that there is a positive relationship between non-traditional outside spending relative to traditional party spending only and
Introduction
Campaign finance laws in the United States have long been subject to strict scrutiny. In 1974, the Federal Election Campaign Act Amendments (FECA) were passed, creating limits on campaign contributions and imposing a formal system of transparency for donations.1 Over time, national party committees established non-federal financial accounts to raise money without limits, known as ‘soft money.’ In 2002, Congress passed the Bipartisan Campaign Reform Act (BRCA, a.k.a. the McCain-Feingold Act),
outlawing soft money and limiting corporate and labor union funding of electioneering communications. This marked a period of relatively stricter campaign financing
regulations, that stood until 2010.2 In 2010, the Supreme Court ruled on Citizens United v. FEC. Citizens United is a 501(c)(4) group (non-profit and tax-exempt group that operates under dark-money rules, meaning they do not have to report information about their donors) and was seeking to combat laws that prevented them from running a 2008 campaign ad attacking Hillary Clinton, as corporations were not allowed to advocate for or against specific candidates. The Supreme Court sided with Citizens United and set the precedent for groups to directly contribute to PACs with advocacy positions and to fund advertisements that are not just issue-centric.3 This decision has caused a lot of
controversy, as it treats corporations as people, allotting them the same first amendment rights. In April 2014, another Supreme Court case – McCutcheon v FEC – struck down
_______________________________________________________________________
1 “Campaign Finance Law,” The Campaign Finance Institute (CFI), www.cfinst.org/law.aspx. 2 Ibid.
3 Robert Mutch, Campaign Finance: What Everyone Needs to Know (New York: Oxford University Press,
contribution limits for single donors, further signaling a shift towards less restrictive campaign financing laws.4
Citizens on both sides of the ideological divide are wary about the influence of money on politics. Their worries have only been exacerbated following these several key court cases that have opened up politics to the influence of ‘big money.’ In particular, people are worried about the impact an increase in outside spending will have on the political process. ‘Outside spending’ is defined as “political expenditures made by groups or individuals independently of, and not coordinated with, candidates’ committees.”5 This includes both traditional groups, such as party committees, and non-traditional groups, such as PACs, super PACs, and 501(c)s. People have also raised concerns over the new laws allowing the wealthy to have a larger voice and influence on the vote, in a way allowing money to act as speech. In fact, 78% of Americans in 2015 said it the Citizens United case should be overturned.6
The Citizens United decision has given rise to a new type of campaign financing coined ‘dark money.’ Dark money is political spending by 501(c) organizations, “meant to influence the decision of a voter, where the donor is not disclosed and the source of the money is unknown.”7 Under the new precedent, corporations and wealthy individuals could have huge impacts on elections, and therefore politics, and the lack of transparency would keep citizens from ever knowing. This is worrying as, in the case of advertising, it
_______________________________________________________________________
4 CFI, “Campaign Finance Law.”
5 “Outside Spending,” Center for Responsive Politics (CRP),
https://www.opensecrets.org/outsidespending/index.php.
6 Greg Stohr, “Bloomberg Poll Americans Want Supreme Court to Turn Off Political Spending Spigot,”
Bloomberg, September 28, 2015,
makes it more difficult for voters to assess the validity of a message if they do not know who it is coming from.8
The Citizens United case clearly also has an impact on Congress, as it changes the campaign and electoral processes. For the purposes of my research, I will be examining non-traditional outside funding (i.e. excluding party committees) as I am interested in the impact of outside groups. My thesis will focus on the research question: given the
freedom of outside spending now allowed by Supreme Court decisions such as Citizens United, how does ideology affect the relative amount of outside spending congressional candidates receive from sources other than their party committees? In turn, how does this affect polarization in Congress? I will focus on the time period of 2002-2016. From 2002-2010 campaign finance laws were relatively stricter, given the ban on soft money by BCRA. Once BCRA was struck down in 2010, outside spending was allowed to play a much larger role in the political system. This time period will allow me to introduce the Citizens United decision as a shock and examine its impact over time.
Literature Review
There is no consensus among the political science community surrounding the relationship between campaign financing and ideology. Previous work exists on how campaign financing affects polarization, but little has specifically focused on changes since Citizens United. While there is no argument against the fact that Congress has
_______________________________________________________________________
8 While some corporations do choose to partially or fully report dark money donations, they legally do not
become increasingly polarized over recent years, few experts can agree on the underlying causes. Currently, there is not much literature on how ideology impacts outside funding.
One study sought to relate polarization to money redistribution within parties.9 The authors found that party leaders used to be ‘middlemen’ but have become
increasingly ideologically extreme. “Whereas the ideological distance between the floor leaders had been an average of .099 points larger than that of the average member of the respective rank and file from the 86th to the 103rd Congress, it was suddenly .345 points greater in the 104th, more than double the previous high and three and a half times the average.”10 They attribute this drastic change to the effectiveness of ideological
extremists at fundraising. As campaigns became increasingly more expensive, extremists excelled at fundraising and were able to take over the parties. The extremists then
redistribute the funds among their party’s candidates in order to win their fellow party members over. This is particularly effective in helping extremists rise to positions of power: in both parties, the redistribution by party extremists is more significant than that by party centrists when it comes to leadership decisions. This study enforces the idea that extreme candidates are more effective fundraisers and are therefore more attractive to outside donors, but it does not delve into questions of how this ability to fundraise can be used to subvert the party system entirely.
_______________________________________________________________________
9 Eric Heberlig, Marc Hetherington, and Bruce Larson, “The Price of Leadership: Campaign Money and
the Polarization of Congressional Parties,” The Journal of Politics 68, no. 4 (November 2006): 992-1005. http://doi.org/10.1111/j.1468-2508.2006.00485.x.
However, another study found that the source of funding does not have an impact on polarization.11 The authors eliminated private donations in the New Jersey Assembly and predicted what voting behavior would have been when private donations were still present. They then introduced public funds and found little difference between the expected behavior of politicians when they received private donations and the actual behavior they displayed when they received the public donations. However, it is important to note that this study examines the impact of different types of campaign financing on ideology/legislative behavior and not the impact of ideology on receiving the funds themselves.
A study by Powell, on the other hand, found that campaign contributions can sometimes have an impact on legislative policy.12 Powell argues that it is difficult to ascertain the exact impact of donors on the legislative process. While many experts have not been able to find a direct influence on roll call votes, she utilized a blended model approach to study the influence of donations earlier in the legislative process. Powell examined set institutional and political factors to see if they properly predict the amount of time a legislator spends fundraising and the amount of influence of a campaign contribution. She found that donations are most influential for highly paid legislators in ‘professionalized legislatures’ in states with large populations. Additionally, contributors have more influence when the legislator is more ambitious and plans on seeking a higher office. She also found that contributors have less influence when constituents are more
_______________________________________________________________________
11 Jeffrey Harden and Justin Kirkland, “Do Campaign Donots Influence Polarization? Evidence from Public
Financing in the American States,” Legislative Studies Quarterly 41, no. 1 (February 2016): 119-152. https://doi.org/10.1111/lsq.12108.
12 L.W. Powell, “The Influence of Campaign Contributions on Legislative Policy,” The Forum 11, no. 3
highly educated and are more likely to be aware of how legislators are spending their time and money. These results led Powell to conclude that the focus of campaign finance research should be on when and where contributions have influence, as they can
sometimes have a large impact and other times have little to no impact. This study shows that campaign contributions can sometimes play an important and influential role in politics, but again fails to further examine patterns in who is receiving this money in the first place and why.
The nature of discussions surrounding the impact of different types of campaign financing has changed significantly since the 2010 Citizens United decision. A study by Ian Vandewalker for the Brennan Center for Justice examined the changes in outside spending in Senate races since this decision.13 He found that outside spending in Senate elections more than doubled from 2010 to 2014 and in 80% of competitive races in 2014 outside spending was greater than candidate spending. The study also showed how this outside spending is being dominated by a small number of rich individuals: in every federal election following the Citizens United case, more than $1 billion has been spent via super PACs– of this $1 billion, approximately 60% was donated by only 195
families. Additionally, the study looked into the increase in dark money spending alone, which also more than doubled in Senate elections since 2010. The increases in outside funding and dark money were especially prevalent in toss-up races, with dark money making up 71% of outside funding for the 11 closest races in 2014. While this study highlights the massive changes that have taken place in the campaign financing world
_______________________________________________________________________
13 Ian Vandewalker, “Election Spending 2014: Outside Spending in Senate Races Since Citizens United,”
Brennan Center for Justice, 2015,
following Citizens United, as well as hints at how important receiving outside funding and dark money can be for a candidate to successfully win a close election, it does not closely examine the impact of such changes.
A study by Mann and Corrado did, however, seek to determine the significance of these changes in campaign finance laws.14 The study found that congressional party committees only spent $209.5 million in 2012 on elections, while non-party organizations spent over double the amount, $467.2 million, on independent expenditures. The authors argue that just because non-party organizations are outspending party organizations does not necessarily mean that the parties are weakened. They argue that often times non-party organizations’ goals align with those of the party and are simply another tool to further the election effort. Additionally, Mann and Corrado believe that donor preferences have had no impact on Democratic movement to the left that has occurred over time. They believe that this change resulted from a political change in the South and is driven by race and religion, not campaign finance. While Mann and Corrado propose a theory for the relationship, or lack thereof, between outside spending and polarization, they again do not test for any relationship between ideology and outside spending.
A study by Adam Bonica, on the other hand, did seek to relate campaign financing and candidate ideology by using campaign finance data to measure the ideology of candidates and contributors.15 The methodology of this study relies on the underlying assumption that contributors distribute funds based on how they perceive
_______________________________________________________________________
14 Thomas E. Mann and Anthony Corrado, “Party Polarization and Campaign Finance,” Center for Effective
Public Management, Brookings, July 2014,
www.brookings.edu/wp-content/uploads/2016/06/Mann-and-Corrad_Party-Polarization-and-Campaign-Finance.pdf. 15 Adam Bonica, “Mapping the Ideological Marketplace,” American Journal of Political Science 58, no. 2
candidates’ ideologies. The study presents the spatial model of giving, which claims that contributors prefer the most ideologically proximate candidate possible over those who are more ideologically distant. While Bonica’s model does not control for “nonspatial candidate characteristics” that could affect PAC donation decisions, like incumbency status and committee assignment, he argues that individual donors are really only
concerned with ideology.16 Bonica achieved external validity, as he found that his results correlate to the same liberal-conservative dimension as the respected roll-call measure of ideology, DW-NOMINATE. This study is relevant to my research, as it establishes a strong link between campaign finance and ideology, but it does not explore any relationship between extremism and relative levels of outside funding.
A study by La Raja and Schaffner did seek to directly relate campaign finance laws and polarization in state legislatures.17 They began by studying the campaign finance laws of all 50 states from 1990-2010 and for each election year, categorized the states based on limits these laws placed on campaign financing by parties. Importantly, they found that members of state congresses in states that did not limit party spending were significantly more moderate than those in states with laws restricting party spending and that “states with party-centered campaign finance laws tend to be less polarized than states that constrain how the parties can support candidates.”18 They argue that this is due to the tendency of political parties to fund more moderate candidates, as party
organizations’ top priority is winning elections, while outsiders tend to fund ‘riskier’
_______________________________________________________________________
16 Ibid., 369.
17 Raymond La Raja and Brian Schaffner, Campaign Finance and Political Polarization. (Michigan:
University of Michigan Press, 2016),
candidates who more align with their own ideological positions. When there are less restrictive laws surrounding the use of party funds for candidates, the parties are able to play a more dominant role in the fundraising aspect of elections and therefore promote more moderate candidates. On the other hand, when parties are restricted during the campaign process, candidates are forced to turn to outside sources for fundraising, which again relates to the theory that more extreme candidates are better at attracting outside funding. This study is incredibly relevant to my research question as it highlights the role that changing campaign finance laws can have on polarization in state legislatures, while I will focus on how this affects the national legislature.
Hypotheses
more extreme candidates will rely more on outside spending from outside groups than traditional party support.
I propose that the increase in non-traditional outside funding and dark money following the Citizens United v. FEC Supreme Court decision has increased polarization in Congress. In order to receive funding from wealthy individuals, candidates often have to take more extreme ideological stances. As shown in the study by Vandewalker, outside funding is incredibly important, especially in close elections. As stated in the study by Heberlig et al, ideological extremists are more successful at fundraising, so it is likely that they will attract more outside spending. This suggests that ideological extremists will, therefore, have a better chance at winning elections and as more extremists are successful, Congress will become more polarized.19 Additionally, the increase in non-traditional outside funding undermines the parties’ control over their members, making it more difficult for parties to force their members to cooperate or engage in compromise. Again, this results in members becoming more extreme and polarization in Congress increasing.
Data Sources
My dependent variable is relative non-traditional outside spending in elections and my independent variable is ideological extremism. For the data on outside spending,
_______________________________________________________________________
19 Since money is such an important factor in winning elections, if my hypotheses hold true and more
I utilized the Center for Responsive Politics data set, which includes a list of every candidate in each two-year election cycle and contains information about the candidates such as their party, whether they won or lost, whether they were an incumbent,
challenger, or running for an open seat.20 For each candidate, I have the amount of non-traditional outside spending on their behalf in their election, the amount of non-traditional spending by their party committee, and the amount raised through direct individual donations to their campaign. For the purposes of this project, I will only be examining the winning candidates, as there is no data available about the ideology of losing candidates.
My independent variable is candidate ideology. For this, I relied on the DW-NOMINATE data series by Poole and Rosenthal from Voteview, which ranks every member of Congress on an ideological scale from -1 to 1 (with -1 being the most liberal and 1 being the most conservative).21 The data contains a list of candidate names, ideology, chamber of Congress, and seat for every Congress.
It is also necessary to control for outside factors that could be impacting outside spending. Not much is known about what influences levels of outside spending, but the two major factors I controlled for are the ideology of the district for which the candidate is running and whether or not the seat is a ‘safe’ seat. In order to control for the ideology
of the candidate’s constituents, I utilized data from the American Ideology Project by Tausanovitch and Warshaw, which provides a measure of the average ideology of a Congressional district using the Item Response Theory based on responses to the
_______________________________________________________________________
20 “Bulk Data,” Center for Responsive Politics, https://www.opensecrets.org/bulk-data/downloads. 21 Jeffrey B. Lewis, Keith Poole, Howard Rosenthal, Adam Boche, Aaron Rudkin, and Luke Sonnet,
Annenberg National Election Study and the Cooperative Congressional Election Study.22 The ideology of the districts is ranked on a scale from -1 to 1, just like the measure used by the DW Nominate data to rank members of Congress.
In order to control for the presence of safe seats, I included a variable that
measures the percent of the vote each party received in the previous election for that seat. For House elections this is the last election, two years previously, and for Senate
elections this is the election six years previously. A safe seat is often defined as one where the party received over 55% of the vote in the previous election. In order to create a measure of this, I utilized data from the MIT Election Data and Science Lab. Their data sets contain constituency returns for elections to Congress from 1976-2016.23 This allowed me to calculate the percentage by which a candidate won each race.
My final data set included each winning candidate’s campaign finance history for a two-year election cycle broken down by type, the incumbent/challenger/open seat status, the candidate’s ideology, the ideology of their constituents, and the percentage of the vote their party received in that race during the previous election.
Research Design
I began by summing the amount of funding each candidate received from
different sources. I calculated the amount of non-traditional outside spending (excluding
_______________________________________________________________________
22 Chris Tausanovitch and Christopher Warshaw, “Measuring Constituent Policy Preferences in Congress,
State Legislatures, and Cities,” The Journal of Politics” 75, no. 2 (2013), 330-342. 23 MIT Election Data and Science Lab, "U.S. House 1976-2016", 2017.
party committees), traditional party committee spending, and direct individual donations received by each candidate. In order to control for the fact that some elections cost more than others, I created a variable that measures the percentage of funding candidates received from each source, relative to all three sources (non-traditional outside spending, party committee spending, and direct individual donations).
In order to test my first hypothesis, H1, I ran an OLS linear regression, with my dependent variable being the previously calculated ratio of non-traditional outside spending to traditional party spending and direct individual donations and my
independent variable being the absolute value of candidate ideology. My controls are the aforementioned measures of constituent ideology, in absolute terms, and vote percentage by the candidate’s party in the previous election. This allows me to determine whether or not there truly does seem to be a statistically significant relationship between ideological extremism and the changes in campaign finance laws over time and therefore polarization in Congress.
In order to test my second hypothesis, H2, I again ran a linear regression. In this case, my dependent variable is the percentage of funding from non-traditional outside spending relative to party committee spending and non-traditional outside spending combined. My independent variable is again the absolute value of the candidate’s
Results
To start, I examined the pure relationship between different types of spending and ideology both before and after 2010, when the Citizens United decision was reached and the new campaign finance regulations went into effect. For the purposes of this model, I only looked at the incumbent candidates.
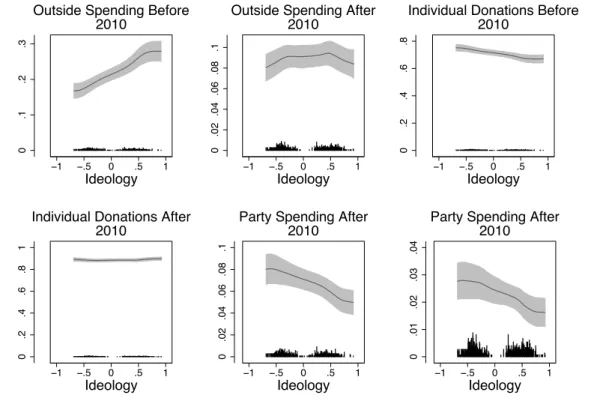
Figure 1. Relationships between spending and ideology
As seen in Figure 1, this preliminary analysis shows little to no change after 2010 in the relationship between party spending and ideology and the relationship between direct individual donations and ideology. However, there does appear to be a noticeable shift in the relationship between non-traditional outside spending and candidate ideology before and after 2010. From 2002-2008, there was a slight positive relationship between the non-traditional outside spending’s share of a candidate’s total funding and their ideology. This implies that more conservative candidates were receiving relatively more
0
.1
.2
.3
−1 −.5 0 .5 1
Ideology
Outside Spending Before 2010 0 .02 .04 .06 .08 .1
−1 −.5 0 .5 1
Ideology Outside Spending After
2010 0 .2 .4 .6 .8
−1 −.5 0 .5 1
Ideology
Individual Donations Before 2010 0 .2 .4 .6 .8 1
−1 −.5 0 .5 1
Ideology
Individual Donations After 2010 0 .02 .04 .06 .08 .1
−1 −.5 0 .5 1
Ideology Party Spending After
2010 0 .01 .02 .03 .04
−1 −.5 0 .5 1
Ideology Party Spending After
of their funding from non-traditional outside spending than more liberal candidates. However, after 2010, the relationship between the percentage of funding from non-traditional outside spending and candidate ideology resembled more of an upside-down ‘U’ shape. Small peaks are present around both .5 and -.5, which based on the histogram of ideology shown below appears to be the moderate or middle of both parties. This implies that more moderate candidates in each party are more likely to rely more on non-traditional outside spending. This is the opposite of what my hypothesis initially
predicted, but there are no controls present in this analysis as it simply strives to show the relationship between the two variables.
Next, I examined the proportion of funding candidates received from the three main categories: non-traditional outside spending, party spending, and direct individual donations. I broke this down into pre- and post-Citizens United election years and broke the candidates down into incumbents, challengers, and those running for open seats (see Figure 2). From this analysis, it is clear that the percentage of funding that comes from non-traditional outside spending changed fairly drastically for challengers and candidates running for open seats after 2010. The percentage of funding from party spending
decreased slightly across the board for all types of candidates, most significantly for those running for open seats. The percentage of funding from direct individual donations
Figure 2. Funding Percentages
Next, I ran regressions to test my initial hypothesis, that there is a positive relationship between the ideological extremism of the candidate and a higher percentage of funding coming from non-traditional outside spending. I included the percentage of the vote the candidate’s party received in the seat’s previous election (as a control for a safe seat) and the absolute value of the candidate’s district’s ideology. As shown in Figure 2, changes in non-traditional outside spending following Citizens United differ between incumbent and non-incumbent candidates. For this reason, I chose to run separate regressions for incumbents and non-incumbents in both the House and the Senate, in order to determine if the relationship between ideology and non-traditional outside funding differs for different types of candidates. The results of these regressions can be seen in Table 1.
.05
.1
.15
.2
Proportion
Challengers Incumbents Open−Seat Candidates
2002−2008 2010−2016
Outside Spending
0
.05
.1
.15
.2
.25
Proportion
Challengers Incumbents Open−Seat Candidates
2002−2008 2010−2016
Party Spending
.6
.7
.8
.9
Proportion
Challengers Incumbents Open−Seat Candidates
2002−2008 2010−2016
Table 1. Estimating Effects of Ideology on Non-Traditional Outside Spending Absolute Value of Ideology Election Returns by Candidate’s Party in Last
Election
Absolute Value of Candidate’s
District’s Ideology
N R2
House
2002-2008 (.0320) -.0120 (.0264) .0103 (.0251) -.0066 1,263 .3705
2010-2016 -.1069* (.0274) -.1052* (.0244) -.0663* (.0217) 1,578 .0589
Senate 2002-2008 .1985* (.0840) -.1805* (.0796) -.2092
(.1135) 123 .2485
2010-2016 .1130 (.1192) -.3096* (.1341) -.4577*
(.1760) 125 .4012
House Incumbents 2002-2008 -.0062 (.0351) .0012 (.0313) -.0064
(.0264) 1,095 .4187
2010-2016 -.1545* (.0271) -.0922* (.0257) (.0201) -.0331 1,305 .0760
Senate Incumbents
2002-2008 (.0665) -.0570 (.0870) .0139 (.0818) -.1661 86 .1883
2010-2016 -.0316 (.1374) -.0957 (.1607) -.3286
(.1678) 82 .4892
House Non-Incumbents 2002-2008 -.0233 (.0687) .0727 (.0500) .0008
(.0765) 168 .1182
2010-2016 .0192 (.0799) .0273 (.0713) -.2096
(.0866) 273 .0392
Senate Non-Incumbents 2002-2008 .2514 (.2209) .0027 (.1899) -.1537
(.3333) 37 .4139
2010-2016 .0647 (.1952) -.1331 (.2390) -.9786
(.3952) 43 .3864
Note: standard error in parenthesis
As can be seen in Table 1, ideological extremism appears to play a role in determining non-traditional outside funding percentages in the House, but not in the Senate. After breaking this down further, it appears as though ideology only plays a role for House incumbent candidates. According to this regression, for every unit increase in ideological extremism, there is a corresponding decrease of .1545 in the percentage of non-traditional outside funding for House incumbents. This directly contradicts my first hypothesis, as it suggests that more extreme candidates receive relatively less non-traditional outside funding relative to other methods of campaign financing. This model also has election returns playing an important role, as there is a .0922 decrease in the percentage of non-traditional outside spending for every unit increase in election returns, implying that less non-traditional outside spending is present in elections where the party won the seat by a relatively high percentage in the previous election. The district’s ideology, however, does not have a statistically significant effect in this model.
This makes sense with my theory, as it is expected that less attention would be given to seats that are seen as ‘safer.’ District ideology again has no discernable impact in this model.
Next, I examined the impact of ideology on non-traditional outside spending for Democrats, as can be seen in Table 3. Like the Republicans, there seems to be a
Table 2. Estimating Effects of Ideology on Non-Traditional Outside Spending for Republicans
Note: standard error in parenthesis
*the p-value for this coefficient is less than .05 and the t value if greater than 1.96, making it significant
Absolute Value of Ideology
Election Returns by Candidate’s Party in Last
Election
Absolute Value of Candidate’s
District’s
Ideology
N R2
House Republicans 2002-2008 -.0250 (.0324) -.0102 (.0338) -.0510
(.0448) 528 .3511
2010-2016 -.0867* (.0320) -.1503* (.0297) -.1197*
(.0343) 866 .0829
Senate Republicans 2002-2008 .0622 (.1345) -.4668* (.1862) -.1369
(.2466) 56 .4647
2010-2016 .0340 (.1441) -.3761* (.1604) -.5981*
(.2150) 69 .5031
House Incumbent Republicans 2002-2008 -.0773 (.0440) -.0606 (.0482) -.0435
(.0630) 330 .4319
2010-2016 -.1648* (.0319) -.1073* (.0303) -.0787
(.0310) 575 .1173
Senate Incumbent Republicans
2002-2008 (-.1525) -.1525 (.2904) -.0299 (.2469) -.3145 26 .3474
2010-2016 -.1198 (.1314) -.1101 (.2153) -.4367
(.1871) 36 .3323
House Non-Incumbent Republicans 2002-2008 .2098 (.1181) .0610 (.0746) -.0527
(.1450) 70 .1803
2010-2016 .0226 (.0945) -.1091 (.0851) -.1355
(.1190) 183 .0470
Senate Non-Incumbent Republicans 2002-2008 -.1759 (.4915) .1650 (.7331) -.0709
(.7466) 15 .6552
2010-2016 -.0365 (.3693) -.8180* (.3308) -1.5021*
Table 3. Estimating the Effect of Ideology on Non-Traditional Outside Spending for Democrats Absolute Value of Ideology Election Returns by Candidate’s
Party in Last Election
Absolute Value of Candidate’s
District’s Ideology
N R2
House Democrats
2002-2008 (.0578) .0514 (.0371) .0106 (.0356) -.0331 735 .3947
2010-2016 -.1842* (.0660) (.0451) -.0709 (.0328) -.0305 712 .0751
Senate Democrats 2002-2008 .1367 (.0932) -.0272 (.0623) -.1592
(.0835) 67 .1133
2010-2016 .1054 (.2479) -.0182 (.2387) -.6807*
(.3243) 56 .3699
House Incumbent Democrats 2002-2008 .0881 (.0642) .0157 (.0440) -.0385
(.0379) 637 .4322
2010-2016 -.1923* (.0631) (.0450) -.0824 (.0306) .0012 622 .1073
Senate Incumbent Democrats
2002-2008 (.0889) -.0387 (.0893) .0415 (.0705) -.0720 47 .1875
2010-2016 (.2881) -.1053 (.2414) -.0232 -.6579* (.2895) 40 .6013
House Non-Incumbent Democrats
2002-2008 (.0631) -.1312 (.0450) -.0824 (.0306) .0012 98 .1316
2010-2016 .1361 (.2683) .2387 (.1526) -.4141
(.1622) 90 .0934
Senate Non-Incumbent Democrats 2002-2008 .3438* (.1194) .1931* (.0759) -.3145
(.1596) 20 .7044
2010-2016 -.0212 (.5222) .1416 (.5238) .2266
(.8996) 16 .4541
Note: standard error in parenthesis
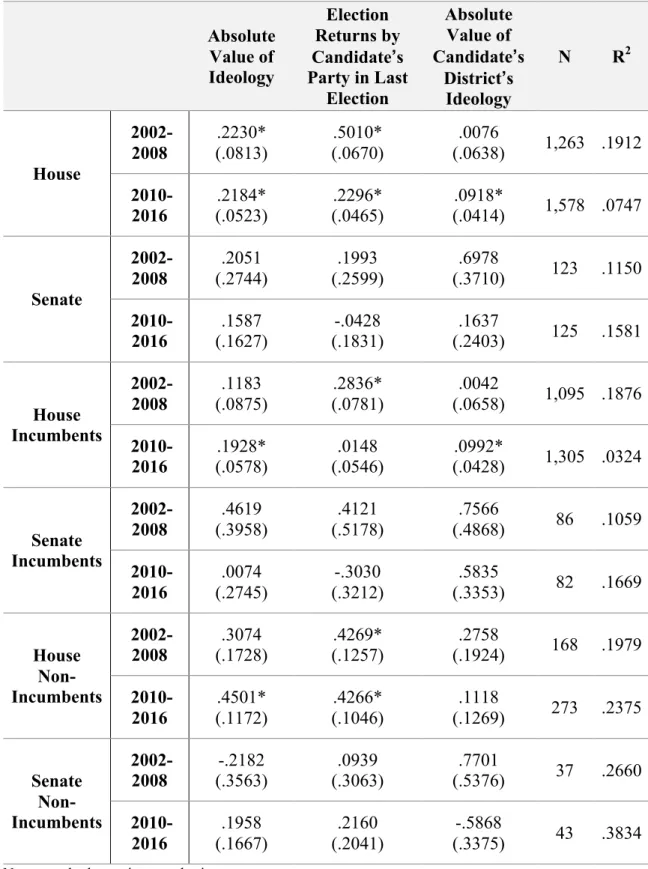
To test my second hypothesis, that following the Citizens United decision there is a significant positive correlation between ideological extremism and the amount of non-traditional outside spending for a candidate relative to non-traditional party spending only, I ran another set of OLS regressions. As can be seen in Table 4, there is a positive relationship in the House between ideological extremism and the percentage of non-traditional outside funding relative to party spending. For every unit increase in
Table 4. Estimating the Effects of Ideology on Non-Traditional Outside Spending Relative to Party Spending Absolute Value of Ideology Election Returns by Candidate’s Party in Last
Election
Absolute Value of Candidate’s
District’s Ideology
N R2
House 2002-2008 .2230* (.0813) .5010* (.0670) .0076
(.0638) 1,263 .1912
2010-2016 (.0523) .2184* (.0465) .2296* (.0414) .0918* 1,578 .0747
Senate 2002-2008 .2051 (.2744) .1993 (.2599) .6978
(.3710) 123 .1150
2010-2016 .1587 (.1627) -.0428 (.1831) .1637
(.2403) 125 .1581
House Incumbents 2002-2008 .1183 (.0875) .2836* (.0781) .0042
(.0658) 1,095 .1876
2010-2016 .1928* (.0578) .0148 (.0546) .0992*
(.0428) 1,305 .0324
Senate Incumbents 2002-2008 .4619 (.3958) .4121 (.5178) .7566
(.4868) 86 .1059
2010-2016 .0074 (.2745) -.3030 (.3212) .5835
(.3353) 82 .1669
House Non-Incumbents
2002-2008 (.1728) .3074 (.1257) .4269* (.1924) .2758 168 .1979
2010-2016 .4501* (.1172) .4266* (.1046) .1118
(.1269) 273 .2375
Senate Non-Incumbents 2002-2008 -.2182 (.3563) .0939 (.3063) .7701
(.5376) 37 .2660
2010-2016 .1958 (.1667) .2160 (.2041) -.5868
(.3375) 43 .3834
Note: standard error in parenthesis
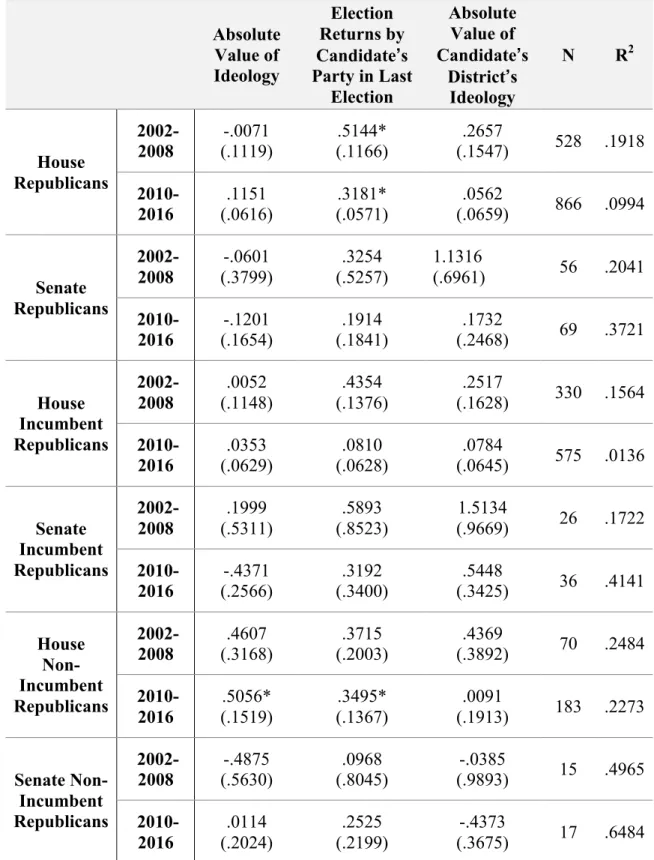
To further examine this relationship, I again broke it down by party. As shown in Table 5, ideological extremism only had a statistically significant impact on the amount
of traditional outside spending, relative to party spending, in the case of non-incumbent House Republicans post-Citizens United. According to this model, for every unit increase in ideological extremism, we would expect a .5056 increase in the
percentage of non-traditional outside funding relative to party funding. This is a fairly significant increase and implies that incumbents in the House rely more on non-traditional outside spending than party spending as a source of campaign financing. This supports my second hypothesis, as it shows a statistically significant and positive
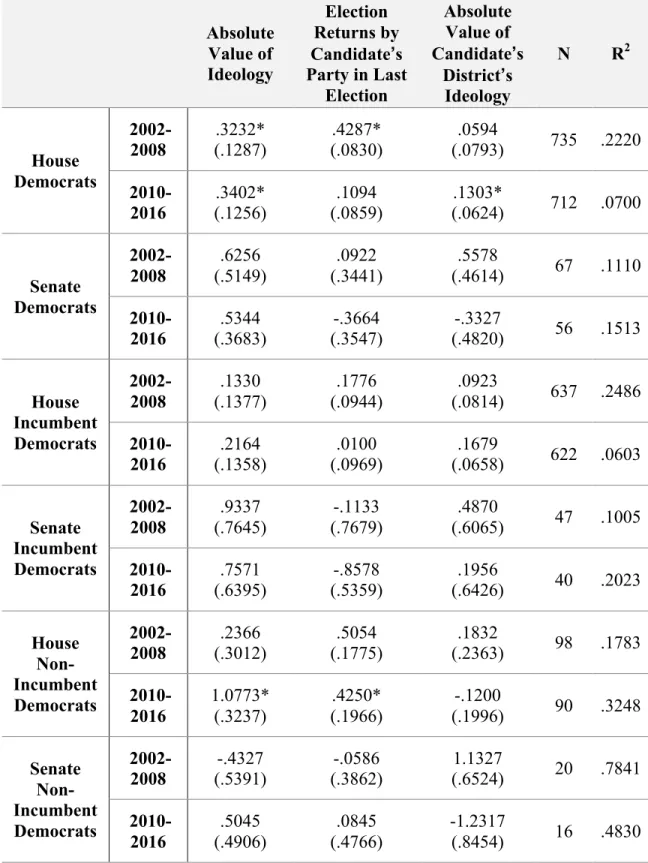
relationship between ideological extremism and non-traditional outside spending. Next, I looked at the relationship between non-traditional outside spending relative to party spending and ideological extremism for Democrats. As shown in Table 6, I again found that ideology has a statistically significant impact on non-traditional outside spending in the case of House non-incumbents. This model predicts that for every unit increase in ideological extremism there will be an increase of 1.0773 in the
Table 5. Estimating the Effect of Ideology on Non-Traditional Outside Spending Relative to Party Spending for Republicans Absolute Value of Ideology Election Returns by Candidate’s Party in Last
Election
Absolute Value of Candidate’s
District’s Ideology
N R2
House Republicans
2002-2008 (.1119) -.0071 (.1166) .5144* (.1547) .2657 528 .1918
2010-2016 (.0616) .1151 (.0571) .3181* (.0659) .0562 866 .0994
Senate Republicans
2002-2008 (.3799) -.0601 (.5257) .3254 1.1316 (.6961) 56 .2041
2010-2016 (.1654) -.1201 (.1841) .1914 (.2468) .1732 69 .3721
House Incumbent Republicans 2002-2008 .0052 (.1148) .4354 (.1376) .2517
(.1628) 330 .1564
2010-2016 .0353 (.0629) .0810 (.0628) .0784
(.0645) 575 .0136
Senate Incumbent Republicans 2002-2008 .1999 (.5311) .5893 (.8523) 1.5134
(.9669) 26 .1722
2010-2016 (.2566) -.4371 (.3400) .3192 (.3425) .5448 36 .4141
House Non-Incumbent Republicans
2002-2008 (.3168) .4607 (.2003) .3715 (.3892) .4369 70 .2484
2010-2016 (.1519) .5056* (.1367) .3495* (.1913) .0091 183 .2273
Senate Non-Incumbent Republicans
2002-2008 (.5630) -.4875 (.8045) .0968 (.9893) -.0385 15 .4965
2010-2016 .0114 (.2024) .2525 (.2199) -.4373
(.3675) 17 .6484
Note: standard error in parenthesis
Table 6. Estimating the Effect of Ideology on Non-Traditional Outside Spending Relative to Party Spending for Democrats Absolute Value of Ideology Election Returns by Candidate’s Party in Last
Election
Absolute Value of Candidate’s
District’s Ideology
N R2
House Democrats
2002-2008 (.1287) .3232* (.0830) .4287* (.0793) .0594 735 .2220
2010-2016 (.1256) .3402* (.0859) .1094 (.0624) .1303* 712 .0700
Senate Democrats
2002-2008 (.5149) .6256 (.3441) .0922 (.4614) .5578 67 .1110
2010-2016 (.3683) .5344 (.3547) -.3664 (.4820) -.3327 56 .1513
House Incumbent Democrats 2002-2008 .1330 (.1377) .1776 (.0944) .0923
(.0814) 637 .2486
2010-2016 .2164 (.1358) .0100 (.0969) .1679
(.0658) 622 .0603
Senate Incumbent Democrats 2002-2008 .9337 (.7645) -.1133 (.7679) .4870
(.6065) 47 .1005
2010-2016 (.6395) .7571 (.5359) -.8578 (.6426) .1956 40 .2023
House Non-Incumbent Democrats
2002-2008 (.3012) .2366 (.1775) .5054 (.2363) .1832 98 .1783
2010-2016 1.0773* (.3237) (.1966) .4250* (.1996) -.1200 90 .3248
Senate Non-Incumbent Democrats
2002-2008 (.5391) -.4327 (.3862) -.0586 (.6524) 1.1327 20 .7841
2010-2016 .5045 (.4906) .0845 (.4766) -1.2317
(.8454) 16 .4830
Note: standard error in parenthesis
Conclusion
From the results of my analysis, it is clear that the relationship between ideology and non-traditional outside spending is not one that can be easily pinned down. In terms of the overall percentage of campaign financing, there is a negative relationship between absolute ideology and relative non-traditional outside spending for House incumbents. For Republican incumbents in the House there is an expected decrease of .1648 for every unit increase in absolute ideology and for Democratic incumbents in the House there is an
expected decrease of .1923 for every unit increase in absolute ideology. This implies that
for both parties more extreme candidates get relatively less non-traditional outside
spending than other forms of campaign financing and that the effect is more extreme for
Democrats than for Republicans. This would mean that there is no relationship between
non-traditional outside spending and polarization in this case, as the funds are not being
spent on behalf of the more extreme candidates.
When examining just the relationship between ideological extremism and the
relative amount of non-traditional outside spending compared to traditional party
committee spending, a different effect appears. There is a significant positive relationship
between absolute ideology and relative non-traditional outside spending compared to
party spending for non-incumbent candidates in the House. For Republicans there is an
expected increase of .5056 for every unit increase in absolute ideology and for
Democratic non-incumbents in the House there is an expected increase of 1.0773 for
every unit increase in absolute ideology. This supports my initial hypothesis that more
extreme candidates get relatively more non-traditional outside spending than traditional
While this could result in outside spending having a small impact on polarization,
if more of it does indeed go to the more ideologically extreme candidates, there are far
fewer non-incumbent candidates and it is unlikely that the overall impact on polarization
in Congress is large. However, if this trend continues, it could affect non-incumbent
candidates’ chances of winning elections. Ideologically extreme non-incumbents may be
able to spread their messages farther and increase their audiences through the help of
outside spending groups, instead of having to rely on their party committees who may be
less likely to invest time and resources if they do not deem the non-incumbent candidate
worth the risk. Clearly, investigating this theory necessitates more data and, therefore,
requires more time to have passed since the Citizens United decision, but it is certainly
worth tracking in the future.
Interestingly, there appears to be no significant relationship between ideological
extremism and non-traditional outside spending in the Senate. However, this may be
because there are fewer Senators and their elections occur far less frequently, so there is
currently a limited amount of data available as the Citizens United decision is still
relatively recent.
As it stands, the relationship between ideology and non-traditional outside
spending deserves further analysis. My research found that there is a negative
relationship between the percentage of non-traditional outside funding and ideological
extremism for incumbents in the House and that there is a positive relationship between
non-traditional outside spending relative to traditional party spending and ideological
learn more about what other factors influence outside funding and as more time passes
Works Cited
Bonica, Adam, “Mapping the Ideological Marketplace,” American Journal of Political Science 58, no. 2 (2014): 367-386, http://doi.org10.1111/ajps.12062.
The Campaign Finance Institute (CFI). “Campaign Finance Law.” www.cfinst.org/law.aspx.
Center for Responsive Politics, “Bulk Data,” https://www.opensecrets.org/bulk-data/downloads
Center for Responsive Politics, “Outside Spending,”
https://www.opensecrets.org/outsidespending/index.php
Harden, Jeffrey, Kirkland, Justin. “Do Campaign Donors Influence Polarization? Evidence from Public Financing in the American States.” Legislative Studies Quarterly 41, no. 1 (Februrary 2016): 119-152. https://doi.org/10.1111/lsq.12108
Heberlig, Eric, Hetherington, Marc, and Larson, Bruce. “The Price of Leadership:
Campaign Money and the Polarization of Congressional Parties.” The Journal of Politics 68, no. 4 (November 2006): 992-1005. http://doi.org/10.1111/j.1468-2508.2006.00485.x
La Raja, Raymond and Schaffner Brian. Campaign Finance and Political Polarization. Michigan: University of Michigan Press, 2016,
https://www.press.umich.edu/4882255/campaign_finance_and_political_polarizat
ion.
Mann, Thomas E. and Anthony Corrado, “Party Polarization and Campaign Finance.” Center for Effective Public Management, Brookings, July 2014,
www.brookings.edu/wp-content/uploads/2016/06/Mann-and-Corrad_Party-Polarization-and-Campaign-Finance.pdf.
MIT Election Data and Science Lab, "U.S. House 1976-2016", 2017 https://doi.org/10.7910/DVN/IG0UN2
MIT Election Data and Science Lab, "U.S. Senate 1976-2016", 2017 https://doi.org/10.7910/DVN/PEJ5QU
Mutch, Robert E. Campaign Finance: What Everyone Needs to Know. New York: Oxford University Press, 2016.
Powell, L. W, “The Influence of Campaign Contributions on Legislative Policy,” The Forum 11, no. 3 (2013), 339-355, http://doi.org/10.1515/for-2013-0047
Stohr, Greg, “Bloomberg Poll: Americans Want Supreme Court to Turn Off Political Spending Spigot.” Bloomberg, September 28, 2015,
https://www.bloomberg.com/politics/articles/2015-09-28/bloomberg-poll-americans-want-supreme-court-to-turn-off-political-spending-spigot
Tausanovitch, Chris, and Warshaw, Christopher, “Measuring Constituent Policy
Preferences in Congress, State Legislatures, and Cities,” The Journal of Politics 75, no 2 (2013), 330-342.
Vandewalker, Ian. “Election Spending 2014: Outside Spending in Senate Races Since Citizens United,” Brennan Center for Justice, 2015,
http://www.brennancenter.org/sites/default/files/analysis/Outside%20Spending%2