THE ROLE OF MARINE SPONGES IN CARBON AND NITROGEN CYCLES OF CORAL REEF AND NEARSHORE ENVIRONMENTS
Daniel Ryan Hoer
A dissertation submitted to the faculty of the University of North Carolina at Chapel Hill in partial fulfillment of the requirements for the degree of Doctor of Philosophy in the Department
of Marine Sciences.
Chapel Hill 2015
Approved by:
iii ABSTRACT
Daniel Ryan Hoer: The Role of Marine Sponges in Carbon and Nitrogen Cycles of Coral Reef and Nearshore Environments
(Under the direction of Christopher S. Martens)
Sponges and their microbial consortia can alter the water quality of the surrounding environment through animal and hosted microbial chemical transformations resulting from their dynamic pumping, water filtration, and respiration processes. The goal of this dissertation was to quantify the role of these organisms in the cycles of carbon (C) and nitrogen (N) on reefs and representative environments of Florida Bay and describes five principle findings: 1) the abundant coral reef sponge Xestospongia muta satisfies the bulk of its respiration oxygen (O2) demand through uptake of dissolved organic carbon, and this species removed C in excess of O2 demand which is presumed to be reserved for cellular maintenance, growth, and the generation of
reproductive materials. 2) Respiration activities in this species yielded a tremendous flux of dissolved inorganic nitrogen (DIN), and the rate of this N release appeared to be broadly
iv
v
For Mom and Dad
vi
ACKNOWLEDGEMENTS
The contents of this dissertation are the product of a large, collaborative effort and could not have been completed successfully without the commitment of everyone involved. I would first like to thank my advisor, Chris Martens, who has granted me a huge amount of freedom pursuing the questions addressed herein as well as provided unflagging support and
vii
viii
I’d like to thank my friends and family for their unending love throughout the years. My family (both Hoer and Miano) provided the consistent encouragement and emotional support that I needed, and all have listened to me while I complain or babble about a variety of topics, many of which sound like nonsense, I’m sure. My friends, particularly Brock Phillips, Ben Vollmer, Oliver Rose, Brady Lawrence, and Reese Wells, were critical to the preservation of my mental and physical health by dragging me out on daily runs or rides, and I could always count on them for a laugh or a smile both on and off the trails. Finally, I’d like to thank my wife, Marissa, who has been an advisor, lab technician, editor, and my best friend since my first day working with Chris. She has provided love and support throughout the entirety of this process and has helped me find perspective when I was lost.
ix
TABLE OF CONTENTS
LIST OF TABLES ... xii
LIST OF FIGURES ... xiii
LIST OF SYMBOLS AND ABBREVIATIONS ... xvii
CHAPTER 1: Introduction: Sponge Impacts on Coastal Chemical Cycles ... 1
CHAPTER 2: Majority of Respiration Demand of a Common Caribbean Sponge Met by Dissolved Organic Carbon Consumption ... 8
Introduction ... 8
Methods ... 10
Results ... 17
Discussion ... 21
CHAPTER 3: Xestospongia muta as a Significant Source of Recycled Nitrogen to Floridian and Bahamian Reefs ... 36
Introduction ... 36
Methods ... 38
Results ... 43
x
CHAPTER 4: Efflux and Speciation of Dissolved Inorganic Nitrogen (DIN) from
Ecologically Relevant Sponge Species in Florida Bay ... 55
Introduction ... 55
Methods ... 58
Results ... 64
Discussion ... 67
CHAPTER 5: Sponges Represent a Major Source of Recycled Nitrogen in Florida Bay ... 84
Introduction ... 84
Methods ... 86
Results ... 96
Discussion ... 102
CHAPTER 6: Impacts of a Cyanobacterial Bloom on the Sponge Population and Chemical Structure of an Offshore Basin in Florida Bay ... 124
Introduction ... 124
Methods ... 128
Results ... 134
xi
CHAPTER 7: Summary of Findings, Conclusion, and Future Directions ... 174
xii
LIST OF TABLES
Table 2.1: Comparison of published directly measured in situ carbon uptake and
respiration activity for sponge species. ... 31
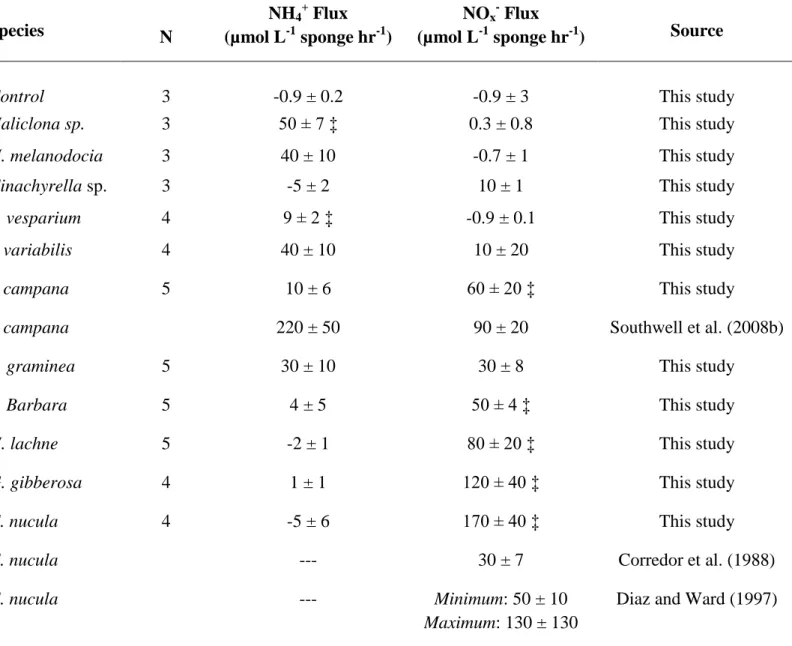
Table 4.1: Inorganic nitrogen production rates from the sampled species, including
previously published values ... 78
Table 5.1: Summarized DIN concentrationss from inside and outside Mystery Basin. ... 113
Table 5.2: Total sponge biomass for hardbottom and seagrass habitats in Mystery
Basin ... 114
Table 5.3: Nitrogen fluxes (mmol m-2 day-1) for Florida Bay.. ... 115
Table 5.4: The nitrogen budget for Mystery Basin calculated using the quantifications from Table 5.3. ... 116
Table 6.1: Summarized DIN concentrations from various sites inside and outside
Mystery Basin prior to, during, and following the bloom.. ... 154
Table 6.2: Pre and post-bloom weighted mean sponge biomass across both
xiii
LIST OF FIGURES
Chapter 2
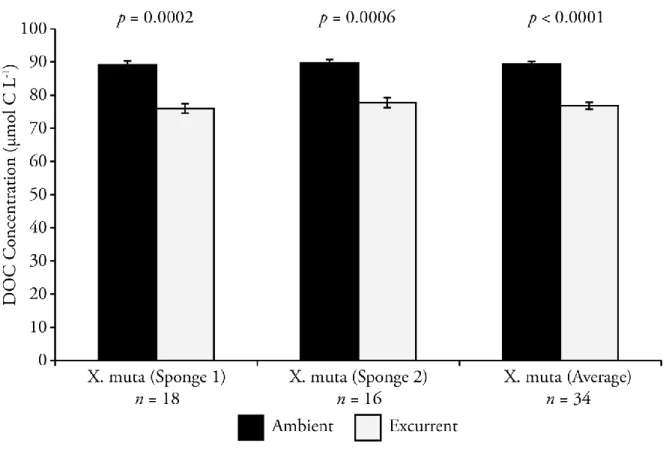
Figure 2.1: Average DOC concentration in the ambient and excurrent waters of two
Xestospongia muta (sponges 1 and 2) and the overall average. ... 32
Figure 2.2: Average O2 concentration in the ambient and excurrent waters of two
Xestospongia muta (sponges 1 and 2) and the overall average.. ... 33
Figure 2.3: Average uptake of O2 and DOC for the tested sponges and the overall
average.. ... 34
Figure 2.4: Average uptake fluxes of DOC, O2, and POC for the two tested sponges
and the overall average. ... 35
Chapter 3
Figure 3.1: Average NOx- concentration in the ambient and excurrent waters of
Xestospongia muta individuals tested in the Florida Keys and the Bahamas.. ... 52
Figure 3.2: Average NH4+ concentration in the ambient and excurrent waters of
Xestospongia muta individuals tested in the Florida Keys and the Bahamas. ... 53
Figure 3.3: Average fluxes of NOx- and NH4+ for the tested sponges from Florida and
the Bahamas.. ... 54
Chapter 4
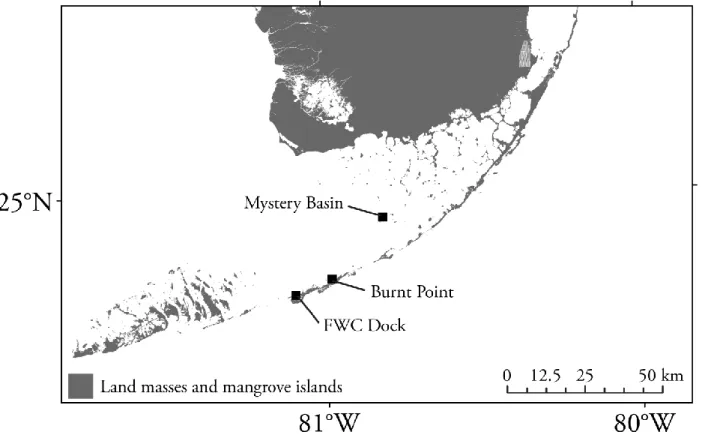
Figure 4.1: Map of Florida Bay.. ... 79
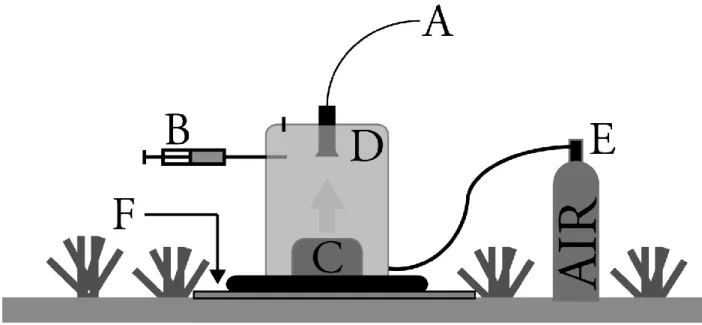
Figure 4.2: Schematic representation of the benthic chamber utilized for determining
sponge DIN production in situ. ... 80
Figure 4.3: NH4+ and NOx- concentrations during chamber incubations. ... 81
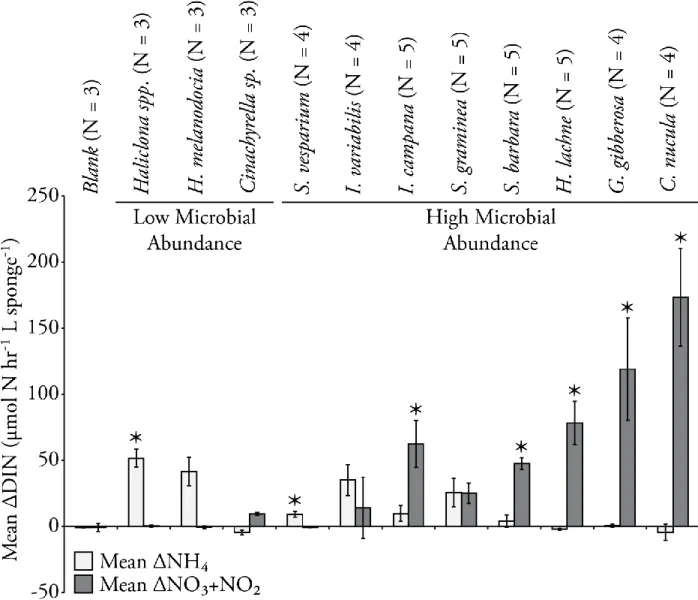
Figure 4.4: Mean volume-normalized rates of DIN production for the 11 tested
species in Florida Bay.. ... 82
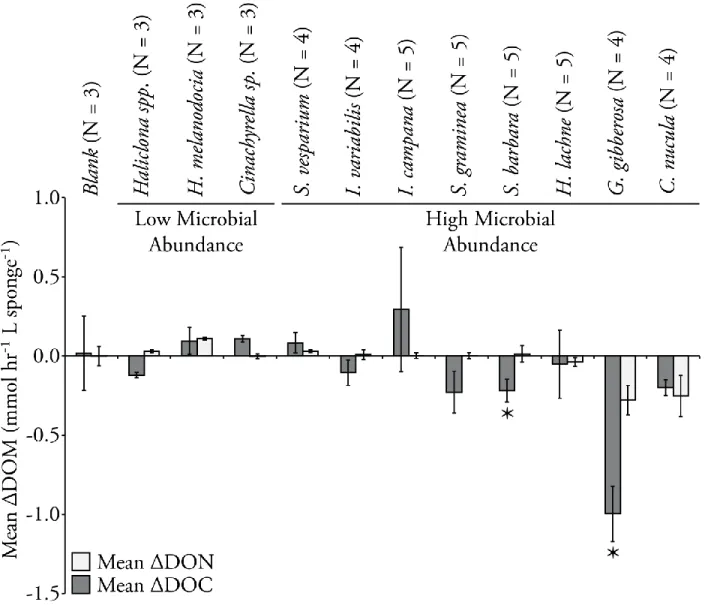
Figure 4.5: Mean volume-normalized rates of DOC and DON production or
xiv Chapter 5
Figure 5.1: ArcMap image of the study area showing the location of water quality
collection sites as well as the areal extent of seagrass and hardbottom habitat types. ... 117
Figure 5.2: Time-series data collected at CTR with discrete collections performed by peristaltic pump ... 118
Figure 5. 3: Water column samples transecting Mystery Basin along the approximate
trajectory of water transport into and out of the basin ... 119
Figure 5.4: Contour plot of surveyed sponge biomass in Mystery Basin with 8 site
IDs which were sampled during the water quality survey. ... 120
Figure 5.5: Average NH4+, NOx-, and total DIN contributions from the sponge
community in Mystery Basin. ... 121
Figure 5.6: Contour plots of NH4+, NOx-, and total DIN contributions from the sponge
community in Mystery Basin. ... 122
Figure 5.7: Contour plot of the calculated N flux model used to determine local
importance of N sources and sinks throughout Mystery Basin. ... 123
Chapter 6
Figure 6.1: ArcMap image of Mystery Basin ... 157
Figure 6.2: ArcMap of recurring water quality samples.. ... 158
Figure 6.3: Contour plot of September 26, 2013 chlorophyll a concentration at points inside and outside of Mystery Basin ... 159
Figure 6.4: Mean chlorophyll a concentrations at all sampled sites from
September 26, 2013 to March 4, 2015. ... 160
Figure 6.5: Mean DIN (NOx- + NH4+), NOx-, NH4+, and chlorophyll a concentrations
for HF1 from September 26, 2013 to March 4, 2015. ... 161
Figure 6.6: Mean DIN (NOx- + NH4+), NOx-, NH4+, and chlorophyll a concentrations
xv
Figure 6.7: Mean DIN (NOx- + NH4+), NOx-, NH4+, and chlorophyll a concentrations
for WP96 from September 26, 2013 to March 4, 2015 ... 163
Figure 6.8: Mean DIN (NOx- + NH4+), NOx-, NH4+, and chlorophyll a concentrations
for J01 from September 26, 2013 to March 4, 2015 ... 164
Figure 6.9: Methodological comparison for water quality parameters (mean surface
DIN (NOx- + NH4+), NOx-, and NH4+) at HF1. ... 165
Figure 6.10: Comparison DIN concentrations at HF1 during and following the bloom with those measured prior to its onset (May 2013 and August 2012) as well as the
median from Rabbit Key Basin (SERC Site ID: 18).. ... 166
Figure 6.11: Comparison NH4+ concentrations at HF1 during and following the bloom with those measured prior to its onset (May 2013 and August 2012) as well as the
median from Rabbit Key Basin (SERC Site ID: 18) ... 167
Figure 6.12: Comparison NOx-1 concentrations at HF1 during and following the bloom with those measured prior to its onset (May 2013 and August 2012) as well as
the median from Rabbit Key Basin (SERC Site ID: 18).. ... 168
Figure 6.13: Mean DOC, TN, DON, and chlorophyll a concentrations for HF1 from
September 26, 2013 to March 4, 2015. ... 169
Figure 6.14: Mean DOC, TN, DON, and chlorophyll a concentrations for HF13 from
September 26, 2013 to March 4, 2015. ... 170
Figure 6.15: Mean DOC, TN, DON, and chlorophyll a concentrations for WP96 from
September 26, 2013 to March 4, 2015 ... 171
Figure 6.16: Mean DOC, TN, DON, and chlorophyll a concentrations for J01 from
September 26, 2013 to March 4, 2015. ... 172
Figure 6.17: Average NH4+, NOx-, and total DIN contributions from the sponge
xvi Chapter 7
Figure 7.1: Sample of time-series data received from simultaneous measurement of ambient and excurrent NOx- (NO3- + NO2-) from C. nucula collected using prototype
xvii
LIST OF ABBREVIATIONS AND SYMBOLS
GF/F: Glass fiber filter; ~0.7 µm nominal pore size DIN: Dissolved inorganic nitrogen; NH4+, NO2-, and NO3-
TN: Total nitrogen; all nitrogenous material which passes through a glass fiber filter (~0.7 µm nominal pore size; inorganic and organic compounds)
DOC: Dissolved organic carbon; operationally defined as organic carbon which passes through glass fiber filter
DON: Dissolved organic nitrogen; all nitrogenous material which passes through a glass fiber filter minus inorganic nitrogen (DON = TN – DIN).
DOM: Dissolved organic matter, all material that passes through a glass fiber filter inclusive of both carbon and nitrogen
HMA: High microbial abundance (sensu Hentschel et al. 2006), referring to species of sponges hosting large tissue microbial communities
LMA: Low microbial abundance (sensu Hentschel et al. 2006), referring to species with tissue microbial densities similar to surrounding seawater.
Δ[Analyte]: Refers to the excurrent concentration minus the ambient concentration of the stated analyte
NOx-: Combined concentrations of NO3- and NO2-
POC: Particulate organic carbon; operationally defined as all material which is retained on a glass fiber filter
POM: Particulate organic matter; all material retained on a glass fiber filter inclusive of both carbon and nitrogen
1 CHAPTER 1:
Introduction: Sponge Impacts on Coastal Chemical Cycles
Sponges are ubiquitous features of all marine environments. They form large and growing populations that dominate the benthic biomass in coastal ecosystems of South Florida (Butler et al 1995, Peterson et al. 2006, McMurray et al 2010). Sponges have large water filtering capacity, up to 50,000 times their own tissue volume each day (Weisz et al. 2008), and they dramatically alter the water quality of the surrounding environment through animal and hosted microbial chemical transformations directly associated with their pumping, water filtration, and respiration processes. The large heterotrophic capacity of these organisms and their ability to feed on both particulate and dissolved organic matter (POM and DOM), make them powerful drivers of organic matter cycling in coastal systems (Yahel et al. 2003, Gibson 2011, de Goeij et al. 2013); sponge populations in cryptic habitats on reefs are capable of consuming carbon (C) equivalent to the total fixed locally by primary productivity (de Geoij et al. 2008a). As a result of these respiration processes, the effluent jet of filtered water exhaled from these organisms is often characterized by high levels of dissolved inorganic nitrogen (DIN), making them important sources of remineralized nitrogen (N) as well as physical and chemical drivers of coupling between those processes occurring near the benthos and those which occur in the overlying water column (e.g., Corredor et al. 1988, Lesser et al. 2006, Southwell et al. 2008). Understanding the effect of localized, low-level nutrient enrichment from sponge effluent plumes on the chemical budgets of the surrounding benthos is critical given that these areas are
2
my dissertation research was to quantify the importance of sponge-mediated C and N cycling processes in coral reef ecosystems and representative environments of Florida Bay where processes mediated by these organisms may be dominant drivers of nutrient cycling,
productivity, and changes in water quality. The role of these processes in the tested ecosystems may directly translate to other coastal environments where sponges are abundant.
My first objective was to explore the respired C source of a common Caribbean reef sponge (Xestospongia muta) by determining the proportion of the metabolic oxygen (O2) demand that is satisfied through respiration of dissolved and particulate organic matter. Based upon previous work with this species (Martens et al. unpublished data, Gibson 2011), I hypothesized that X. muta would satisfy the majority of its O2 demand from DOM consumption with only a minor contribution from POM uptake. Sponges efficiently feed across a wide range of particle sizes (Reiswig 1971); however, even early studies of sponge energetics (Reiswig 1971, 1973, 1981) revealed an apparent discrepancy between their uptake of POM and metabolic C demands as indicated by their rates of O2 utilzation. Sponges, particularly high microbial abundance (HMA) sponges, are thought to fill this metabolic C gap through utilization of dissolved organic carbon (DOC) (Yahel et al. 2003; de Goeij et al. 2013). Investigations of encrusting sponges commonly found in coral cavities showed that approximately 40% of the C uptake is accounted for by respiration; the remainder is hypothesized to be assimilated to account for rapid
3
native behavior of these organisms, and will serve to advance the understanding of their role in coral reef ecosystems.
The product of this organic matter respiration is a large efflux of recycled N in the exhalent stream of sponges that has been observed to generate an ecologically relevant source of recycled N in coastal environments (e.g., Corredor et al. 1988, Jiménez and Ribes 2007,
Southwell et al. 2008b, Fiore et al. 2013). How the processes mediated by these organisms are conserved across environmental gradients is only beginning to be understood. Consequently, I tested the degree to which the release of recycled N by the giant barrel sponge X. muta is
conserved between the environments found on the Florida Keys reef tract and those found on the oligotrophic reefs of San Salvador, Bahamas.
Many studies focus on sponge-rich reef environments that were characterized by open exchange with the ocean (e.g., Corredor et al. 1988, Jiménez and Ribes 2007, Southwell et al. 2008b, Fiore et al. 2013). Florida Bay represents a similarly sponge-rich environment as some of the tested reefs, yet it is characterized by a shallow water column where physical transport is restricted due to abundant mud shoals which subdivide the bay into discrete basins (e.g., Phlips et al. 1995, Boyer et al. 1997, Fourqurean and Robblee 1999). Due to the physical restriction, these basins exhibit highly variable water residence times, and experience an augmented
influence of local processes in chemical cycles (e.g., Fourqurean et al. 1993, Rudnick et al. 2005, Zhang and Fischer 2014). Sponge biomass survey results from Peterson and co-workers (2006) showed sponges at almost 75% of their surveyed sites, with biomass contributions of over 1400 g sponge dry weight m-2; areal coverage of sponge biomass was focused on the hard-bottom areas along the southern edge of the bay as well as the eastern and western margins. With this
4
in remineralizing organic matter and regenerating inorganic nutrients, yet species-specific biomass estimates will be required in order to determine the magnitude and potential ecological significance of this contribution. My objective was to determine if the sponge species found in the estuarine environment of Florida Bay exhibit similar behaviors to those species found on the reefs of the Florida Keys. Specifically, I aimed to determine if the species in FL Bay exhibited a dichotomy in exhalent DIN associated with the quantity of microbial biomass living in their tissues (e.g., Southwell et al. 2008b), if the exhalent DIN is a result of respiration of dissolved or particulate organic matter (DOM or POM), and if there is a divergence in respired organic matter associated with the presence or absence of microbial symbionts. I hypothesized that low
microbial abundance species (LMA) would exhibit an effluent plume dominated by NH4+ and HMA sponges would exhibit large concentrations of NOx- in their exhalent jets (Jiménez and Ribes 2007, Southwell et al. 2008b, Bayer et al. 2008). Furthermore, I hypothesized that DOM will dominate organic matter metabolism of HMA sponges and be of negligible importance in LMA species (de Goeij et al. 2008; Gibson 2011). In order to test these hypotheses, the speciation and magnitude of DIN flux was determined for 11 dominant species using benthic chamber experiments across three sites exhibiting the range of benthic environments found in Florida Bay.
5
Keller 2007, Boyer et al. 2009). For example, seagrass meadows have been shown to be particularly important sites of DIN generation through dissolved organic nitrogen (DON)
remineralization (Yarbro and Carlson 2008). While sponges exhibit a dominant presence in this environment (Peterson et al. 2006) and have a demonstrated ability to influence local DIN concentrations with their remineralization processes (e.g., Corredor et al. 1988, Southwell et al. 2008b, Hoer 2015, this volume), the role of these organisms in Florida Bay N budgets has been largely unaddressed. We chose to explore the role of sponges on the N cycle of Florida Bay in a sponge-rich basin in the west-central region of the bay (Mystery Basin) where DIN contributed from the sponge population may serve an ecological role in buffering N limitation from influent marine conditions from the Gulf of Mexico (Lavrentyev et al. 1998). In order to quantify the role of sponges in this environment, sponge biomass was quantified through benthic surveys and the measured, species-specific efflux from the dominant species was applied to the surveyed biomass. The resultant contribution was compared to other fluxes for Florida Bay, and we hypothesized that sponge efflux would be a dominant source of recycled N to the system and would be critical to meet the N demand from predominantly seagrasses. Additionally, we hypothesized that this N budget would vary spatially based on the local contributions of various processes, and a simple model was constructed to evaluate the dominant processes throughout the tested basin. However, the hypothesized dominance of sponge efflux on the N cycle in Florida Bay is subject to considerable temporal variability given the susceptibility of these organisms to rapid, mass mortality events (Butler et al. 1995, Peterson et al. 2006).
Florida Bay has experienced a series of large ecological disturbances which intensified in the late 1980s with a mass mortality event observed in the dominant seagrass, Thalassia
6
persistent phytoplankton blooms were observed throughout the Bay (Phlips and Badylak 1996, Phlips et al. 1999). These dense blooms are hypothesized to have precipitated rapid sponge die-offs (Butler et al. 1995, Wall et al. 2012); in two consecutive bloom events in central Florida Bay (1991-1992 and 1992-1993) locally dominant species (S. vesparium, Iricina sp., and Spongia sp.) experienced mortalities ranging from 40 to 100% (Butler et al. 1995). Despite temporal overlap, a direct, causal link between blooming Synechococcus and sponge mortality remains unclear (Butler et al. 1995, Lynch and Phlips 2000, Peterson et al. 2006). Yet, the ephemeral nature of intense blooms and their often sudden onset makes observation of such impacts difficult. In early September 2013, bloom conditions were found in Mystery Basin, a small, offshore basin located just north of the Arsnicker Keys that was the target site of a recently constructed N budget. The bloom was first noted by fishermen at locations in Rabbit Key Basin just to the north of Mystery Basin prior to our observations. Site descriptions by both our group and reports from fishermen to the Florida Fish and Wildlife Conservation Commission indicated that the bloom appeared to be expanding southward from a point of origin north or northeast of Rabbit Key. We had generated significant data characterizing this location prior to the onset of bloom conditions (extensive water quality sampling and surveyed sponge biomass) that enabled a unique examination of the ecosystem response of a sponge-rich basin throughout a
cyanobacterial bloom and following its dissipation.
The research presented in this dissertation comprises a significant contribution to the understanding of the role of sponges in the coastal cycles of C and N. Particularly, we
7
8 CHAPTER 2:
Majority of Respiration Demand of a Common Caribbean Sponge Met by Dissolved Organic Carbon Consumption
Introduction
9
and filter water. The relative abundance of HMA sponges represented 50% or more of the total sponge biomass below 15 m water depth in 13 of 15 benthic surveys of reefs throughout the Caribbean between 1978 and 2011; of the 8 studies during this period reporting trending in sponge populations, 6 showed an increasing trend in HMA cover below 15 m (Pawlik et al. 2015 and citations therein).
Sponges efficiently feed across a wide range of particle sizes (Reiswig 1971); however, early studies of sponge energetics (Reiswig 1971, 1973, 1981) revealed an apparent discrepancy between their uptake of particulate organic carbon (POC) and metabolic C demands as indicated by their rates of oxygen (O2) uptake. Sponges, particularly HMA sponges, are thought to fill this metabolic C gap through utilization of dissolved organic carbon (DOC) (Yahel et al. 2003; Gibson 2011). Investigations of encrusting sponges commonly found in coral cavities showed that ~40% of the C uptake is accounted for by respiration; the remainder is hypothesized to be assimilated to account for rapid chaonocyte cell turnover in the sponge animal (de Goeij et al. 2008a, 2008b, 2009). At the reef scale, this process is thought to represent a C uptake rate of a similar magnitude as the rate C fixation due to gross primary productivity (de Goeij et al. 2013). Non-encrusting species of sponge have also been shown to have the capacity to utilize DOC (Yahel et al. 2003, Gibson 2011, and Mueller et al. 2014), but compared to cryptic species, evidence of DOC uptake in satisfaction of their metabolic C requirements is limited. In this study we tested for direct DOC uptake and respiration by the HMA sponge Xestospongia muta (Demospongiae), commonly called the giant barrel sponge, to quantify the relative importance of DOC and POC to the metabolic C demand of a non-cryptic, non-excavating species on
10
in situ in undisturbed individuals attached to their original substrate in order to minimize any
physiological changes resulting from physical manipulation.
Methods
Study animal
X. muta is an important component of total benthic biomass on reefs throughout the
Caribbean (Büttner 1996, Armstrong et al. 2006), and especially on the Florida Keys reef tract where it can represent as much as 65% of total sponge biomass with population densities as high 0.2 sponges m-2 (Southwell et al. 2008, McMurray et al. 2008, 2010). X. muta is an HMA sponge, with tissue bacterial densities of up to 8 x 10⁹ microorganisms per gram of sponge wet weight (Hentschel et al. 2006). This species has been previously shown to absorb DOC (Gibson 2011), making it an ideal candidate for exploration of the role of DOC in sponge metabolism. In order to assess potential C allocation towards growth, growth rates for the tested X. muta
individuals was calculated using the Tanaka growth rate model from McMurray et al. (2008); X. muta has been shown to grow relatively quickly in the Conch Reef environment, with
particularly strong growth rates observed during the summer months (McMurray et al. 2008). Sample collection
Water samples were collected in August 2011 on Conch Reef (24° 57.62’ N, 80° 26.82’
11
instrumentation and water sample collection. Two large specimens were used due to limited in situ instrumentation as well as to maximize the temporal coverage of sampling for the tested
sponges. This species’ large size and barrel morphology featuring a single, large osculum facilitated in situ instrument deployment and the collection of water samples for chemical analyses. The selected individuals were 3 meters apart at a depth of ~18 meters. The
dimensions of the sampled sponges, henceforth referred to as sponges 1 and 2, were measured by divers on SCUBA in order to calculate sponge volumes without destroying the animal. The presented sponge volumes were calculated using the formula Vsponge = 28.514*osculum diameter2.1 (McMurray et al. 2010), which compared well with our volumes generated using geometric approximations of the sponge.
Sponge excurrent and ambient water samples were collected by divers on SCUBA working out of ARB from August 9 to 16, 2011. Ambient waters near the exterior walls of the sponge (<20 cm from the outer wall of the sponge) and excurrent waters exiting the sponge as a coherent jet were collected in triplicate at each sampling period. Ambient and excurrent samples were collected within 10 minutes of each other. These temporally-paired water samples allowed for quantification of chemical transformations mediated by the sponge and sponge associated microbial consortia (Yahel et al. 2005, Southwell et al. 2008). Samples were collected at three time points every day, 07:00, 12:00, and 17:00, to reflect any changes from morning to evening resultant from light-associated alterations in the sponge holobiont behavior as X. muta hosts dense populations of cyanobacteria in its ectoderm (Erwin and Thacker 2007). Each water sample was simultaneously collected and filtered (Whatman GF/F; 0.7 µm nominal pore size) in
12
tubing that allowed sample collection with minimal disturbance to the excurrent water jet and no disturbance of the sponge. A new pre-combusted, 25 mm Whatman GF/F filter was used for to filter each sample. Whatman GF/Fs were selected for filtration due to their suitability for pre-combustion and use in prior studies of DOC uptake by Caribbean sponges (e.g. Yahel et al. 2003, Gibson 2011). During sample collection, the syringe, filter, and sample collection tubing were rinsed 3x by pulling filtered target water into the syringe and then pushing the filtered water out of the stopcock arm not capped with the filter and tubing. The fourth and final water sample was drawn slowly into the syringe (< 2 mL sec-1) so as to ensure the collected samples were
representative of the desired water mass. Upon completion of sample collection, the stopcock was closed and the sample was stored in an ice bath in ARB until taken to the surface for transport to shore for subsampling and preservation (less than 8 hours from collection to preservation). At the shore-based lab, samples were immediately divided into triplicate borosilicate glass scintillation vials. Vials were first rinsed with the sample water, then were filled with 20mL of sample water, and 100 µL of 50% H3PO4 was added. After the acid addition,
the sample was stored at 4°C until analyzed.
In situ samples were also collected to examine particulate organic matter (POM) uptake
by one of the two tested barrel sponges. POM samples were collected from the same individual (sponge 2) daily during the mission using a passive in situ vacuum filtration apparatus (N. Lindquist personal communication 2007, Monismith et al. 2010). The system pulls water through a 0.7 µm GF/F (Whatman, 47 mm) using the pressure differential between the
13
sample of 13 L of filtered water. Filters were frozen after collection in combusted foil until analysis. Ambient and excurrent sample inlets were covered with a polypropylene mesh
pre-filter (pore-size: ~100 µm) to exclude particles larger than those thought to be efficiently retained
by sponges (Reiswig 1971, Pile et al. 1996, Yahel et al. 2003). Pre-filters were replaced daily. These POM samples were compared to 12 paired ambient and excurrent samples collected on Conch Reef using identical methodology as part of a wider survey of particulate carbon demand for X. muta. The samples were collected from several haphazardly selected healthy-looking X. muta individuals with sampling performed over several days in July, September, and October
2007.
All plastics utilized in sample collection and processing (including syringes, stopcocks, tubing, filter holders, and collection vial lids) were composed of polypropylene, high-density polyethylene, or polycarbonate and all were soaked in a 0.1M HCl bath for at least 12 hours and rinsed 6 times with 18.2 MΩ type I water prior to use and between each sampling. Borosilicate
scintillation vials used for sample collection were subjected to the same washing procedure, followed by combustion at 450°C for >6 hours to remove any residual DOC. Combusted glassware was stored in combusted foil and bagged to minimize outside contamination prior to use. Filters were combusted at 450°C for >6 hrs.
Sample Analysis
DOC samples were analyzed using high-temperature catalytic oxidation (HTCO) and non-dispersive infrared spectroscopy (NDIR) using a Shimadzu TOC-L CPH/CPN organic carbon analyzer. Analysis standards were diluted from a lab-prepared stock solution of potassium hydrogen phthalate (KHP) (Sigma-Aldrich 96148) and acidified with 100µL 50%
14
against commercially produced stock solutions (La-Mar-Ka Chemical Company) to ensure accuracy. Calibration curves were closely monitored during analysis and were remade and rerun if the correlation coefficient was found to be less than 0.995. Additionally, standards were interspersed with samples. Each sample or standard was transferred to duplicate, combusted analysis tubes to isolate instrument variability from collection variability. Further quality control was ensured by reserving a single sample from each triplicate set for separate analysis to confirm the obtained values from the other two samples; all samples from a triplicate set were analyzed, yet not contemporaneously, to isolate for any variability in instrument performance. Samples were bubbled with commercially-produced, CO2-free, Zero-Grade air at 80mL per minute for 10 minutes to ensure all inorganic C and volatile organic compounds were purged prior to sample injection; therefore, the values obtained are most accurately characterized of Non-Purgeable Organic Carbon (NPOC). We assume a negligible contribution to DOC from volatile organics, and henceforth the obtained values will be simply referred to as DOC. Each analysis tube was injected a minimum of 3 times, and a maximum of 5, depending upon whether the resultant peaks fell within user-provided statistical boundaries (Standard Deviation < 0.100 and
Coefficient of Variance < 2.0%). Therefore each reported concentration represents an average of N=18-30 individual measurements of DOC. The average difference between replicate
measurements was 2.3 µmol C L-1 (N=224 replicate pairs), which is interpreted as the
approximate analytical precision.
15
filters were then dried at 80°C for one hour and pulverized. Pulverized samples were placed into combusted foil boats and analyzed for C and N composition.
In situ Instrumentation
The water pumping speeds of the two selected X. muta were continuously measured between May 25 and August 17, 2011 using Nortek Vector acoustic Doppler velocimeters (ADVs). The ADVs were deployed on tripod stands built to minimize sensor movement during field deployments and were oriented such that their sampling volumes were within the center of the effluent jet halfway down the interior of the oscular cavity. The deployment locations were checked by divers using fluorescein dye injections to confirm placement in the center of the excurrent jet. The ADVs and Aanderaa Data Instruments (AADI) SeaGuard systems were cabled to the ARB Life Support Buoy (LSB) that supported the ARB with air, power, and communications. These data were transmitted wirelessly to onshore computers for logging and real-time monitoring. The ADVs collected data in 30 second bursts, every 5 minutes, for 85 days. ADV data collected during DOC sample collection from August 9 to 16 was averaged based upon hour-long sample blocks corresponding to the dates and time periods during which discrete samples were collected: 07:00-08:00, 11:30-12:30, and 17:00-18:00. Additionally, a nighttime sample block was generated (23:00 to 0:00) in order to assess any differences between daytime and nighttime behavior. Each sampled sponge had 26 sample blocks (19 daytime, 7 nighttime) in which data were averaged; each block of data represented 12 sampling events containing approximately 1000 individual measurements of vertical fluid speed. Prior to averaging, the measured vertical velocities from the ADVs were “despiked” to remove spurious
16
2002). These spikes are common to ADV measurements in natural environments, and the despiking process was performed using the Tukey 53H method as described in Goring and Nikora (2002). After removal, the data spikes were replaced by interpolating the data between the beginning and the end of the removed spike. The vertical fluid speed determined by ADV was used to calculate a volumetric flow associated with these individuals. This volumetric flow was calculated as a product of the planar area of the oscular opening and the measured vertically-directed fluid speed (V = pAoscVexc; where V is the volumetric flux, p is the proportion of the oscular area characterized by a discrete jet, Aosc is the oscular area, and Vexc is the measured excurrent velocity). Oscular openings for both sponges were approximately elliptical, but only a fraction of the measured planar area exhibits flow speeds as high as those measured via in situ velocimetry. The proportion of planar area characterizing the excurrent jet was determined by analyzing video-recorded fluorescein dye releases across multiple X. muta oscula as described in Weisz et al. 2008. The jet was characterized as the area where the dye front moved directly upward, and these dimensions were used to generate a percentage of the planar area of the osculum represented by the jet.
To measure O2 uptake by the sponges, a Aanderaa Data Instruments (AADI) SeaGuard system equipped with a ten sensor, digital optode string for continuous measurements of
dissolved oxygen (DO) was deployed simultaneously with the ADVs. Pairs of O2 optode sensors were positioned to simultaneously sample ambient and effluent waters of five X. muta
17
deployment. These data were treated identically to the ADV data in that they were subsampled in blocks based on the dates and times that discrete sample collection occurred. In the same manner as the ADV data, a nighttime block was analyzed to assess the role of phototrophic symbionts in the oxygen cycling of X. muta. The sample blocks for each sponge represented approximately 120 paired ambient and excurrent data points.
Results
Sponge volumes and growth rates
The oscula of the sponges were approximately elliptical, therefore sponge volumes were separately calculated using the major and minor axis length in place of the osculum diameter, and the resultant values were averaged. This leads to a calculated volume for sponge 1 of 150 ± 30 L and 48 ± 5 L for sponge 2, where the uncertainties represent the range between calculated values from the major and minor axes. The volumes obtained were in agreement with values calculated through geometric approximations of the shape of the sponge (126 L and 42 L for sponges 1 and 2, respectively).
The average, observed growth rate for X. muta on Conch Reef was approximately 2000 cm3 sponge-1 yr-1, determined from 104 individuals spanning a range of initial volumes
18
growth, Grate is the growth rate, dtissue is the tissue density, and Ctissue is the carbon content of sponge tissue).
Pumping Velocity
The two X. muta individuals showed significantly different average excurrent flow rates over the measured period (paired t-test). Sponge 1 produced an average excurrent flow rate of 5.3 ± 0.9 cm sec-1 (mean ± 1 SD, N = 19, P = 0.0001), and sponge 2 showed an average excurrent jet flow rate of 4.3 ± 0.9 cm sec-1 (mean ± 1 SD, N = 19, P = 0.0002). The nighttime excurrent flow rates did not differ significantly from the daytime values (4.9 ± 1.4 and 4.3 ± 0.9 cm sec-1, mean ± 1 SD, sponges 1 and 2, respectively). Video-recorded dye flow measurements
characterized the excurrent jet in this species as approximately 40% (SD = 9, N = 21) of the planar area of the sponge osculum, and this proportion was applied to the analyzed individuals to generate volumetric fluxes (V = 0.4AoscVexc). Additionally, the dye flow videos generated pumping velocities that corroborated the pumping velocities measured by ADV (N. Lindquist unpublished data). Sponge 1 had a planar area of 2787 cm2 (jet area = 1143 cm2) and this generated an average volumetric flow rate of 6 L sec-1, while sponge 2 had a planar area of 929 cm2 (jet area = 381 cm2) and an average volumetric flow rate of 2 L sec-1. For sponges 1 and 2, these flow rates are equivalent to filtering water more than 5,000x and 3,500x their body volume daily. The water pumping rates measured for X. muta agree well with previous assessments for this species (Weisz et al. 2008, Fiore et al. 2013) as well as for other HMA sponge species (Weisz et al. 2008, de Goeij et al. 2008 and citations within).
DOC Uptake by X. muta
The average DOC concentration in ambient water surrounding the test sponges was 89 ±
19
muta showed significant uptake of DOC from paired sample collections (one sample t-test versus
0) (Figure 2.1). Of the collected 38 ambient/excurrent pairs, 33 pairs showed DOC uptake
greater than the 2.3 µmol C L-1 estimated analytical precision, 3 pairs showed an increase of
DOC, and 2 pairs showed no significant difference. From this dataset, four paired samples were detected as outliers and removed from the dataset using the modified z-score method (Mi ≥ 3.5, Iglewicz and Hoaglin 1993). Sponge 1 showed a DOC uptake of 13 ± 5 µmol C L-1 from
ambient water (mean ± 1 SD, Wilcoxon Signed-Rank test, N = 18, P = 0.0002) while sponge 2,
exhibited a DOC uptake of 12 ± 6 µmol C L-1 (mean ± 1 SD, Wilcoxon Signed-Rank test, N =
16, P = 0.0006). This yielded an average DOC uptake for the two analyzed individuals of 13 ± 5
µmol C L-1 (mean ± 1 SD, Wilcoxon Signed-Rank test, N = 34, P < 0.0001). There were no
significant differences in DOC uptake between the two test sponges or between collection times (07:00, 12:00, and 17:00). The obtained uptake values were converted to fluxes using the volumetric pumping rates determined by the ADV measurements and normalized to calculated sponge volumes. This yields DOC uptake fluxes of 1.8 ± 0.9 mmol C hr-1 Lsponge-1 for sponge 1 and 1.5 ± 0.8 mmol C hr-1 Lsponge-1 for sponge 2 (mean ± 1 SD).
POC Uptake by X. muta
Ambient POC concentrations were found to be 2.1 ± 0.7 µmol C L-1 (mean ± 1 SD), a
substantially lower concentration than found for DOC. The measured POC content represents
only 2% of the total organic carbon (TOC; 91 ± 5 µmol C L-1; mean ± 1 SD) in ambient reef
water, where TOC is defined as the sum of POC and DOC (Yahel et al. 2003).
20
Signed-Rank test, N = 4, P = 0.05). As with the DOC, the POC values were converted to uptake fluxes using the volumetric flow rate and the calculated sponge volume yielding a POC uptake flux of 0.05 mmol C hr-1 Lsponge-1. Comparatively, the 12 sample pairs from 2007 showed a mean ambient POC content that was slightly higher than was observed at the tested individuals in 2011 (3.9 ± 1.3 µmol C L-1; mean ± 1 SD). The tested sponges also retained slightly more POC from
the filtered water (0.96 ± 0.28 µmol C L-1; mean ± 1 SD).
O2 Uptake by X. muta
The O2 concentration in the ambient water surrounding the sponges was 180 ± 10.5 µmol
O2 L-1 (mean ± 1 SD), with no significant difference between the two sampled sponges. Both individuals showed significant drops in O2 concentration from ambient to excurrent water masses (Figure 2.2). Sponge 1 showed an average O2 uptake of 10 ± 2 µmol O2 L-1 (mean ± 1 SD,
Wilcoxon signed-rank test, N = 17, P = 0.0003), and sponge 2 showed an average O2 uptake of
10 ± 3 µmol O2 L-1 (mean ± 1 SD, Wilcoxon signed-rank test, N = 17, P < 0.0003). These results
yielded an average O2 uptake for the two sponges of 10 ± 3 µmol O2 L-1 (mean ± 1 SD, Wilcoxon
signed-rank test, N = 34, P < 0.0001). There were no significant differences among any of the sampled times (07:00-08:00, 11:30-12:30, 17:00-18:00, and 23:00-0:00). Sponge 2 showed a single period where there was a significant reduction in pumping rate (0.9 cm sec-1, 75% reduced from the average, one-sample t-test vs. mean pumping rate, P < 0.0001) and the O2 uptake during this time was significantly greater than the average, (120 µmol O2 L-1, 10x average O2 uptake,
one-sample t-test vs. mean O2 uptake, P < 0.0001). This time point was detected and removed from the record for sponge 2 as an outlier for both DOC and DO uptake. Including this
21
POC uptake values, the O2 uptake values were also converted to fluxes using the volumetric flow rate and calculated volume. Sponge 1 showed uptake of 1.3 ± 0.5 mmol O2 hr-1 Lsponge-1 and sponge 2 showed uptake of 1.3 ± 0.5 mmol O2 hr-1 Lsponge-1 (mean ± 1 SD). Nighttime oxygen flux did not differ significantly from daytime values for either tested sponge (1.2 ± 0.4 and 1.2 ± 0.4 mmol O2 Lsponge-1 hr-1; mean ± 1 SD; two-sample t-test, P = 0.80 and 0.70; sponges 1 and 2, respectively).
Respiration balance for X. muta
The measured DOC uptake was greater than the measured O2 demand for both sampled sponges and for their average, but the observed difference was not significant for sponge 2 (Figures 2.3 and 2.4). Assuming a respiratory quotient of 1 (mole Crespired mole O2-1), the
accumulation of non-respired C was approximately 0.6 and 0.3 mmol C hr-1 Lsponge-1 for sponges 1 and 2, respectively. The average non-respired C retained by these sponges equates to
accumulating approximately 9500 g C sponge-1 yr-1 for sponge 1 and 1500 g C sponge-1 yr-1 for sponge 2.
Discussion
Our results showed that dissolved organic matter is the dominant organic C source for the giant barrel sponge X. muta (Table 2.1) and that metabolic O2 demand by X. muta can be
accounted for exclusively by DOC-fueled respiration (Figure 2.3). This lends further support to the growing body of direct measurements showing that C utilized by sponges and their
associated microbial consortia for respiration and growth comes predominantly from the
22
demand (Table 2.1). This would generate a discrepancy between absorbed C and respiratory O2 demand of similar magnitude to that observed by Reiswig (1981). This disparity strongly suggests that these sponges utilize DOC as their primary C source. While DOC represents a wide spectrum of elemental composition, structural diversity, and biological lability (Carlson 2002, Nebbioso and Piccolo 2013), the benthic boundary waters on Conch Reef likely contain concentrations of labile DOC produced by abundant soft corals and macroalgae (de Goeij et al. 2013, Mueller et al. 2014). Organic matter sourced from the local production on the reef benthos has been previously implicated through analysis of δ13C, δ15
N, and fatty acid biomarkers as the primary source of nutritive organic matter absorbed by Caribbean sponges (van Duyl et al. 2011). Moreover, the quantity of DOC removed by the test sponges is well within the portion of the measured ambient DOC pool which is assumed to represent the labile fraction on the reef (19 ± 7 µmol C L-1, 14 – 30% of reef DOC is considered “labile”; van Duyl and Gast 2001).
However, without rigorous structural characterization of the DOC pool, the suggestion that sponges are using exclusively the labile fraction of available DOC is purely conjectural. These direct measurements of predominant C uptake and utilization from the DOC rather than POC pool by multiple HMA species contradicts a great many previous studies indicating that POC is the dominant form of C utilized by sponges and that sponge growth can be limited by available levels of POC (reviewed by Pawlik et al. 2015).
Our measured DOC uptake rates agree well with published values for non-manipulated “InEx” ΔDOC sampling (Yahel et al. 2003, Gibson 2011, Mueller et al 2014, Table 2.1). Gibson
23
uptake in our 2007 survey of particulate uptake in this species further suggests relatively conserved metabolic behavior in this species at the reef scale. Ambient POC and ΔPOC were
higher in 2007 than 2011, yet the tested sponges in 2007 removed the same proportion of filtered POC (~20%) and even at elevated ambient POC concentrations particulate removal alone is insufficient to account for the observed metabolic O2 demand of the tested individuals. Our ΔDOC results agree with the in situ work of Mueller et al. (2014), which may indicate
physiological similarities between X. muta and excavating species; however without normalizing to sponge biomass, it is difficult to further compare the observed fluxes. Our volume-normalized DOC removal rates were significantly lower than those from de Goeij et al. (2008a) and lower than the 13C-labeled DOC respiration and assimilation rates of de Geoij et al. (2008b, 2013). Assessments of DOM uptake performed by de Goeij et al. (2008a, 2008b, 2013) employed chamber methodologies for which the sponges were removed from their original substrate and enclosed in chambers for monitoring. This experimental manipulation potentially has large impacts on sponge behavior as sponges have been previously shown to be sensitive to
non-24
encrusting species like X. muta could also be cause for the observed disparity, but the specific differences between these species are unknown.
Yahel et al. (2003) provided the only other instance in the literature of non-manipulated, simultaneous “InEx” ΔDOC and ΔO2 measurements on a marine sponge. The work of Yahel and co-workers revealed a slight difference between DOC uptake and O2 uptake for the Red Sea sponge Theonella swinhoei, and their measured C and O2 fluxes are similar to those presented here for X. muta. Yahel et al. (2003) attributed the observed difference between O2 and DOC uptake to O2 production by phototrophic symbionts of T. swinhoei. X. muta also showed a discrepancy between DOC and O2 uptake (Figure 2.3), and like T. swinhoei, possesses phototrophic organisms in its ectoderm (Erwin and Thacker 2007). In order to examine a potential role of phototrophic associates in the balance between DOC and O2 demand, nighttime oxygen fluxes were calculated and compared to daylight values. Surprisingly, observed
nighttime O2 uptake fluxes were not significantly different from daylight hours for either individual (nighttime O2 Flux: 1.2 ± 0.4 and 1.2 ± 0.4 mmol O2 Lsponge-1 hr-1; Daytime O2 Flux: 1.3 ± 0.5 and 1.3 ± 0.5 mmol O2 hr-1 Lsponge-1; mean ± 1 SD; two-sample t-test, P = 0.8 and 0.7 for sponges 1 and 2, respectively). Assuming C uptake was also equal overnight, we
hypothesized O2 uptake from sponge filtered water would increase in the absence of symbiont photosynthetic O2 production, yet this was not observed. The absence of this increased oxygen uptake overnight could indicate internal consumption of photosynthetic O2 during daylight hours, potentially through respiration of “new” photosynthetically-fixed C by the sponge holobiont or
25
photosynthesis in the respiration of absorbed DOC would suggest that C taken up in surplus of observed O2 demand is being utilized for organism growth and cell regeneration. Future
overnight collections of DOC and POC could further elucidate the diurnal role of photosynthesis in these organisms.
The measured DOC uptake was greater than the measured O2 demand for both sampled sponges and for their average, but the observed difference was not significant for sponge 2 (Figures 2.3 and 2.4). The observed O2 demand for these sponges falls within the range of previously reported respiration rates of undisturbed sponges in situ. Reiswig (1974, 1981) showed a range from 0.5 to 4.7 mmol O2 Lsponge-1 hr-1 for Tethya crypta and Verongia fistularis respectively, and Yahel et al. (2003) reported a rate of 1.38 ± 0.78 mmol O2 Lsponge-1 hr-1 for T. swinhoei. Additionally, these values agree with respiration demand for an encrusting sponge,
Halisarca caerulea, analyzed by incubations (de Goeij et al. 2008a). de Goeij and co-workers
(2008a) reported a large difference between observed O2 demand and observed DOC uptake in these incubations, indicative of only 39 - 45% of acquired organic C being respired. The remaining 55 - 61% was posited to be allocated to rapid turnover and expulsion of sponge biomass, confirmed later as rapid turnover and shedding of choanocytes (de Goeij et al. 2009). X. muta showed 76 ± 13% of total C acquired could be accounted for in respiration, assuming a
26
(Figure 2.4). This calculated C accumulation rate should be considered a conservative estimate as it does not account for the C fixed by photoautotrophic production via associated
microorganisms. Nevertheless, the observed C accumulation is much less than the quantity of C retained by H. caerulea for choanocyte turnover and shedding (13.8 mmol C Lsponge-1 hr-1, de Goeij et al. 2009) which may suggest a lower rate of cell turnover and shedding in X. muta, particularly if C allocation for organismal growth is considered. The growth of cryptic species was assumed to be zero (de Goeij et al. 2008a) whereas the same assumption cannot be made for X. muta which shows considerable annual growth (McMurray et al. 2008). Sponges in cryptic
habitats may be severely space limited and, by consequence, could be driven to allocate more energy towards functions other than growth, but X. muta individuals are not likely to experience the same degree of spatial pressure. Nevertheless, estimated C retained for growth only accounts for ~3% of the observed C accumulation; in the case of sponge 1, approximately 9500 g C sponge-1 yr-1 of non-respired C is retained with an estimated 270 g C sponge-1 yr-1 of the total being allocated to organismal growth. This reserves roughly 97% of non-respired C for other organismal functions such as the renewal of sponge pumping cells or the production of
reproductive materials that are exported from the sponge. For X. muta, reproduction involves the exudation of a mass of sticky mucus within which are embedded numerous small embryos that develop though early larval stages in mucus that spreads over substrates adjacent to the spawning sponge (Ritson-Williams et al. 2005, McMurray et al. 2008).
27
(McMurray et al. 2010). DOC removal from reef water due to X. muta would have been approximately 60 ± 40 mmol C m-2 day-1 in 2006, based on a range of biomass estimates by McMurray et al. (2010). This population flux suggests that DOC uptake by a single species of sponge could be equivalent or greater than the daily DOC released by benthic photosynthesis (20 to 50 mmol C m-2 day-1 as DOC); estimates of gross primary productivity for reef environments are approximately 200 – 500 mmol C m-2 day-1, with conservative evaluations suggesting 10% of C fixed by macroalgal photosynthesis is exuded as DOC (B. Hatcher 1990, Haas et al. 2011). If all non-encrusting HMA sponge biomass on Conch Reef absorbs DOC at the same rate as X. muta, the total community flux is approximately 130 mmol C m-2 day-1 (using mean HMA biomass data from Southwell et al. 2008). This rough estimate of C flux approaches total gross primary productivity for the reef, and shows that the non-encrusting HMA sponge community has the potential to remove DOC as efficiently as in coral cavity environments (de Goeij et al. 2013). The ecosystem implications of the observed sponge utilization of dissolved organic matter are still uncertain, yet X. muta has been shown to produce large quantities of dissolved inorganic nitrogen (DIN) as a result of organic matter remineralization (Corredor et al. 1988, Southwell et al. 2008, Fiore et al. 2013). Both Southwell et al. (2008) and Fiore et al. (2013) showed that these fluxes of DIN can contribute a significant amount of N to the community within the near-bottom waters of the benthic boundary layer. This bioavailable N contribution may result in enhanced photosynthetic production thereby increasing DOC production and enhancing the sponge’s primary C feedstock. Additionally, this uptake of DOC by sponge
28
the import of DOC to confirm participation of X. muta in the sponge loop. This disparity may be due to a lack of efficient export of detrital material in the excurrent jet, temporally limited POC collections, or to enhanced production of detritus by sponges in chamber environments rich with labile DOC (de Goeij et al. 2013) as compared to natural DOC composition on reefs (van Duyl and Gast 2001, Tanaka et al. 2011). We also did not observe the production of detritus by X. muta in the more extensive POC collection campaign conducted in 2007, which argues against
temporally-limited sampling as the cause for the lack of detrital export. Additionally, Mueller et al. (2014) did not show quantitative detrital production in C. delitrix or Siphonodictyon sp. and could not definitively confirm their participation in this aspect of the sponge loop. However, detrital production in X. muta could also be limited by allocation of retained C towards organism growth, although this impact was calculated and determined to be minimal, or to the production of reproductive materials. X. muta has been shown to spawn twice annually, in spring and late summer (McMurrray et al. 2008), which may have contributed to the rates of C retention observed in the tested individuals.
29
Gloeckner et al. 2014). It is important to note that LMA sponges are not without bacterial biomass in their tissues, but rather they have bacterial populations approaching seawater
concentrations, which may still serve a functional role in the processing of DOC (Hentschel et al. 2006). The combination of animal and microbial processes in X. muta and other HMA sponges may provide a competitive advantage in oligotrophic systems by supplying metabolic access to a wider range of C sources than would be assessable without associated microorganisms (van Duyl et al. 2008, de Goeij et al. 2008b and citations therein).
DOC represented more than 90% of the TOC removed from filtered water by the tested X. muta individuals, and therefore likely constitutes the dominant C source for this species. In
the tested individuals, 76 ± 13% of the TOC absorbed is accounted for by observed O2 demand, suggesting substantial assimilation, but to a much lesser degree than in the previous studies of cryptic species from coral cavities (e.g. de Goeij et al. 2008b). This less pronounced role of C assimilation during the utilization of DOC by X. muta could lead to a reduction in the detrital flux from cell shedding, potentially decoupling part of the “sponge loop” hypothesized by de
30
31
Table 2.1: Comparison of published directly measured in situ carbon uptake and respiration activity for sponge species (mean ± SD).
Results of studies conducted in chambers are not included due to possible manipulation artifacts. Listed flux measurements were normalized to L of sponge biomass.
Species ΔDOC (µmol C L-1)
DOC Flux
(mmol C L-1 sponge hr-1)
ΔPOC (µmol C L-1
)
POC Flux
(mmol C L-1 sponge hr-1)
ΔO2 (µmol C L-1) O2 Flux
(mmol O2 L-1 sponge hr-1)
Source
Xestospongia muta 12.6 ± 5.0 1.63 ± 0.83
0.4 ± 0.1 0.05 ± 0.01
9.9 ± 2.5 1.28 ± 0.51
This study
Xestospongia muta 0.96 ± 0.28 This study
(2007 samples)
Teonella swinhoei 10 ± 8 1.56 ± 1.1
2.1 ± 1.0 * 0.24 ± 0.18 *
9 ± 5 1.38 ± 0.78
Yahel et al (2003)
Siphonodictyon sp. 13 ± 17 3 ± 1 Mueller et al
(2014)
Cliona delitrix 10 ± 12 3 ± 1 Mueller et al
(2014)
32
Figure 2.1: Average DOC concentration in the ambient and excurrent waters of two
Xestospongia muta (sponges 1 and 2) and the overall average. Error bars are 1 SE and N equals
33
Figure 2.2: Average O2 concentration in the ambient and excurrent waters of two Xestospongia muta (sponges 1 and 2) and the overall average. Error bars are 1 SE and N equals the number of
averaged sample periods. P values (Wilcoxon signed-rank test) indicate the level of significance of the difference between the observed difference between ambient and excurrent O2
34
Figure 2.3: Average uptake of O2 and DOC for the two tested sponges and the overall average. The difference between ΔDOC and ΔO2 was analyzed to assess stoichiometric balance between
35
36 CHAPTER 3:
Xestospongia muta as a Significant Source of Recycled Nitrogen to Floridian and Bahamian Reefs
Introduction
Declining coral cover throughout the Caribbean between 1977 and the present (Gardner et al. 2003, Green et al. 2008, and Perry et al. 2013) has been accompanied by a corresponding increase in sponges and macroalgae, and these organisms now dominate many reef environments (Aronson et al. 2002, McMurray et al. 2010). Sponges actively pump water through their tissues as a means to gather resources from the surrounding environment and expel waste products. As such, these organisms exhibit large filtration rates (Corredor et al. 1988, Weisz et al. 2008), and their pumping activities generate physical connectivity coupling processes occurring near the reef hardbottom and those in the overlying water column (e.g., Lesser 2006, Southwell et al. 2008b, Keesing et al. 2013). These organisms feed across a wide particle size range (Reiswig 1971) and have been implicated in the respiration of dissolved organic matter (DOM; Yahel et al. 2003, de Goeij et al. 2008, Hoer 2015, this volume). As a result of these respiration processes, the exhalent water of marine sponges is often enriched in dissolved inorganic nitrogen (DIN) making sponges potentially potent local drivers of nutrient recycling.
The efflux of remineralized nitrogen (N) observed from marine sponges contains
37
is dictated by a presence or lack of microbial processes occurring within the tissue of the tested sponge (Diaz and Ward 1997, Jiménez and Ribes 2007, Hoffmann et al. 2009, Hoer 2015, this volume). Some sponge species host large microbial populations within their tissues, and the microbial consortia living within these high microbial abundance sponges (HMA sensu Hentschel et al. 2006) often represent as much as 40% of total sponge volume (Freeman and Thacker 2011). The microbial community hosted by these sponges drives diverse nutrient element transformations including nitrification (Southwell et al. 2008a, Hoffmann et al. 2009, Fiore et al. 2013), and may provide metabolic access to a wider range of organic substrates (Pawlik et al. 2015 and references therein). Sponge species with low numbers of associated microorganisms (termed low microbial abundance, LMA, sponges, Hentschel et al. 2006) produce ammonium-rich effluent with a chemical signature characteristic of animal-based metabolism (Southwell et al. 2008b).
The relative abundance of HMA sponges represents >50% the total sponge biomass below 15 m water depth on reefs throughout the Caribbean, and many reefs are characterized by a trend of increasing HMA sponge populations below this depth (Pawlik et al 2015). These expanding populations, the ability of HMA sponges to consume a wide range of particulate and dissolved organic matter (POM and DOM; Yahel et al. 2003, de Goeij et al. 2013, Hoer 2015, this volume), and the consequent efflux of reminieralized N (Corredor et al. 1988, Southwell et al. 2008b, Hoer 2015, this volume) make these organisms of critical importance to the cycling of carbon (C) and N at the reef scale. Yet, the extent to which the processes mediated by these organisms are conserved across environmental gradients is only beginning to be understood.
38
Florida Keys reef tract and those found on the oligotrophic reefs of San Salvador, Bahamas. X. muta was chosen as a target species because it is a conspicuous and important component of total
benthic biomass on reefs throughout the Caribbean (H. Büttner 1996, Armstrong et al. 2006), and is particularly prevalent on the Florida Keys reef tract where it can represent as much as 65% of total sponge biomass (Southwell et al. 2008b, McMurray et al. 2008, 2010). Further, X. muta is an HMA sponge, with tissue bacterial densities approaching 8 x 10⁹ microorganisms per gram of sponge wet weight (Hentschel et al. 2006), and thus is expected to be able to exploit a range of organic substrates for nutritive gain and exhibit significant nutrient element transformations in both environments (Southwell et al. 2008b, Fiore et al. 2013, Hoer 2015, this volume). This species has been previously shown to exhibit temporally and spatially variable DIN efflux (Southwell et al. 2008, Gibson 2011, Fiore et al. 2013) making it an ideal candidate for
exploration of behavioral stability across an environmental gradient. Sponge pumping rate and manipulations of DIN in filtered water were measured in situ using undisturbed individuals attached to their original substrate. This in situ approach allows sponge processes to be observed in the absence of environmental manipulations that may impact the natural behavior of the animal (e.g, Gerrodette and Flechsig 1979, Tompkins-MacDonald and Leys 2008, Fan et al. 2013).
Methods
Sample collection
Water samples were collected from X. muta individuals on Conch Reef (24°57’0.27”N, 80°27’12.21”W) in the Florida Keys and five reef sites around the island of San Salvador, Bahamas (Snow Bay: 23°56’38.06"N, 74°30'24.20"W; French Bay: 23°56'59.02"N,
39
74°32'22.89"W; Cockburn Town: 24° 1'34.49"N, 74°31'50.65"W). Water depth ranged from 8 to 31 m and the sampled individuals inhabited regions that spanned a variety of environmental conditions from the reef flat to the outer reef wall. X. muta is an excellent species for
quantitative measures of sponge-mediated biogeochemical transformations and pumping velocity as the species is characterized by a barrel morphology featuring a large, central osculum. This morphological feature facilitated non-disruptive sampling of the excurrent jet and allowed for precise quantifications of excurrent flow speed using the dye-front method and acoustic Doppler velocimetry.
40
Sponge water sampling was performed by divers on SCUBA using the “InEx” method (Yahel et al. 2005); collections in the Florida Keys were performed from August 9 to 16, 2011 and those on San Salvador were performed from March 2 to 9, 2013. Temporally paired, triplicate samples of ambient water near the exterior walls of the sponge (<20 cm from the outer wall of the sponge) and excurrent waters exiting the sponge as a coherent jet were collected during each sampling period. Ambient and excurrent pairs were collected within 10 minutes of one another, and each water sample was collected and simultaneously filtered with an in-line filter attached to a 60 mL polypropylene syringe by a polycarbonate stopcock. Attached to the filter and syringe was a 10 cm piece of small-diameter, high density polyethylene (HDPE) tubing which allowed samples to be collected with minimal disturbance to the target individual. A new pre-combusted, 25 mm Whatman GF/F filter was used to filter each water sample; GF/Fs were selected for filtration due to their suitability for combustion (baking at 450°C for >6 hours) and use in prior studies of DIN production by Caribbean sponges (e.g. Diaz and Ward 1997,
Southwell et al. 2008b). During sampling, the entire collection apparatus (syringe, tubing, filter, and stopcock) was rinsed 3x by pulling filtered target water into the syringe, and the rinsing water was expelled out of the open stopcock arm. The fourth and final sample was carefully drawn into the syringe (< 2 mL sec-1) in order to ensure that the collected sample was
41
Ammonium samples from Florida were analyzed immediately to reduce the potential impact of degradation on sample integrity but, due to logistical limitations, NH4+ samples from San Salvador were frozen and analyzed upon return to North Carolina. For each time point, the sampled parameters were collected in triplicate for further quality assurance and control.
All plastics utilized in sample collection and processing (including syringes, stopcocks, tubing, filter holders, sample bottles, and collection vial lids) were composed of polypropylene, HDPE, or polycarbonate and all were soaked in a 0.1M HCl bath for at least 12 hours and rinsed 6 times with 18.2 MΩ type I water prior to use and between each sampling. Due to limited
access to HCl in the Bahamas, sample collection plastics were not acid washed between uses and were only rinsed with copious amounts of 18.2 MΩ type I water. Borosilicate scintillation vials used for sample collection were subjected to the same washing procedure, followed by
combustion at 450°C for >6 hours to remove any residual nitrogenous material. Combusted glassware was stored in foil and bagged to minimize outside contamination prior to use. Filters were combusted at 450°C for >6 hrs. Amber HDPE bottles used for ammonium samples were acid washed and rinsed following the aforementioned protocol, and after this procedure small aliquots of the o-phthaladehyde working reagent was added to the bottles and allowed to react for 24 hours to ensure remove any residual ammonium from the sample bottle prior to use for standards or samples.
Sponge pumping rates
Sponge pumping rates were quantified using two methodologies, acoustic Doppler velocimetry and dye-front speed. The tested individuals on Conch Reef were continuously measured between May 25 and August 17, 2011 using Nortek Vector acoustic Doppler
42
the DOM samples (Hoer 2015, this volume), the ADV data presented therein was utilized for these collections. Detailed methodology for the deployment of instruments and the treatment of the resultant data (binning of sample blocks, despiking, etc.) is presented there. Pumping rates were determined for the sponges sampled around San Salvador by measuring the speed at which pulses of fluorescein dye were ejected from the osculum of the target individual (Weisz et al. 2008). A diver positioned a ruler 15 cm into the osculum and release discrete puffs of dye (n ≥ 40), measuring the time for the dye plug to travel to the rim of the sponge osculum. The average time required for the puffs to traverse this distance was taken to represent the vertical velocity of the excurrent jet (cm sec-1). Streams of dye were also released across the planar area of the osculum in order to determine the radial distribution of the exhalent stream velocities. Sample Analysis
Ammonium analyses were performed using the method of Holmes et al. (1999).
43
sample and NO2- produced from cadmium reduction of NO3- were determined
spectrophotometrically utilizing the Griess method (Adronato et al. 2007). The deployed instruments used 15 cm optical pathlengths which increased sensitivity and reduced the method detection limit to 25 nmol NOx- L-1 (determined by repeated analysis of standard solutions). Standards for NOx- measurements were prepared by dilution of a purchased stock (SPEX Certiprep AS-NO39-2Y and ASNO29-2Y), and analyzed daily with collected samples.
Results
Pumping Velocity